如果 SAP 系統在 Bare Metal 解決方案伺服器上執行,則必須使用Google Cloud's Agent for SAP,才能獲得 SAP 支援。
如果您使用下列「SAP 專用」RHEL 或 SLES OS 映像檔,則 Google CloudGoogle Cloud的 Agent for SAP 會與 OS 映像檔一併封裝:
- RHEL:所有「for SAP」映像檔
- SLES:SLES 15 SP4 for SAP 和後續版本
如要瞭解可在 Bare Metal Solution 伺服器上執行 SAP 的作業系統,請參閱下列文章:
如要在 Compute Engine 執行個體上安裝及設定第 1 版的Google CloudAgent for SAP,請參閱「在 Compute Engine 執行個體上安裝 Google CloudAgent for SAP」。
安裝總覽
您可以使用標準作業系統套件管理指令安裝 Google Cloud's Agent for SAP:在 RHEL 上使用 yum 指令,在 SLES 上使用 zypper 指令。套件管理指令會完成下列工作:
- 下載 Google Cloud的 Agent for SAP。
- 以 Linux
systemd服務的形式建立代理程式,並命名為google-cloud-sap-agent。 - 啟用並啟動服務
google-cloud-sap-agent。
安裝代理程式
建議您安裝最新版 Google Cloud's Agent for SAP, 因為最新版支援更多功能。如需操作說明,請參閱「在 Bare Metal 解決方案伺服器上安裝及設定 Google Cloud的 Agent for SAP」。
如要安裝 Google Cloud的 Agent for SAP 第 1 版,請與 Cloud 客戶服務聯絡。
安裝 Google Cloud's Agent for SAP 和 SAP Host Agent 後,請按照「驗證代理程式安裝作業」一文的說明,驗證 Google Cloud's Agent for SAP 的安裝作業。
驗證代理程式安裝
與 Bare Metal 解決方案伺服器建立 SSH 連線。
執行下列指令:
systemctl status google-cloud-sap-agent
如果代理程式正常運作,輸出內容會包含
active (running)。例如:google-cloud-sap-agent.service - Google Cloud Agent for SAP Loaded: loaded (/usr/lib/systemd/system/google-cloud-sap-agent.service; enabled; vendor preset: disabled) Active: active (running) since Fri 2022-12-02 07:21:42 UTC; 4 days ago Main PID: 1337673 (google-cloud-sa) Tasks: 9 (limit: 100427) Memory: 22.4 M (max: 1.0G limit: 1.0G) CGroup: /system.slice/google-cloud-sap-agent.service └─1337673 /usr/bin/google-cloud-sap-agent
如果代理程式未執行,請重新啟動代理程式。
確認 SAP 主機代理程式正在接收指標
如要確認基礎架構指標是由Google Cloud's Agent for SAP 收集,並正確傳送至 SAP Host Agent,請按照下列步驟操作:
- 在 SAP 系統中,輸入交易
ST06。 在「Overview」(總覽) 窗格中,查看以下欄位的可用性和內容,確認 SAP 和 Google 監控基礎架構已做好正確的端對端設定:
- 雲端服務供應商:
Google Cloud Platform - Enhanced Monitoring Access:
TRUE - Enhanced Monitoring Details (強化版監控功能詳細資料):
ACTIVE
- 雲端服務供應商:
在 Linux 上設定 Google Cloud的 Agent for SAP
安裝 SAP 專用代理程式後,您可以選擇設定代理程式,啟用「程序監控」指標和「工作負載管理員評估」指標的收集作業。 Google Cloud根據預設,系統只會啟用 SAP Host Agent 指標的收集作業。
Workload Manager 評估指標和程序監控指標收集作業僅支援 Linux。
如果您啟用 Workload Manager 評估指標和程序監控指標收集功能,則必須完成下列必要條件:
- 為代理程式建立 IAM 服務帳戶,以便存取Google Cloud資源。將必要的 IAM 角色授予服務帳戶。 詳情請參閱「設定服務帳戶」。
- 在 Bare Metal 解決方案伺服器上安裝 gcloud CLI。詳情請參閱「安裝 gcloud CLI」。
- 如要存取 Google Cloud,請授權 gcloud CLI。詳情請參閱「為 gcloud CLI 提供授權」。
- 建立與 Google Cloud API 的連線。詳情請參閱「設定內部部署主機的私人 Google 存取權」。
設定服務帳戶
如要讓代理程式存取 Bare Metal Solution 環境中的資源,請設定 IAM 服務帳戶。 Google Cloud
至少要為代理程式使用的服務帳戶,授予「監控指標寫入者 (roles/monitoring.metricWriter)」角色。
如要建立服務帳戶,請按照下列步驟操作:
-
Create a service account:
-
In the Google Cloud console, go to the Create service account page.
Go to Create service account - Select your project.
-
In the Service account name field, enter a name. The Google Cloud console fills in the Service account ID field based on this name.
In the Service account description field, enter a description. For example,
Service account for quickstart. - Click Create and continue.
-
Grant the Monitoring > Monitoring Metric Writer role to the service account.
To grant the role, find the Select a role list, then select Monitoring > Monitoring Metric Writer.
- Click Continue.
-
Click Done to finish creating the service account.
Do not close your browser window. You will use it in the next step.
-
-
Create a service account key:
- In the Google Cloud console, click the email address for the service account that you created.
- Click Keys.
- Click Add key, and then click Create new key.
- Click Create. A JSON key file is downloaded to your computer.
- Click Close.
將 JSON 金鑰檔案上傳至 Bare Metal 解決方案伺服器上安全的位置,代理程式可存取該位置。
啟用程序監控指標和 Workload Manager 評估指標收集功能
如要啟用程序監控指標和工作負載管理員評估指標收集功能,請按照下列步驟操作:
- 與 Bare Metal 解決方案伺服器建立 SSH 連線。
開啟下列設定檔:
/etc/google-cloud-sap-agent/configuration.json
在
collection_configuration部分中,將下列參數設為true:collect_process_metrics:可讓代理程式收集程序監控指標。如要收集 SAP HANA 資料庫指標,並存取及查詢 SAP HANA 資料庫,您需要在hana_metrics_config區段中設定其他參數。collect_workload_validation_metrics:啟用代理程式來收集 Workload Manager 評估指標。
如要進一步瞭解參數,請參閱下表。
儲存設定檔。
重新啟動代理程式,讓新設定生效。
sudo systemctl restart google-cloud-sap-agent
設定參數
下表說明 Google Cloud的 Agent for SAP 第 1 版設定參數。
| 參數 | |
|---|---|
provide_sap_host_agent_metrics |
如要啟用 SAP Host Agent 所需指標的收集作業,請指定 |
bare_metal |
在 Bare Metal 解決方案伺服器上安裝代理程式時,請指定 |
log_level |
如要設定代理程式的記錄層級,請設定必要值。 可用的記錄層級如下:
預設為 |
log_to_cloud |
如要將代理程式記錄重新導向至 Cloud Logging,請指定 |
cloud_properties.project_id |
如果 SAP 系統是在 Bare Metal 解決方案伺服器上執行,請指定您搭配 Bare Metal 解決方案使用的 Google Cloud 專案 ID。 |
cloud_properties.instance_id
|
指定您已安裝代理程式的 Bare Metal 解決方案伺服器名稱。 |
cloud_properties.region |
如果 SAP 系統是在 Bare Metal Solution 伺服器上執行,請指定 Bare Metal Solution 伺服器的區域。 |
cloud_properties.zone |
如果代理程式在運算執行個體上執行,根據預設,代理程式會使用部署運算執行個體的可用區。 |
cloud_properties.image |
指定執行個體的 OS 映像檔名稱。 |
cloud_properties.numeric_project_id |
指定 SAP 系統執行的 Google Cloud 專案的 ID 編號。 |
collection_configuration.collect_process_metrics |
如要啟用程序監控指標收集功能,請指定 |
collection_configuration.process_metrics_frequency |
以秒為單位指定程序監控指標的收集頻率。這個參數的預設值是 雖然您可以更新程序監控指標的收集頻率,但建議使用預設值。如要修改預設值,請在 |
collection_configuration.hana_metrics_config.hana_db_user |
指定代理程式用來查詢 SAP HANA 的資料庫使用者帳戶。預設值為 |
collection_configuration.hana_metrics_config.hana_db_password |
指定資料庫使用者帳戶的純文字密碼,代理程式會使用該帳戶查詢 SAP HANA。 建議您使用下列其中一個選項,而非指定純文字密碼:
|
collection_configuration.hana_metrics_config.hana_db_password_secret_name |
如要安全地提供資料庫使用者帳戶的密碼,供代理程式查詢 SAP HANA,請指定包含資料庫使用者帳戶安全憑證的密碼名稱。 只有在指定 |
collection_configuration.hana_metrics_config.sid |
指定 SAP HANA 執行個體的 SID。 |
collection_configuration.collect_workload_validation_metrics |
如要啟用 Workload Manager 評估指標收集作業,請指定 |
collection_configuration.workload_validation_metrics_frequency |
Workload Manager 評估指標的收集頻率 (以秒為單位)。預設值為 如要修改 Workload Manager 指標的收集頻率,請在 |
collection_configuration.workload_validation_db_metrics_config.hana_db_user |
指定用於查詢 SAP HANA 執行個體的帳戶。 使用者帳戶必須具備 SAP HANA 資料庫的讀取權限。 |
collection_configuration.workload_validation_db_metrics_config.hana_db_password |
指定用於查詢 SAP HANA 執行個體的使用者帳戶密碼。 |
collection_configuration.workload_validation_db_metrics_config.hana_db_password_secret_name |
在 Secret Manager 中指定儲存使用者帳戶密碼的密碼名稱。 |
collection_configuration.workload_validation_db_metrics_config.sid |
指定 SAP HANA 執行個體的 SID。 |
collection_configuration.workload_validation_db_metrics_config.hostname |
指定主機的 ID,可以是本機或遠端,用來代管 SAP HANA 執行個體。支援的值如下:
|
collection_configuration.workload_validation_db_metrics_config.port |
指定 SAP HANA 執行個體接受查詢的通訊埠。如果是第一個或唯一租戶資料庫執行個體,通訊埠為 |
collection_configuration.workload_validation_db_metrics_frequency |
SAP HANA 資料庫指標的收集頻率 (以秒為單位),用於 Workload Manager 評估。預設值為 |
預設設定
{
  "provide_sap_host_agent_metrics": true,
  "log_level": "INFO",
  "log_to_cloud": true,
  "collection_configuration": {
    "collect_workload_validation_metrics": false,
    "collect_process_metrics": false
  }
}
範例設定
如要在 Bare Metal 解決方案伺服器上安裝代理程式,您必須在設定檔中新增必要參數。以下範例顯示在 Bare Metal 解決方案伺服器上安裝代理程式的完整設定檔。
{
  "provide_sap_host_agent_metrics": true,
  "bare_metal": true,
  "log_level": "INFO",
  "log_to_cloud": true,
  "collection_configuration": {
    "collect_workload_validation_metrics": false,
    "collect_process_metrics": true,
    "hana_metrics_config": {
      "hana_db_user": "user",
      "hana_db_password_secret_name": "secret-name"
    }
  },
  "cloud_properties": {
    "project_id": "my-project",
    "instance_id": "bms-machine-1",
    "image": "rhel-8",
    "region": "us-central1"
  }
}
查看收集到的指標
如要以視覺化方式呈現代理程式收集的程序監控指標,可以使用Google Cloud 提供的下列自訂資訊主頁:
SAP 代理程式 - HANA 總覽: 這個資訊主頁會顯示圖表,提供下列指標的狀態總覽: SAP HANA 可用性、SAP HANA HA 可用性、SAP HANA HA 複製、 SAP HANA 服務狀態、HA 叢集 - 節點狀態,以及 SAP 執行個體的 HA 叢集 - 資源狀態。
這個資訊主頁的 JSON 檔案為
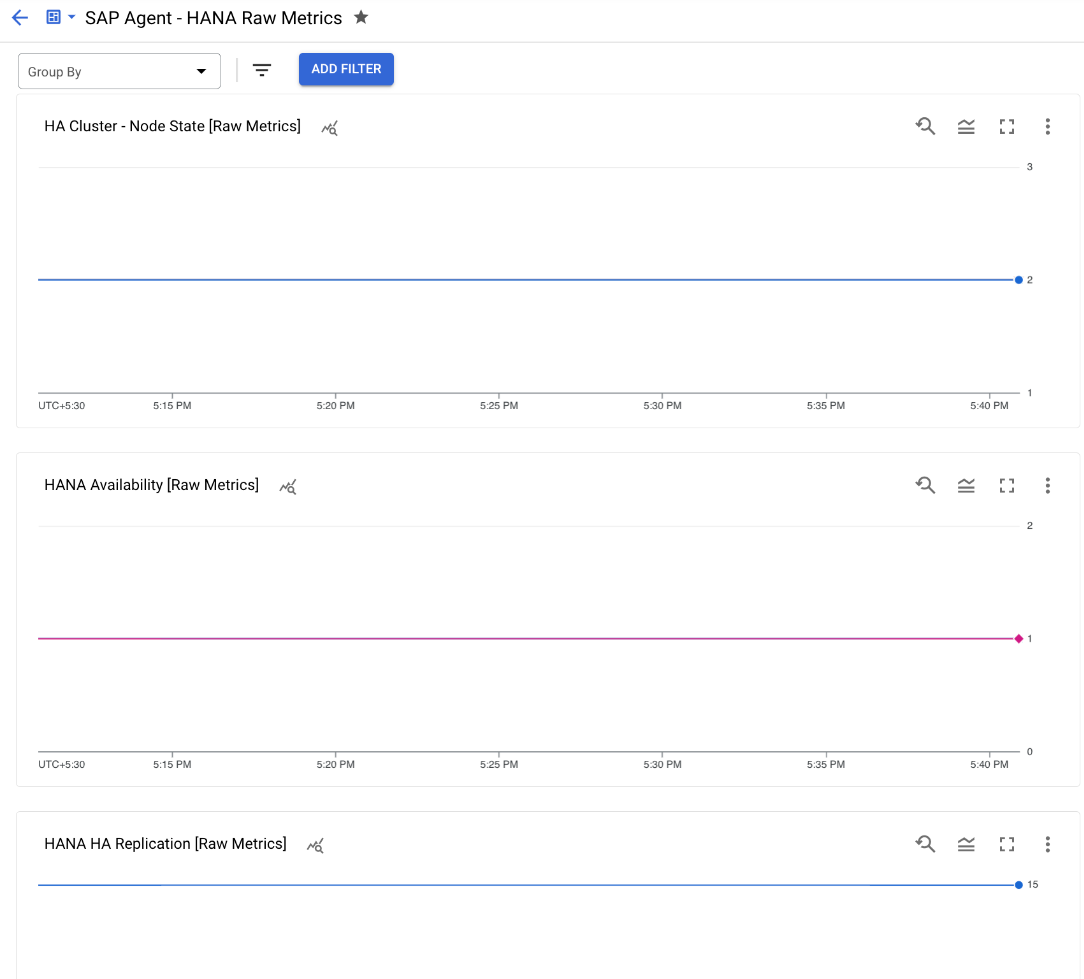
sap-agent-status-overview.json。SAP 專用代理程式 - HANA 原始指標: 這個資訊主頁提供圖表,顯示下列指標的原始指標值: SAP HANA 可用性、SAP HANA HA 可用性、SAP HANA HA 複寫、 SAP HANA 服務狀態、HA 叢集 - 節點狀態,以及 SAP 執行個體的 HA 叢集 - 資源狀態。
這個資訊主頁的 JSON 檔案為
sap-agent-raw-metrics.json。
安裝資訊主頁
如要安裝自訂資訊主頁,請完成下列步驟:
Google Cloud 控制台
前往 Google Cloud 控制台的「Monitoring」頁面:
在「Monitoring」導覽面板中,按一下「資訊主頁」。
按一下「範例庫」分頁標籤。
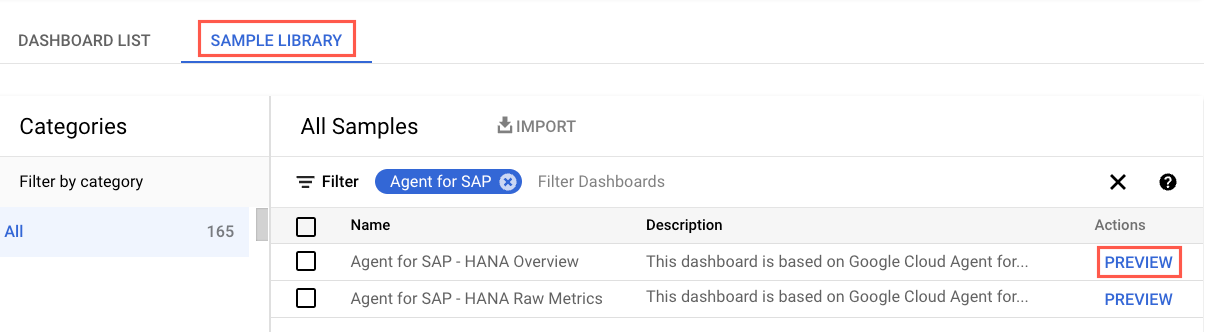
如要篩選特定代理程式的自訂資訊主頁,請在「篩選」欄位中輸入
Agent for SAP。(選用) 如要查看資訊主頁的詳細資料或預覽內容,請按一下「預覽」。
選取要安裝的資訊主頁。
依序按一下「匯入」和「確認」。
資訊主頁會新增至專案的可用資訊主頁中。Google Cloud 如要查看資訊主頁,請按照「查看已安裝的資訊主頁」一文中的操作說明進行。
Google Cloud CLI
開啟 Cloud Shell:
在 Cloud Shell 中,複製或下載存放區:
git clone https://github.com/GoogleCloudPlatform/monitoring-dashboard-samples/
在 Cloud Shell 中,使用對應的 JSON 檔案安裝所需資訊主頁:
gcloud monitoring dashboards create --config-from-file=CONFIG_FROM_FILE
請將
CONFIG_FROM_FILE改成指向包含資訊主頁設定的 JSON 檔案路徑。資訊主頁設定檔位於路徑:monitoring-dashboard-samples/dashboards/google-cloud-agent-for-sap。資訊主頁會新增至專案的可用資訊主頁中。 Google Cloud 如要查看資訊主頁,請按照「查看已安裝的資訊主頁」一文中的操作說明進行。
查看已安裝的資訊主頁
如要查看已安裝的資訊主頁,請按照下列步驟操作:
前往 Google Cloud 控制台的「Monitoring」頁面:
在「Monitoring」導覽面板中,按一下「資訊主頁」。
按一下清單中的資訊主頁名稱。
如果您有很多資訊主頁,可以篩選自訂資訊主頁或新資訊主頁的名稱。如要瞭解如何篩選這份清單,請參閱「查看自訂資訊主頁」一文。
下圖是範例,顯示 Monitoring 中 SAP HANA 指標的自訂資訊主頁部分內容。
疑難排解
如要瞭解如何診斷及解決安裝和設定 Google Cloud的 Agent for SAP 時可能遇到的問題,請參閱 Google Cloud的 Agent for SAP 疑難排解指南。
取得支援
如需解決Google Cloud's Agent for SAP 問題的協助,請收集所有可用的診斷資訊,然後與 Cloud Customer Care 聯絡。如要瞭解如何與 Customer Care 聯絡,請參閱「取得 SAP on Google Cloud支援服務」。