Google Cloud Observability
Integrated monitoring, logging, and trace managed services for applications and systems running on Google Cloud and beyond.
Start using Observability with Monitoring and Logging quickstart guides
Research shows successful reliability is 4.1 times more likely to incorporate observability
Stay up-to-date with the latest blogs and our o11y in-depth video series
Download the overview one-pager: Observability in Google Cloud
Key features
Key features
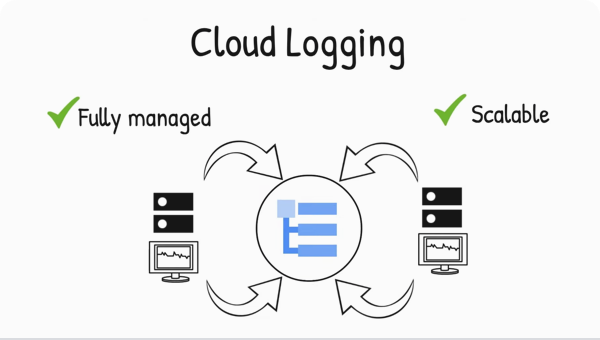
Real-time log management and analysis
Cloud Logging is a fully managed service that performs at scale and can ingest application and platform log data, as well as custom log data from GKE environments, VMs, and other services inside and outside of Google Cloud. Get advanced performance, troubleshooting, security, and business insights with Log Analytics, integrating the power of BigQuery into Cloud Logging.
Built-in metrics observability at scale
Cloud Monitoring provides visibility into the performance, uptime, and overall health of cloud-powered applications. Collect metrics, events, and metadata from Google Cloud services, hosted uptime probes, application instrumentation, and a variety of common application components. Visualize this data on charts and dashboards and create alerts so you are notified when metrics are outside of expected ranges.
Stand-alone managed service for running and scaling Prometheus
Managed Service for Prometheus is a fully managed Prometheus-compatible monitoring solution, built on top of the same globally scalable data store as Cloud Monitoring. Keep your existing visualization, analysis, and alerting services, as this data can be queried with PromQL or Cloud Monitoring.
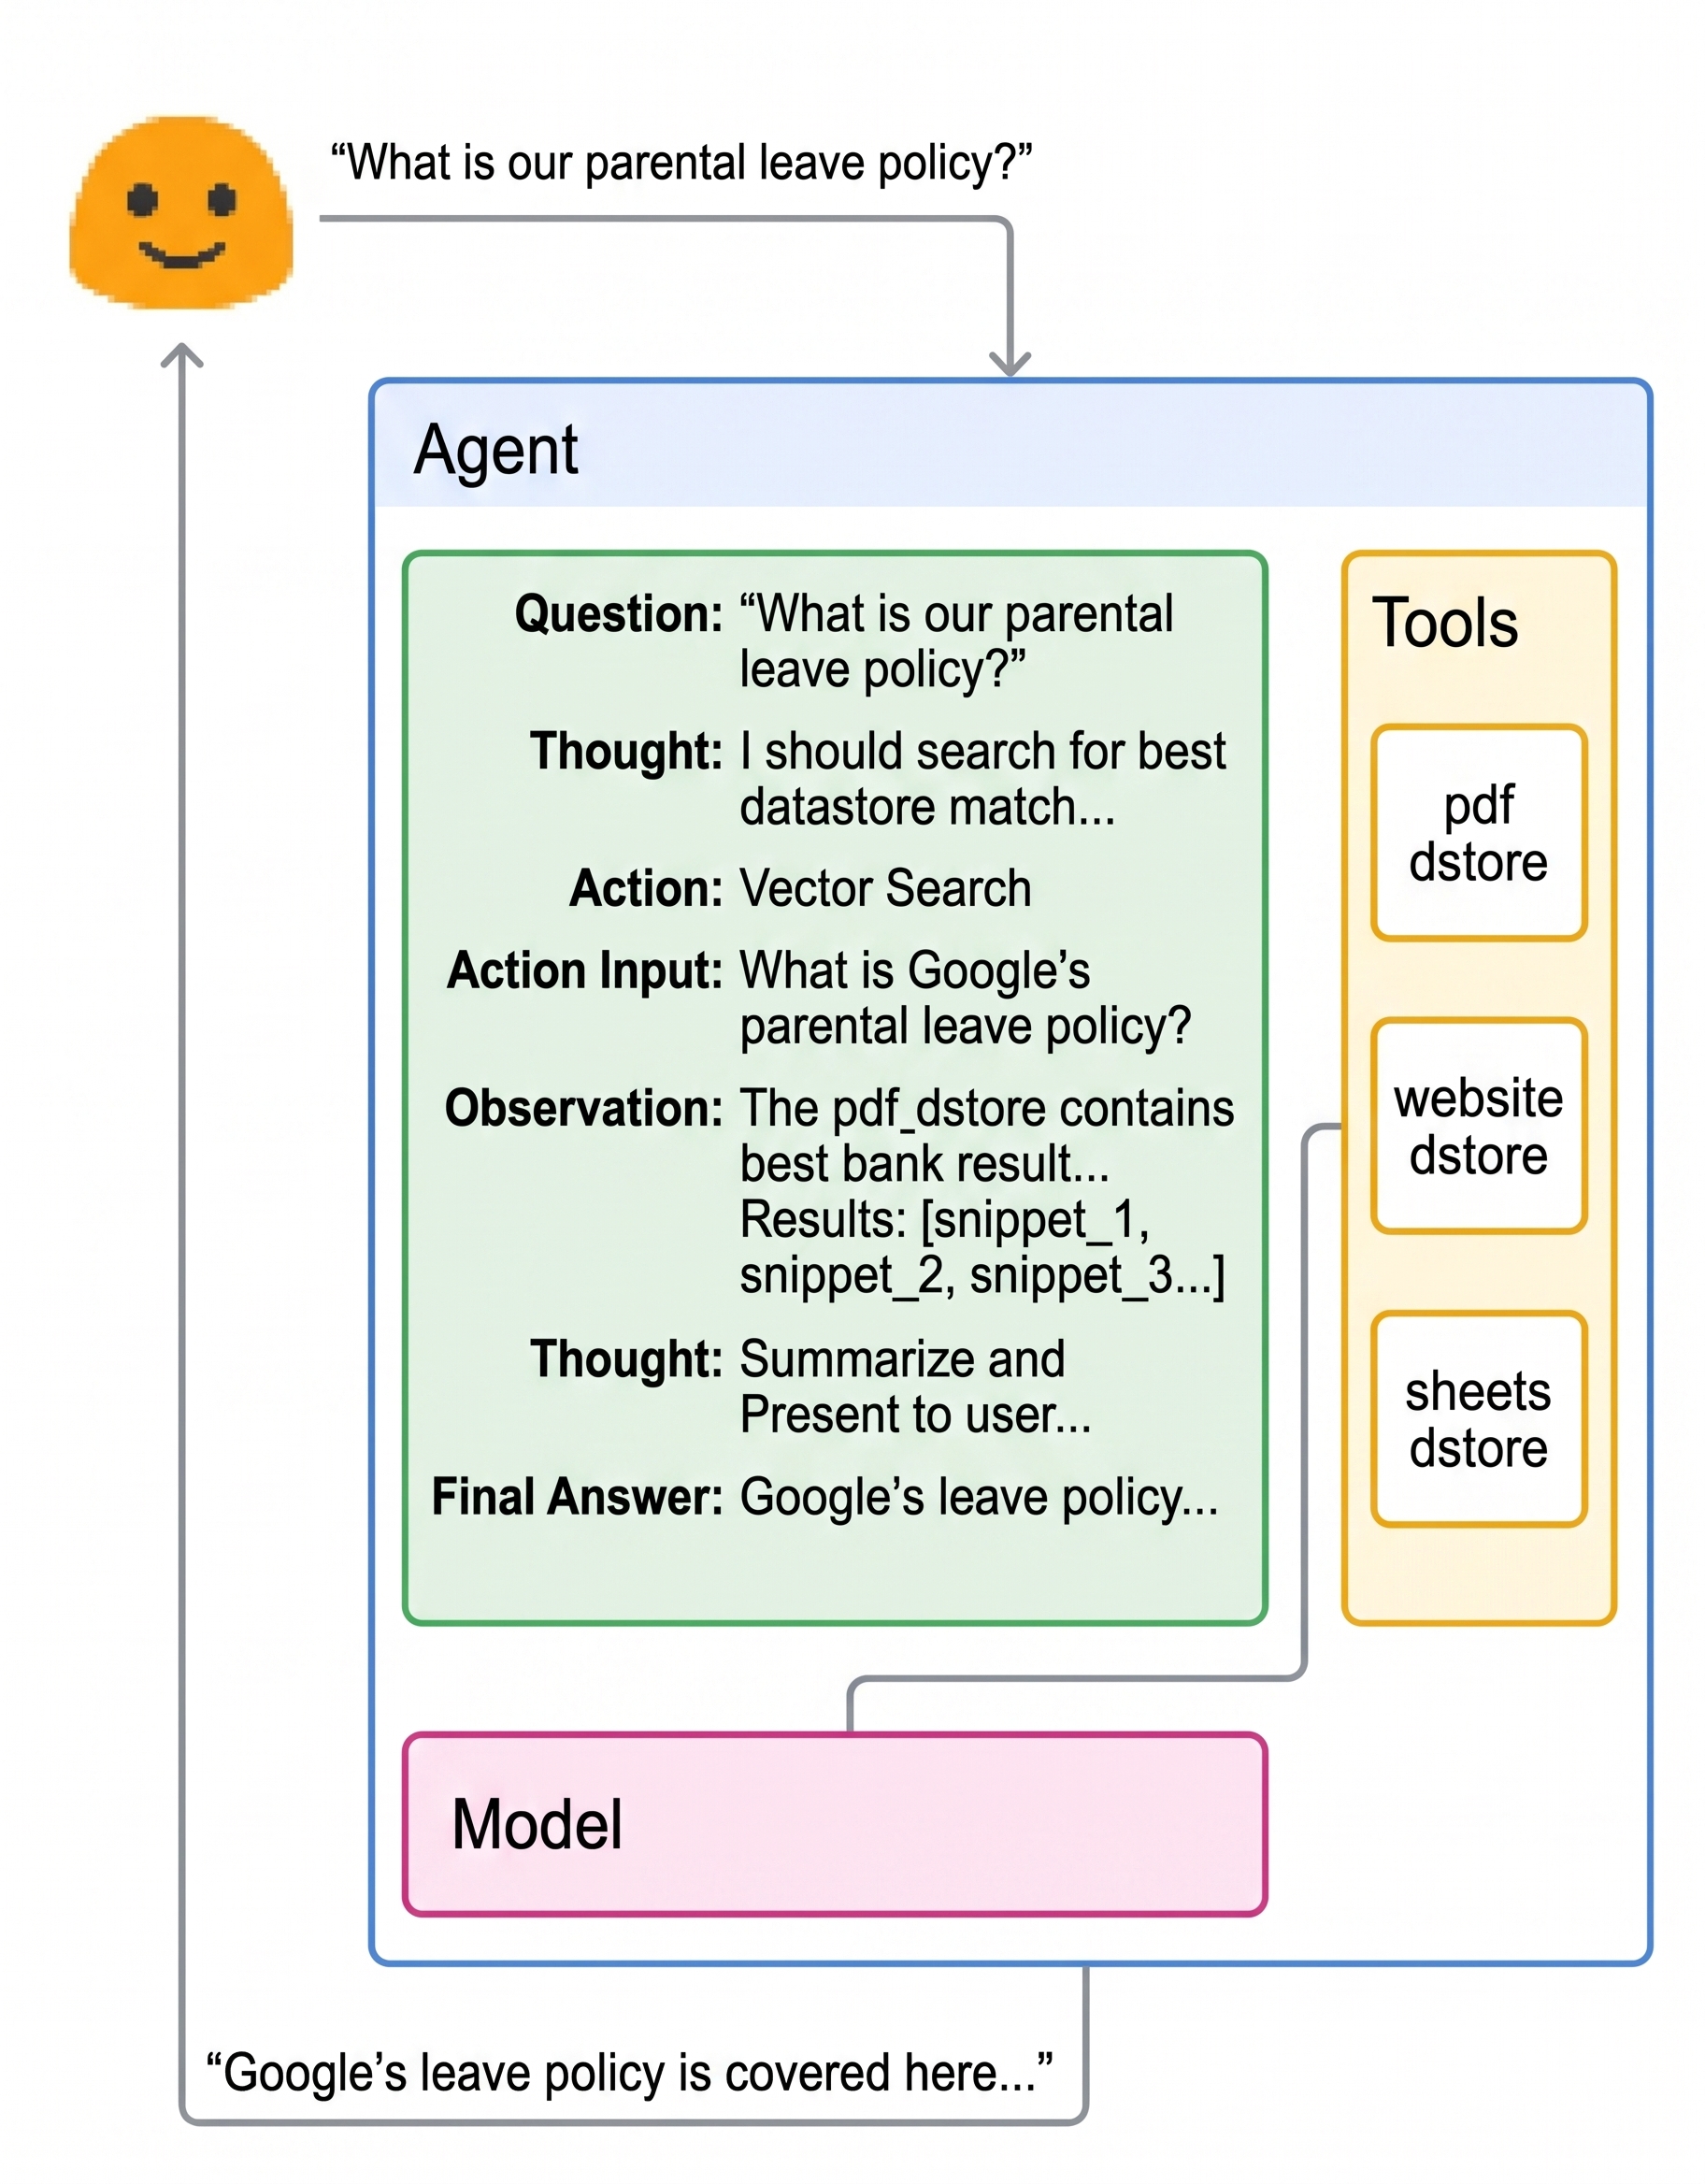
Monitor and improve your AI applications
In the rapidly evolving landscape of AI, building and deploying agents introduces unique challenges. AI agents can drift, hallucinate, and regress silently, failing in ways vastly different from traditional software. Leverage Google’s proven enterprise security and governance framework, extended specifically for AI agents, to ensure end-to access and unambiguous traceability for every agent action with Cloud Trace.
Customers
Learn from customers using operations tools


What's new
What's new
Sign up for Google Cloud newsletters to receive product updates, event information, special offers, and more.

Documentation
Documentation
Use cases
Use cases
Monitor your infrastructure
Cloud Logging and Cloud Monitoring provide your IT Ops/SRE/DevOps teams with out-of-the box observability needed to monitor your infrastructure and applications. Cloud Logging automatically ingests Google Cloud audit and platform logs so that you can get started right away. Cloud Monitoring provides a view of all Google Cloud metrics at zero cost and integrates with a variety of providers for non Google Cloud monitoring.

Troubleshoot your applications
Reduce Mean Time to Recover (MTTR) and optimize your application’s performance with the full suite of cloud ops tools. Use dashboards to gain insights into your applications with both service and custom application metrics. Use Monitoring SLOs and alerting to help identify errors.
All features
All features
| Log management | Log Router allows customers to control where logs are sent. All logs, including audit logs, platform logs, and user logs, are sent to the Cloud Logging API where they pass through the log router. The log router checks each log entry against existing rules to determine which log entries to discard, which to ingest, and which to include in exports. |
| Proactive monitoring | Cloud Monitoring allows you to create alerting policies to notify you when metrics, health check results, and uptime check results meet specified criteria. Integrated with a wide variety of notification channels, including Slack and PagerDuty. |
| Prometheus as a managed service | Offload the scaling and management of Prometheus infrastructure, updates, storage, and more with Managed Service for Prometheus. Avoid vendor lock-in and keep all of the open source tools you use today for visualization, alerting, and analysis of Prometheus metrics. |
| Custom visualization | Cloud Monitoring provides default out-of-the-box dashboards and allows you to define custom dashboards with powerful visualization tools to suit your needs. |
| Health check monitoring | Cloud Monitoring provides uptime checks to web applications and other internet-accessible services running on your cloud environment. You can configure uptime checks associated with URLs, groups, or resources, such as instances and load balancers. |
| Service monitoring | Service monitoring provides out-of-the-box telemetry and dashboards that allow troubleshooting in context through topology and context graphs, plus automation of health monitoring through SLOs and error budget management. |
| Latency management | Cloud Trace provides latency sampling and reporting for App Engine, including per-URL statistics and latency distributions. |
| Performance and cost management | Cloud Profiler provides continuous profiling of resource consumption in your production applications, helping you identify and eliminate potential performance issues. |
| Security management | Cloud Audit Logs provides near real-time user activity visibility across Google Cloud. |
Pricing
Pricing
The pricing for Google Cloud Observability lets you control your usage and spending. Google Cloud Observability products are priced by data volume or usage. You can use the free data usage allotments to get started with no upfront fees or commitments.
Cloud Logging
Feature | Price | Free allotment per month | Effective date |
|---|---|---|---|
Logging storage1 | $0.50/GiB; One-time charge for streaming logs into log bucket storage for indexing, querying, and analysis; includes up to 30 days of storage in log buckets. No additional charges for querying and analyzing log data. | First 50 GiB/project/month | July 1, 2018 |
Logging retention2 | $0.01 per GiB per month for logs retained more than 30 days; billed monthly according to retention. | Logs retained for the default retention period don't incur a retention cost. | April 1, 2023 |
No additional charge | Not applicable | Not applicable | |
No additional charge | Not applicable | Not applicable |
Cloud Monitoring
Feature | Price | Free allotment per month | Effective date |
|---|---|---|---|
Prometheus-format Monitoring data, such as most OTLP metrics and metrics ingested by using Managed Service for Prometheus | $0.060/million samples†: first 0-50 billion samples ingested# $0.048/million samples: next 50-250 billion samples ingested $0.036/million samples: next 250-500 billion samples ingested $0.024/million samples: >500 billion samples ingested | Not applicable | August 8, 2023 |
All other Monitoring data | $0.2580/MiB6: first 150–100,000 MiB $0.1510/MiB: next 100,000–250,000 MiB $0.0610/MiB: >250,000 MiB | All non-chargeable Google Cloud metrics First 150 MiB per billing account for metrics charged by bytes ingested | July 1, 2018 |
Monitoring API calls | No charge for write API calls Read API calls: $0.50/million time series returned♥ | Write API calls: Not applicable Read API calls: First 1 million time series returned per billing account | October 2, 2025 |
Monitoring API calls | $0.01/1,000 Read API calls (Write API calls are free) | First 1 million Read API calls included per billing account | July 1, 2018 through October 1, 2025 |
Execution of Monitoring uptime checks | $0.30/1,000 executions‡ | 1 million executions per Google Cloud project | October 1, 2022 |
Execution of Monitoring synthetic monitors | $1.20/1,000 executions* | 100 executions per billing account | November 1, 2023 |
$0.35 per month for each metric reference in an alerting policy $0.50 per 1,000,000 points returned by the query of a metric alerting policy condition♣ | Not applicable | September 1, 2027 |
Cloud Trace
Feature | Price | Free allotment per month | Effective date |
|---|---|---|---|
Trace ingestion | $0.20/million spans | First 2.5 million spans | November 1, 2018 |
1 Storage volume counts the actual size of the log entries prior to indexing. There are no storage charges for logs stored in the Required log bucket.
2 There are no retention charges for logs stored in the _Required log bucket, which has a fixed retention period of 400 days.
3 Log routing is defined as forwarding received logs to a supported destination. Destination charges might apply to routed logs.
4 There is no charge to upgrade a log bucket to use Log Analytics or to issue SQL queries from the Log Analytics page.
Note: The pricing language for Cloud Logging changed on July 19, 2023; however, the free allotments and the rates haven't changed. Your bill might refer to the old pricing language.
6 For pricing purposes, all units are treated as binary measures, for example, as mebibytes (MiB, or 220 bytes) or gibibytes (GiB, or 230 bytes).
# Samples are counted per billing account.
‡ Executions are charged to the billing account in which they are defined. For more information, see Pricing for uptime-check execution.
* Executions are charged to the billing account in which they are defined. For each execution, you might incur additional charges from other Google Cloud services, including services, such as Cloud Functions, Cloud Storage, and Cloud Logging. For information about these additional charges, see the pricing document for the respective Google Cloud service.
† Prometheus-format data, such as that emitted by Managed Service for Prometheus, is metered based on samples ingested instead of bytes to align with Prometheus' conventions. The Monitoring API is used to retrieve all metric data, including Prometheus-format data. For more information about sample-based metering, see Pricing for controllability and predictability. For computational examples, see Pricing examples based on samples ingested.
♥ There is no charge for read API calls issued through the Google API Console, excluding those issued through the Cloud Shell. Read API calls that aren't issued through the Google API Console and that can return time-series data are charged by the number of time series that are returned or for one time series, which ever is larger. There is no charge for other read API calls. For more information, see Cloud Monitoring API pricing.
♣ For more information, see Pricing for alerting.


Bindplane is a registered trademark of observIQ, Inc.
Take the next step
Start building on Google Cloud with $300 in free credits and 20+ always free products.
Need help getting started?
Contact salesWork with a trusted partner
Find a partnerContinue browsing
See all products