Use the Dashboard API to build your own monitoring dashboard
Charles Baer
Product Manager, Google Cloud
David Batelu
Technical Lead
Using dashboards in Cloud Monitoring makes it easy for you to track important system metrics. Creating dashboards by hand in the Monitoring UI can be a time-consuming process, especially if you want to use them in multiple different Monitoring Workspaces.
With the recent GA announcement for the Cloud Monitoring dashboards API, you now have a way to programmatically create dashboards. You can create a dashboard in the Monitoring UI, use the dashboards API to download the JSON configuration, then use the dashboards API to create a dashboard in a separate Workspace using the JSON configuration.
The Monitoring dashboards API
The Cloud Monitoring API provides a resource called projects.dashboards which offers a familiar set of methods: create, delete, get, list, and patch. The REST API accepts JSON payloads, which you can use to create dashboards, update existing dashboards or delete dashboards. Using the API requires a basic understanding of Cloud Monitoring dashboards. For details about creating dashboards in the Monitoring console, you can read the Creating charts section in the docs to find all the details.
The dashboard JSON payload
In order to create a dashboard via the dashboards API, you need to define several objects in the JSON payload data. This part is easy if you call the API to export the JSON configuration from an existing dashboard.
Here’s an example JSON payload:
There are several structures in the dashboard data model to understand:
- displayName—the human-readable name of the dashboard
- gridLayout, rowLayout, columnLayout—the container for the widgets
- widgets—the container for the chart items
- xyCharts—a chart model that displays data on a 2D (X and Y axes) plane
- dataSets—data for the chart object, which includes the details used to gather the specific data in a timeSeriesFilter object, including the metric name, metric filters and how the metric is aggregated.
- xAxis, yAxis—definitions affecting the presentation of the axes
- chartOptions—definitions affecting the mode of the chart
Building the dashboard JSON payload the easy way
A simple approach to building a dashboard configuration is to first create a dashboard in the Cloud Monitoring console, then use the dashboards API to export the JSON configuration. Once exported, you can share that configuration as a template, either via source control or however you normally share files with your colleagues.
The Dashboards API provides both a create and a get method. Building a dashboard in JSON from scratch requires detailed knowledge of the API data model and corresponding JSON syntax. A far simpler approach is to build the dashboard JSON configuration in the Dashboards section of Cloud Monitoring UI, then use the API to export the JSON representation of the dashboard. Once you have the JSON, you can use the create method to create another dashboard based on the JSON.
Creating an example dashboard
There are many ways to call the Cloud Monitoring API. One easy way to test out API calls is to use the “Try this API” functionality directly in the projects.dashboards.create method. Note that you’ll need to have a Cloud Monitoring Workspace defined and the GCP project ID for the project that contains the Workspace.
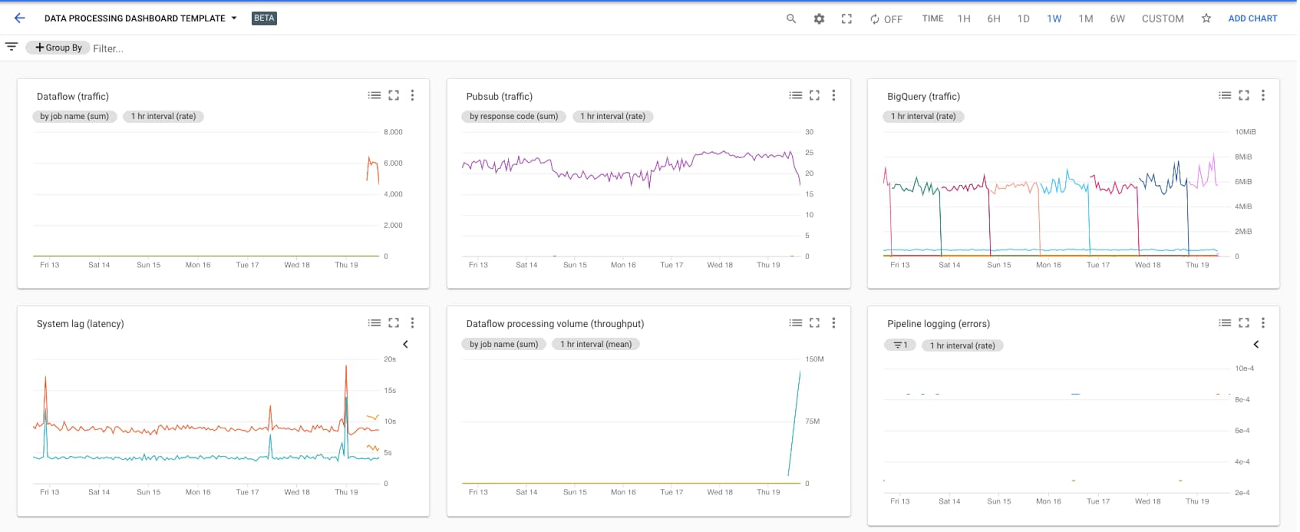
We created a sample JSON dashboard that includes six different charts, monitoring a data pipeline with Pub/Sub, Dataflow, and BigQuery components. You can use this JSON payload as a template for your own dashboard.
1. Create the dashboard, click the blue “TRY IT!” button to open the “Try this API” feature on the right-hand side of the projects.dashboards.create method.
2. Enter a value for the parent input form in the pattern “projects/YOUR_PROJECT_ID,” replacing your own GCP project ID that contains the Cloud Workspace where you want to create the dashboard for the “YOUR_PROJECT_ID” string value.
3. Highlight the default values in the “Request Body” input form, then copy/paste the JSON configuration for the dashboard.


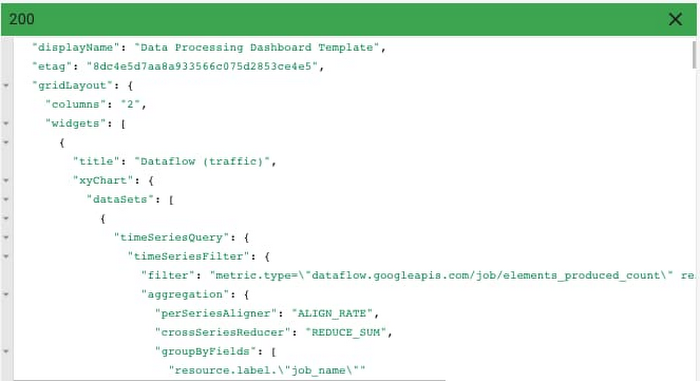
4. Click the “EXECUTE” button at the bottom of the page. If all goes well, you should see a green HTTP “200” response code, along with the JSON description of the dashboard you just created.

5. Open the Dashboards section in the Cloud Monitoring console to review your newly created dashboard. Find the “Data Processing Dashboard Template” and click the name to open the dashboard.
If you have already deployed Pub/Sub, Dataflow, and BigQuery resources, you should see values in the dashboard.

Exporting an existing dashboard
A common use case for this API is to export existing dashboard configurations, which can then be used to create a dashboard in another Workspace. You can export the configuration by calling the projects.dashboards.get method with the name of the dashboard.
1. Open the projects.dashboards.get API documentation and click the blue “TRY IT!” button, which opens the “Try this API” feature on the right-hand side of the page.
2. Enter a value for the parent input form in the pattern “projects/YOUR_PROJECT_ID/dashboards/YOUR_DASHBOARD_ID” replacing the host project id of the Workspace where you want to create the dashboard for the “YOUR_PROJECT_ID” string value and your dashboard ID for the “YOUR_DASHBOARD_ID” string value.
Note that you can find your dashboard ID from the URL when viewing your dashboard in the Monitoring UI. Here’s an example.
https://console.cloud.google.com/monitoring/dashboards/custom/e6ee2110-efc0-431e-bc1a-ce2600a207bc?project=YOUR_PROJECT_ID
If you don’t have your dashboard ID, you can instead call the projects.dashboards.list method, which will return a list of all your dashboards. The dashboard configuration can then be extracted from the list by finding the corresponding “Data Processing Dashboard” value in the displayName in the JSON configuration.
3. Click the “EXECUTE” button at the bottom of the page. If all goes well, you should see a green HTTP “200” response code along with the JSON description of the dashboard that you just created. The JSON snippet below shows the name of the dashboard, which you’ll need for the next API call.
4. Save this JSON configuration as a file. To use it to create a new dashboard, you have to make three changes to the JSON configuration:
a. Remove the “name” key/value pair
b. Remove the “etag” key/value pair
c. Update the “displayName” key/value to reflect the name for your new dashboard
5. Open the projects.dashboards.create API documentation and click the blue “TRY IT!” button which opens the “Try this API” feature on the right-hand side of the page.
6. Enter a value for the parent input form in the pattern “projects/YOUR_PROJECT_ID,” replacing your own GCP project ID that contains the Cloud Workspace where you want to create the dashboard for the “YOUR_PROJECT_ID” string value.
7. Click the “EXECUTE” button at the bottom of the page. If all goes well, you should see a green HTTP “200” response code along with the JSON description of the dashboard that you just created. The JSON snippet below shows the name of the dashboard which you’ll need for the next API call.
Making the API even more useful
Try other sample dashboard configurations and read more about the API via the Managing Dashboards documentation. We’re working on features to make the API even more useful, including through the gcloud command line. Also, contributors are discussing and planning the Terraform module for the Monitoring Dashboard API in github. As always, we’d love to hear your feedback through the Cloud Console feedback form.
