Managed Service for Prometheus
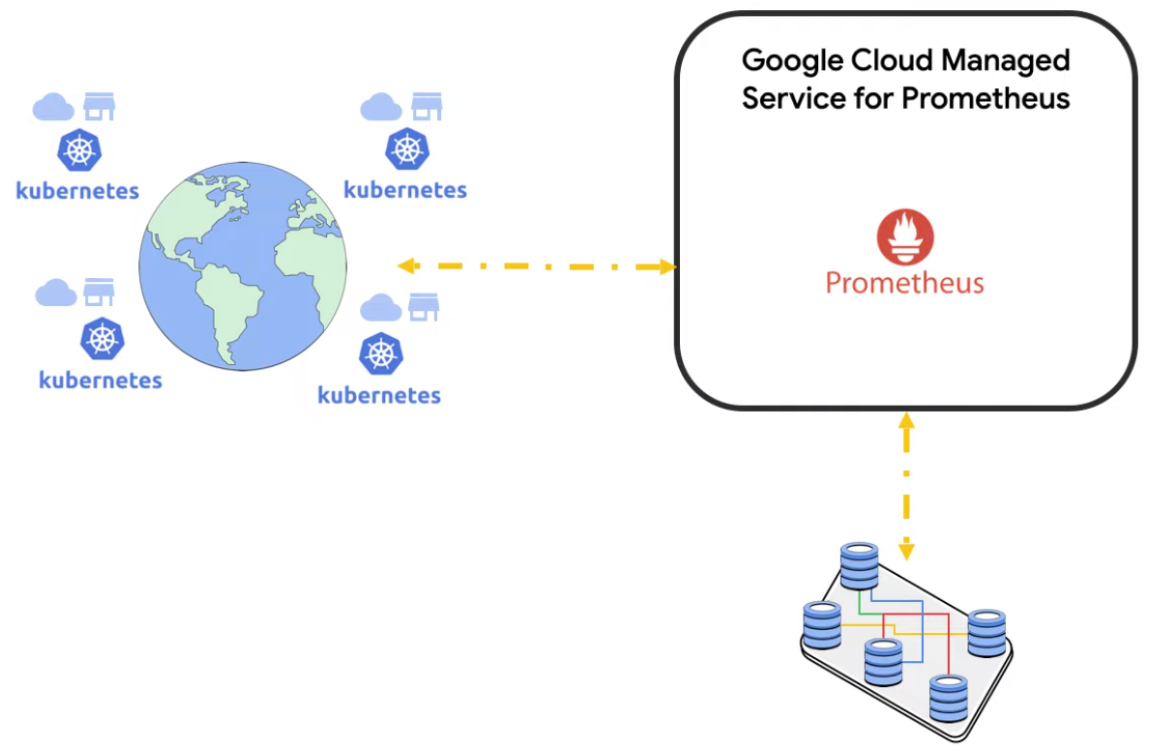
A fully managed and easy-to-use monitoring service, built on the same globally scalable data store used by Google Cloud.
Get started without the need for complex migration
Built on the same backend used by Google that collects over 2 trillion active time series
Learn more about what customers are saying
Hear what's new with the service
Benefits
Use Prometheus without managing infrastructure
Use Prometheus without managing infrastructure
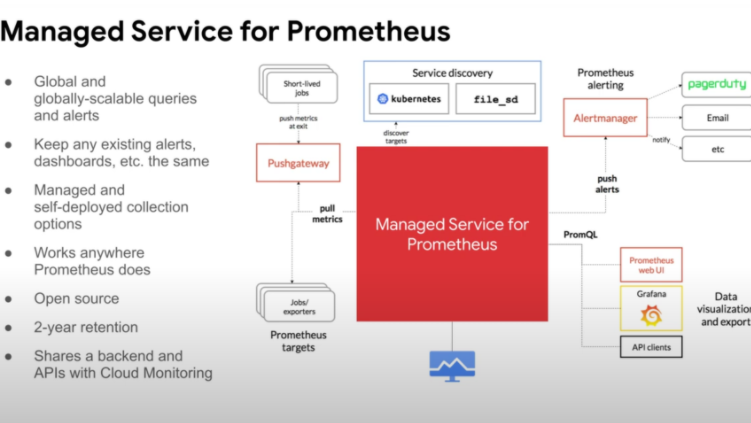
Fully managed Prometheus®-compatible monitoring stack with default two year retention and global queries over regionalized data. No need to federate, add resources manually, or devote time to maintenance.
Default two year metrics retention included
Default two year metrics retention included
Sharding an expanding storage footprint is a hassle when running your own Prometheus-compatible aggregator. To alleviate this pain point for you, all metrics are stored for two years at no additional charge.
Keep open source tooling and avoid vendor lock-in
Keep open source tooling and avoid vendor lock-in
Use PromQL with both Cloud Monitoring and open source tools like Grafana®. Configure deployment and scraping via any open source method, such as prometheus-operator or annotations.
Key features
Key features
Backed by Monarch, Google’s in-memory time series database
Managed Service for Prometheus uses the same technology that Google uses to monitor its own services, meaning that even the largest Prometheus deployments can be monitored at global scale. Additionally, the service is maintained by the same Site Reliability Engineering (SRE) team that maintains Google’s own monitoring, so you can be confident that your metrics will be available when you need them.
Use Cloud Monitoring with Managed Service for Prometheus
You can view Prometheus metrics and over 1,500 free Google Cloud system metrics together for a “single pane of glass” across your infrastructure and applications. Prometheus metrics can be used with the dashboarding, alerting, and SLO monitoring features inside Cloud Monitoring. Chart your Prometheus metrics right alongside your GKE metrics, your load balancer metrics, and more. Cloud Monitoring supports PromQL, so your developers can start using it immediately.
Managed or self-deployed collectors, and the Ops Agent
Managed Service for Prometheus offers managed collectors that are automatically deployed, scaled, sharded, configured, and maintained. Scraping and rules are configured via lightweight custom resources (CRs). Migration from a Prometheus operator is easy, and managed collection supports most use cases. You can also keep your existing collector deployment method and configurations if the managed collectors do not currently support your use case. The Ops Agent simplifies the collection of Prometheus metrics on Virtual Machines to make it easier for you to standardize all environments on Prometheus.
Customers
Customers are freeing up developer time and keeping their open source tools
We have been running Prometheus ourselves for GKE metrics, but the ongoing maintenance took up too many development hours. We started using Managed Service for Prometheus and it just works. It can handle whatever volume we have because it's built on the same back end that Google uses itself, and we get to keep using the same Grafana dashboards as before while keeping open standards and protocols.
Peter Kieltyka, CEO and Chief Architect, Horizon Blockchain Games

What's new
What’s new
Sign up for Google Cloud newsletters to receive product updates, event information, special offers, and more.
Documentation
Documentation
Use cases
Use cases
Diagnose problems with your applications quickly
Use PromQL to define alerts and diagnose issues when alerts are triggered. With Managed Service for Prometheus, you do not have to change your visualization tools or alerts so your existing incident creation and investigation workflows will continue working.
Cost-effectively monitor dynamic environments
Managed Service for Prometheus charges on a per-sample basis, which does not charge for cardinality up front when a new container is spun up. With per-sample pricing, you only pay while the container is alive, so you are not penalized for using Horizontal Pod Autoscaling. Managed Service for Prometheus features other cost controls such as customizable sampling periods, filters, and the ability to keep data local and not send it to the datastore.
Standardize on Prometheus across your environments
Adopting one metrics standard across your Kubernetes, serverless, and VM deployments makes it easier to bring dashboards together for better monitoring. Plus, your developers and administrators only need to know PromQL to work with your metrics. Managed Service for Prometheus supports this use case with collection options for GKE, Cloud Run, and the Ops Agent for VMs on Google Cloud.
All features
All features
| Stand-alone global rule evaluator | You can continue to evaluate your existing recording and alerting rules against global data in Managed Service for Prometheus. The results are stored just like collected data, meaning you will not need to co-locate aggregated data on a single Prometheus server. |
| Dynamic multi-project monitoring | Metrics scopes are a read-time-only construct in Cloud Monitoring that enables multi-project monitoring via a single Grafana data source. Each metric scope appears as a separate data source in Grafana and can be assigned read permissions on a per-service account basis. |
| Managed collectors | Managed collectors are automatically deployed, scaled, sharded, configured, and maintained. Scraping and rules are configured via lightweight custom resources (CRs). |
| Self-deployed collectors | Use your preferred deployment mechanism by simply swapping out your regular Prometheus binary for Managed Service for Prometheus’ collector binary. Scraping is configured via your preferred standard method and you scale and shard manually. Reuse your existing configs and run both regular Prometheus and Managed Service for Prometheus side by side. |
| Prometheus sidecar for Cloud Run | Get Prometheus-style monitoring for Cloud Run services by adding the sidecar. The sidecar uses Google Cloud Managed Service for Prometheus on the server side and a distribution of the OpenTelemetry Collector, custom-built for serverless workloads, on the client side. |
| Support for monitoring additional environments | Self-deployed collectors can be configured to collect data from applications running outside of Google Cloud. These targets can be Kubernetes or non-Kubernetes environments, such as VMs. |
| Use PromQL in Cloud Monitoring | Use PromQL in the Cloud Monitoring user interface, including in Metrics Explorer and Dashboard Builder. Get auto-completion of metric names, label keys, and label values. Query free system metrics, Kubernetes metrics, log-based metrics, and custom metrics, alongside your Prometheus metrics with PromQL. |
| Backed by Monarch, Google’s in-memory time series database | The service uses the same technology that Google uses to monitor its own services, meaning that even the largest Prometheus deployments can be monitored at global scale. |
| Cost control mechanisms | Help keep your spending under control with an exported metrics filter, a reduced charge for sparse histograms, a fee structure that charges less for longer sampling periods, and the ability to only send locally pre-aggregated data. |
| Cost identification and attribution | Use Cloud Monitoring to break out your Prometheus ingestion volume by metric name and namespace. Quickly identify the metrics that cost you the most and which namespace is sending them. |
| Ex: Live migration for VMs | Ex: Compute Engine virtual machines can live-migrate between host systems without rebooting, which keeps your applications running even when host systems require maintenance. |
Pricing
Pricing
The pricing for Managed Service for Prometheus lets you control your usage and spending. Learn more in the pricing details guide.
Feature | Price | Free allotment per month | Effective date |
|---|---|---|---|
Metrics ingested by using Google Cloud Managed Service for Prometheus | $0.060/million samples†: first 0-50 billion samples# $0.048/million samples: next 50-250 billion samples $0.036/million samples: next 250-500 billion samples $0.024/million samples: >500 billion samples | Not applicable | August 8, 2023 |
Monitoring API calls | No charge for write API calls Read API calls: $0.50/million time series returned♥ | Write API calls: Not applicable Read API calls: First 1 million time series returned per billing account | October 2, 2025 |
†Google Cloud Managed Service for Prometheus uses Cloud Monitoring storage for externally created metric data and uses the Monitoring API to retrieve that data. Managed Service for Prometheus meters based on samples ingested instead of bytes to align with Prometheus' conventions. For more information about sample-based metering, see Pricing for controllability and predictability. For computational examples, see Pricing examples based on samples ingested.
#Samples are counted per billing account.
♥ There is no charge for read API calls issued through the Google Cloud console, excluding those issued through the Cloud Shell. Read API calls that aren't issued through the Google Cloud console and that can return time-series data are charged by the number of time series that are returned or for one time series, which ever is larger. There is no charge for other read API calls. For more information, see Cloud Monitoring API pricing.
The Grafana Labs Marks are trademarks of Grafana Labs, and are used with Grafana Labs’ permission. We are not affiliated with, endorsed or sponsored by Grafana Labs or its affiliates.
Take the next step
Start building on Google Cloud with $300 in free credits and 20+ always free products.
Need help getting started?
Contact salesWork with a trusted partner
Find a partnerContinue browsing
See all products


