Improved cost visibility and 60 percent price drop for Managed Service for Prometheus
Lee Yanco
Senior Product Manager
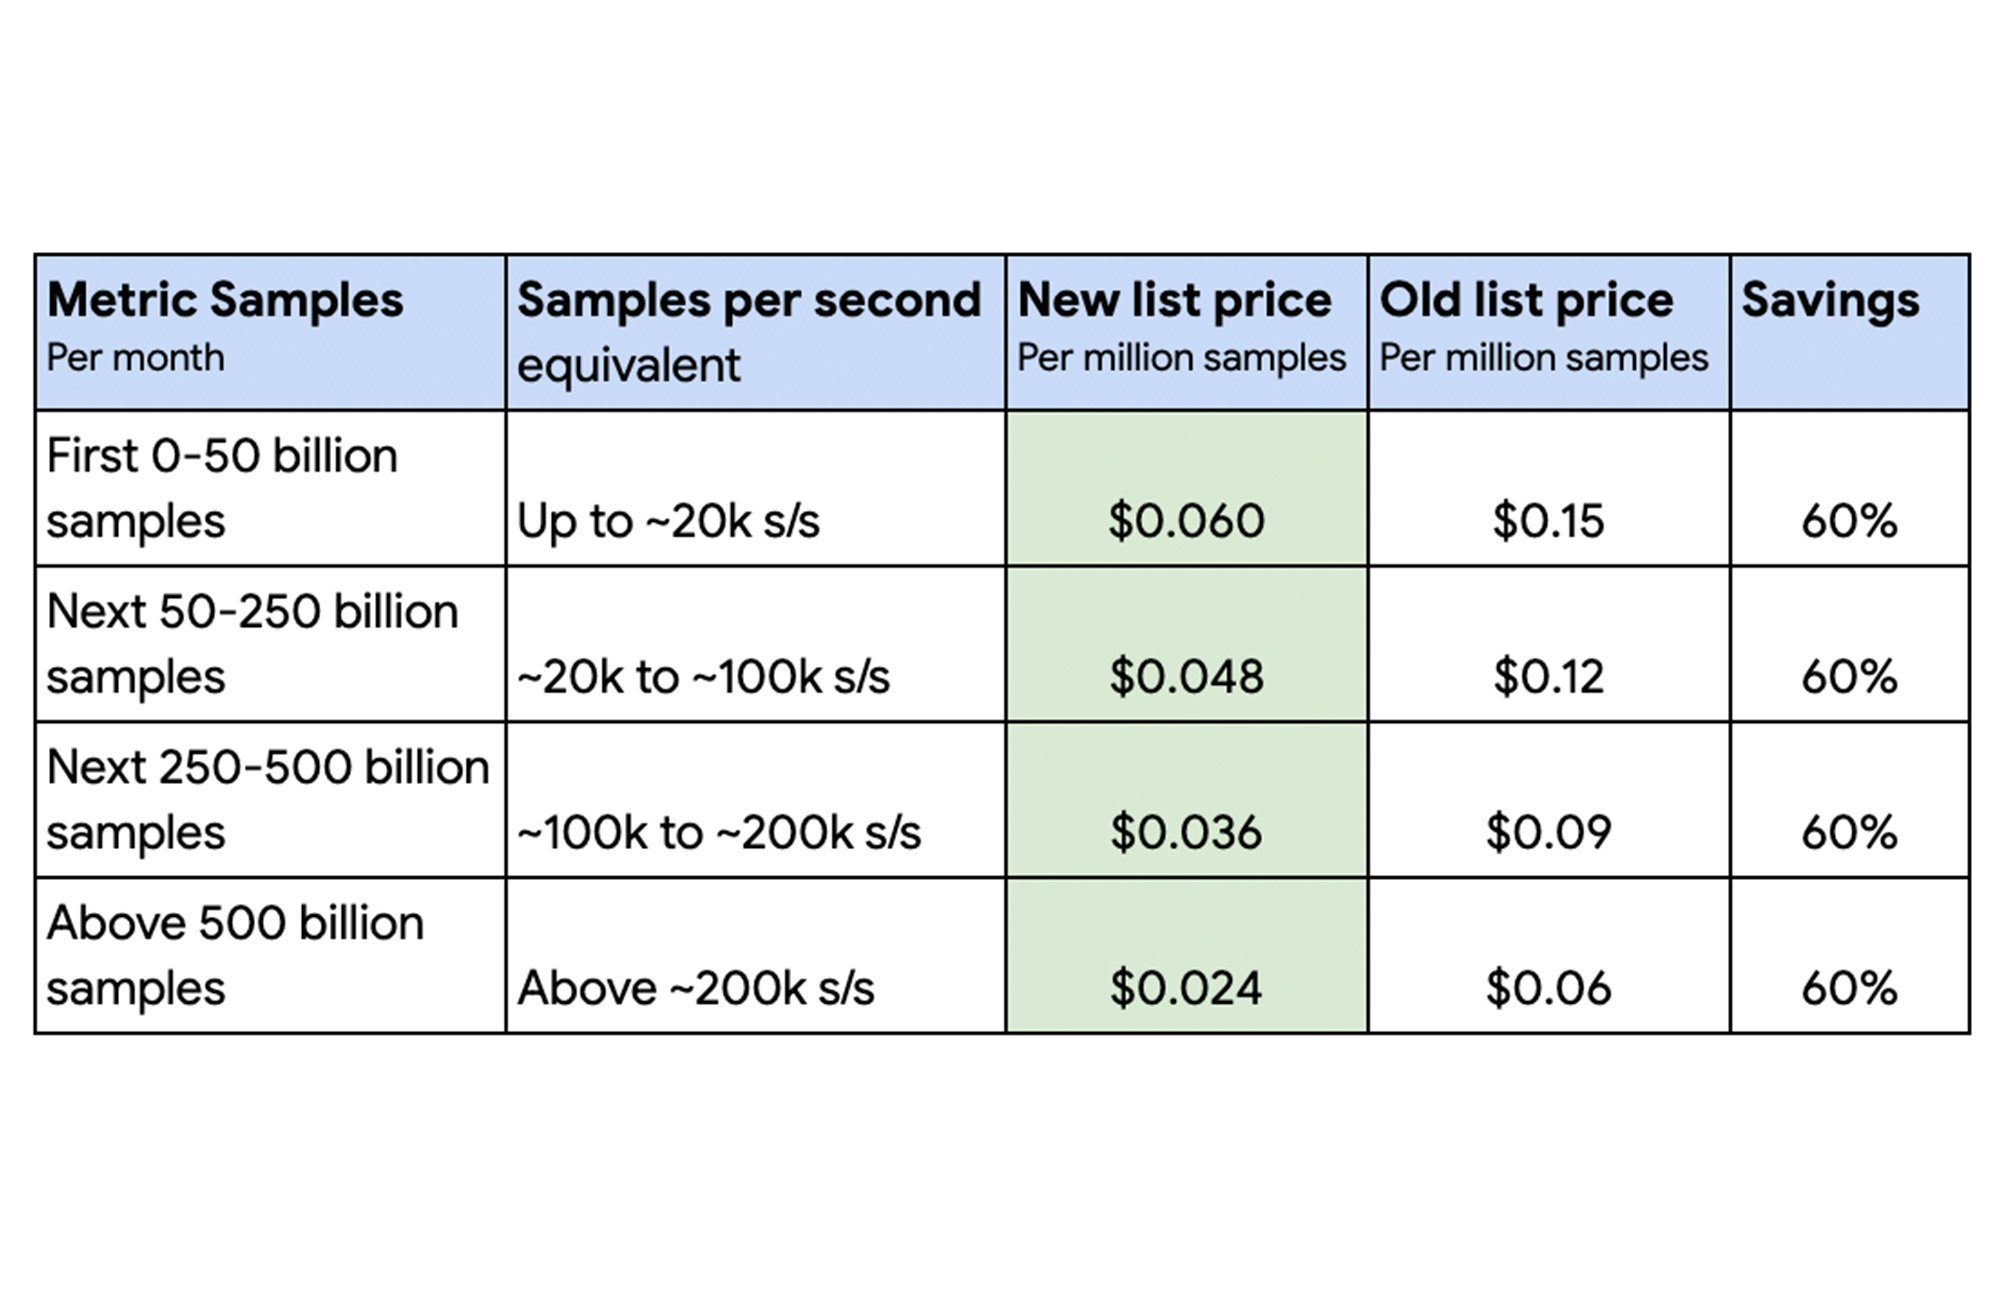
Prometheus is the de facto standard for Kubernetes application metrics, but running it yourself can strain engineering time and infrastructure resources, especially at production scale. Our Managed Service for Prometheus can help you offload that burden, freeing up your engineers to build your next big application rather than spending time building out metrics infrastructure. And today, we’re excited to announce a 60% price reduction for samples ingested into Managed Service for Prometheus, effective immediately.
Now, companies of all shapes and sizes can get global observability as a service without having to excessively filter or drop metrics to keep costs down. See the table below for the new price tiers for ingestion:


Spot more cost-optimization opportunities
Lowering the price is only the first stage of our cost-optimization initiative. As many applications can export hundreds, if not thousands, of metrics to Prometheus, costs can add up when you send a large volume of completely unfiltered metrics to a managed service — even with the lower price. As a result, you may be paying for metrics that you barely use — or that you don’t use at all.
Identifying what metrics are the most expensive can be hard. To help, we’ve revamped our Metrics Management page, now in Preview. With Metrics Management you can easily identify high-cost metrics, pinpoint which namespaces or teams are responsible for them, see whether they’re used in any dashboards or alerts, and if you decide they’re not valuable, filter them out at the source. Soon you’ll also be able to see how often a metric is read, so you can better determine whether to keep paying for a high-volume metric that has low usage.
To get started, visit Metrics Management in the Google Cloud console or check out the documentation for how to perform some common cost optimization use cases.
Save time managing observability infrastructure
While we’ve lowered the price for ingested samples, Managed Service for Prometheus’ functionality stays exactly the same. It’s still designed to be a drop-in replacement for running your own Prometheus stack, so you can gather, store, and alert on your metrics globally without changing your existing dashboards or alerts, offering the following features:
Global querying and alerting across all your projects, regions, clusters, and environments, backed by Google’s Monarch time series database
Two-year retention of all metrics, included in the price
Over 1,500 free Cloud Monitoring system metrics, queryable using PromQL, right alongside your Prometheus metrics
Optional horizontally scalable managed collectors, built into GKE, which incur no management overhead on your part
Your choice of using either PromQL in the Cloud Monitoring UI or Grafana
Easy cost identification and attribution using Cloud Monitoring
Support for OpenTelemetry-based collection, including in Cloud Run environments
Agent-based collection of Prometheus metrics in Compute Engine environments
For inspiration on how to use it at scale, check out this post on how The Home Depot uses Managed Service for Prometheus to get a single pane of glass for its operations across 2,200 stores.
What’s next
Whether you are a mature enterprise, a rapidly scaling digital-native, or somewhere in between, freeing up your engineers’ time to build your next big application can pay huge dividends. Offloading the burden of scaling monitoring infrastructure should be an easy decision, not one that’s complicated by a high cost.
If you’re already using Managed Service for Prometheus, no action is necessary for you to get the lower price. If you’re new, visit the Managed Service for Prometheus documentation or the GKE Clusters page in the Cloud Console to get started.


