Google Cloud Monitoring 101: Understanding metric types
Rakesh Dhoopar
Director, Outbound Product Management
Try Google Cloud
Start building on Google Cloud with $300 in free credits and 20+ always free products.
Free trialWhether you are moving your applications to the cloud or modernizing them using Kubernetes, observing cloud-based workloads is more challenging than observing traditional deployments. When monitoring on-prem monoliths, operations teams had full visibility over the entire stack and full control over how/what telemetry data is collected (from infrastructure to platform to application data). In cloud-based applications, aggregating, integrating, and analyzing telemetry for full visibility is more complex because:
Data originates from more sources: in addition to telemetry data from your application/workload components, there is a need to integrate telemetry data from the cloud infrastructure (VM, Load balancers etc.), cloud platform (Kubernetes, docker etc.), and cloud services (storage, databases etc.).
Systems have different levels of visibility: the variety of sources from which telemetry data is collected provides different mechanisms for data collection. Some expose this data through APIs, others require users to install agents. While some services push data to an endpoint, others require users to pull data from an endpoint.
The granularity of data collection, retention, and aggregation can differ: for some sources, data can be collected with fine granularity (seconds) while other sources still only expose data at coarser granularity (minutes). Some telemetry data is retained for short periods of time (days) while other data is retained for much longer periods (years).
In addition to these technical dimensions, the cost of running an observability solution can be a concern. Given that you have control over only some of the metric data you can collect, you may ask yourself: “What telemetry data do I have to pay for and what telemetry data is available at no cost as a part of the service I am using?”
While observability encompasses different signals, including metrics, events, traces, and logs, this blog focuses on collecting metrics in Google Cloud. This blog will describe three aspects of metric collection in Google Cloud:
The variety of types of metrics that are collected.
How different types of metrics are collected.
Which metrics are chargeable and which are non-chargeable.
We will explore these aspects through three offerings: Google Compute Engine (GCE), Google Kubernetes Engine (GKE) and Google BigQuery (BQ). These three examples represent the different levels of control users have on the level of visibility into Google Cloud Services.
GCE: almost full control over deploying agents to collect metrics
GKE: some control over deploying agents to collect metrics
BQ: no control over deploying agents to collect metrics
Types of Metrics
There are many types of metrics collected across these three classes of services, but they can be broadly grouped into four categories: System metrics, Agent metrics, User-defined metrics and Logs-based metrics.
1. System metrics:
System metrics are instrumented and collected by Google Cloud to provide visibility into how platform-managed services are behaving. You do not need to deploy an agent to collect them, and they are automatically sent to Google Cloud Monitoring.
Depending on the usage context, these metrics may be referred to by different names, but broadly speaking they are all grouped into System Metrics. System Metrics are also commonly called Google Cloud Metrics, GCP Metrics, “built-in” metrics, system-defined metrics, platform metrics, or Infrastructure metrics. Different service types may also refer to them with different terms:
Infrastructure as a service (IaaS) users may refer to them as infrastructure metrics.
Platform as a service (PaaS)/containers as a service (CaaS) users may refer to them as platform metrics.
Software as a service (SaaS) users may refer to them as service metrics.
Regardless of the usage context, they are all “built-in metrics.” When the usage context is for a specific Google Cloud service, sometimes you also see them referred to as:
Kubernetes metrics: collected from GKE. Older versions of GKE called them container metrics. Metric names of this type are prefixed with kubernetes.io. These are resource metrics for containers, pods, and nodes in your Kubernetes cluster.
Anthos metrics: collected from Anthos on-prem and Anthos on bare metal. Metrics of this type are prefixed with kubernetes.io/anthos.
Istio metrics: collected from Istio on Google Kubernetes Engine. Metrics of this type are prefixed with istio.io.
Knative metrics: collected from Knative on Google Kubernetes Engine. Metrics of this type are prefixed with knative.dev.
2. Agent metrics:
Agent metrics refer to a broad set of metric types. As the name suggests, Agent Metrics require you to install an agent (either the Cloud Monitoring agent or the unified Ops Agent) for metric collection. Agent-based metrics do not require application developers to instrument metrics and are available as pre-packaged receivers/collectors that need to be configured in the agent. User-installed agents collect metrics of the following types:
Resource metrics: metrics about any resource, including compute, network, or storage for a virtual machine (VM). These resources could be Google Cloud managed (like a GCE VM), customer managed (e.g an on-prem host) or a resource on a different cloud (AWS VM).
Process metrics: resource metrics provide high level visibility, at the VM-level, for example. Process metrics are fine grained and include measurements such as CPU, memory, I/O, number of threads, and more for specific processes (like a data backup process) running in VMs.
Third-party metrics: metrics about any third-party or open source software running in a VM (GCE or somewhere else) or a container (Nginx, Kafka, MySQL etc.) These metrics provide purpose-built visibility into the internal operations of these software components.
Note: the Ops Agent can also collect metrics about itself, prefixed by agent.googleapis.com/agent. Metrics collected by the agent about other software components are prefixed by agent.googleapis.com/<name of component>
3. User-defined metrics:
User-defined metrics provide visibility into your deployed applications or workloads and are defined and instrumented by you. User-defined metrics can include:
Custom metrics: custom metrics can be ingested either by using the client libraries, the Cloud Monitoring API, or by deploying the Ops Agent to collect metrics and then ingest them into Cloud Monitoring. They are identified with the prefix custom.googleapis.com.
Workload metrics: workload metrics encompass a wide range of data produced by applications running on your resources. Whether these applications are monoliths, containers, or data processing ETL jobs, you have to instrument your code to generate metrics specifically relevant to the task at hand. These metrics capture something about the resources the workload is using (e.g. memory consumption by application objects, or the number of data records processed by a SPARC job) or possibly some business metrics (number of users placing orders or total dollar volume processed). Workload metric names are identified with the prefix workload.googleapis.com. Again, depending on the context, workload metrics may also be referred to as “Application metrics” or “Job metrics.”
External metrics: collected from open source or third party applications. Metrics sent to Google Cloud projects with a metric type beginning with external.googleapis.com are known as external metrics.
Prometheus metrics: some Kubernetes users use Prometheus to monitor their Kubernetes environments. In addition, they propagate Prometheus metrics to Google Cloud Monitoring to take advantage of its rich capabilities. You can configure Prometheus with Cloud Monitoring. In that case metrics exported by Prometheus are converted to Cloud Monitoring metric types.
4. Logs-based metrics:
Logs-based metrics are generated from logs ingested into Cloud Logging. These metrics can be created either by counting log events that match a certain pattern or by extracting and aggregating the fields in specific log events. Logs-based metrics are then written to Cloud Monitoring and can be used for alerting, charting, and dashboarding. Logs-based metrics can be of two types: user-defined (where the definition is created by you) and system-defined (where the definition is available out of the box and you cannot modify them).
Metric Collection
Metrics are collected from Google services and your applications running on Google services in several different ways. Let’s take a look at the different collection mechanisms without going into each specific metric.
1. Collecting metrics from GCE:
GCE metrics are collected using two different mechanisms:
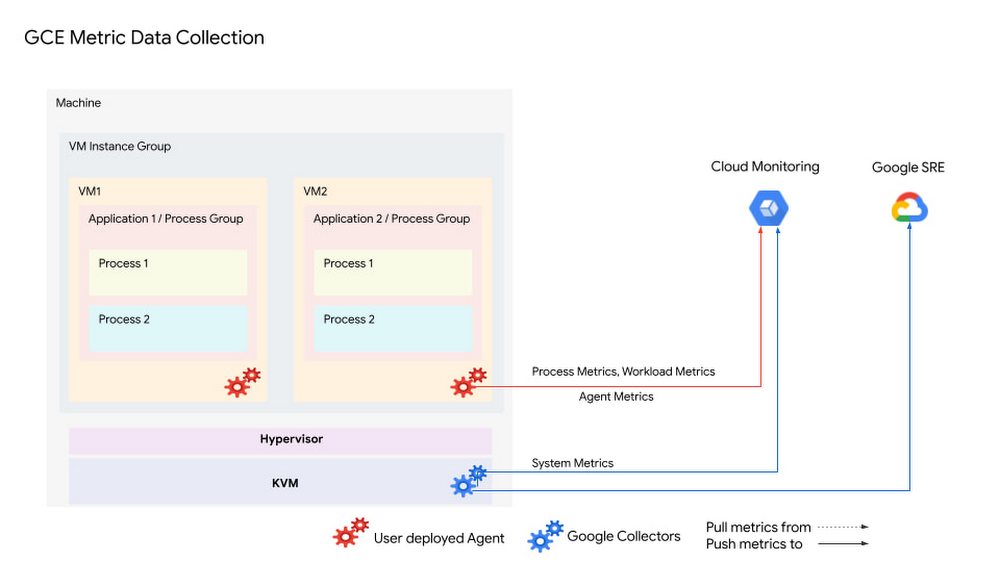
As mentioned earlier, system metrics (or infrastructure metrics) for GCE do not require you to install any metric collection agents. Google automatically collects and pushes these metrics to your project (See Figure 1). System metrics are generally batched before ingestion into Cloud Monitoring.
The second mechanism for collecting GCE metrics is to install the Ops Agent or legacy Monitoring agent. Installing the agent gives you specific advantages in two areas:
- Collect system metrics with much finer granularity (less than 1 minute) or access to process metrics for individual Linux or Windows processes.
- As your developers deploy their applications in GCE VMs, they can also generate application metrics. The agent collects and loads metrics into your projects almost instantly for faster analysis, alerting and dashboarding.

2. Collecting metrics from GKE (without Prometheus):
GKE metrics are also collected using two different mechanisms when you are not using Prometheus. The metric collection scenario is a bit complex because a GKE cluster has some nodes that are user managed and others, like the control plane nodes, that are Google managed. Much like the GCE environment, system metrics are collected without deploying an agent.
For GKE nodes that are customer managed, metrics can be collected for different resources and workloads. For the GCE VM (underlying the Kubernetes nodes), system metrics are captured by Google collectors and sent to your Cloud project. For collecting platform metrics, Google collectors are automatically deployed in the GKE customer managed nodes when the Kubernetes cluster is created. These collectors gather Kubernetes metrics via the Kubelet and publish them to your project.
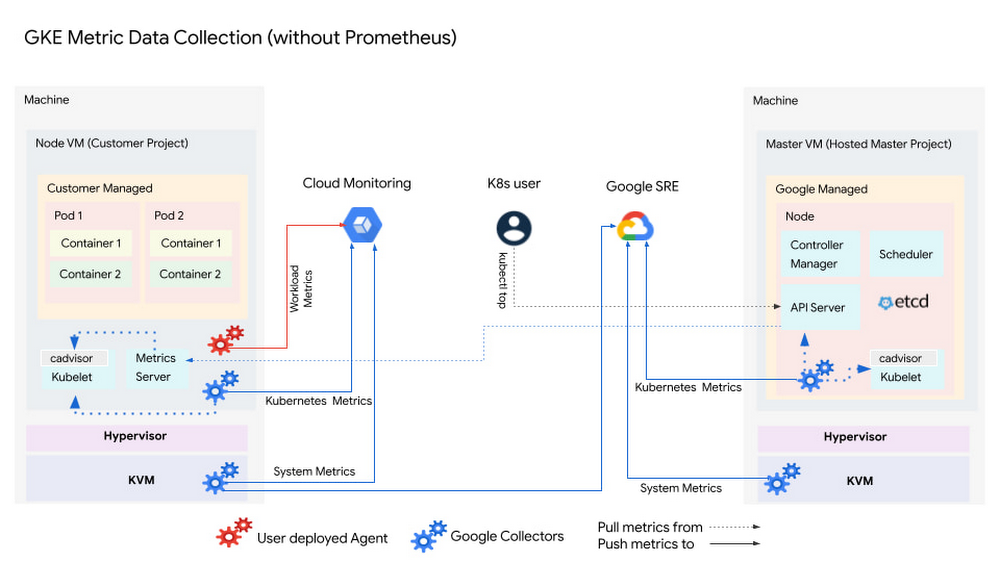

For the GKE control plane, the nodes are Google managed and metrics from these nodes are not published to Cloud Monitoring. However, these metrics are collected automatically and used for scaling and resource management decisions by the Kubernetes scheduler. Again, for collecting these metrics, the user does not need to deploy any agent software. These Google collectors are deployed and managed by Google when the clusters are created.
Lastly, your developers can collect Prometheus-compatible metrics emitted from workloads, such as CronJobs or Deployments, on GKE clusters using a fully managed, configurable pipeline from Cloud Monitoring. Your developers configure which metrics to collect, and GKE does everything else.
3. Collecting metrics from GKE (with Prometheus):
Prometheus is a popular choice for monitoring Kubernetes environments. Customers deploying their applications in GKE can continue to use Prometheus for monitoring. Metrics generated by services using the Prometheus exposition format can be exported from the cluster and made visible in Cloud Monitoring.
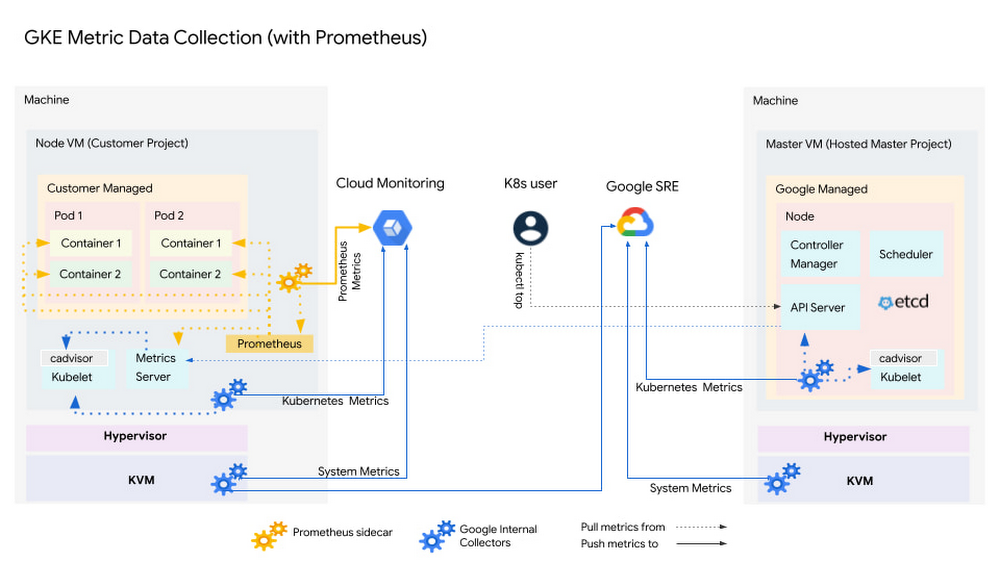

Collecting metrics from the control plane nodes in this use case is quite similar to the non-Prometheus use case. However, metric collection from the worker nodes is different. Prometheus is deployed on one of the Kubernetes worker nodes (Figure 3) and scrapes metrics from the pods and through the Kubelet API. An adapter collects the metrics from Prometheus and uploads them to Cloud Monitoring.
Chargeable and nonchargeable metrics
Operations teams are always concerned about IT costs and need general clarity on what is chargeable and what is not chargeable in their monitoring, logging, diagnostics, and troubleshooting tools. Visit the Google Cloud’s operations suite pricing page for definitive and current guidance on what is chargeable and what is non chargeable, setting consumption alert thresholds and more. Of the four broad categories of metrics mentioned above, system metrics are non-chargeable. All other categories of metrics are chargeable. There are two exceptions to the above general statement. While Agent collected metrics are chargeable, metrics about the agent itself (in the agent.googleapis.com/agent namespace) are not chargeable. Similarly, while logs-based metrics are chargeable, system-defined logs-based metrics are not chargeable.
Always refer to the pricing page for more details and latest updates.
Summary
Observability of cloud-based services and workloads requires an understanding of a diverse set of metrics that need to be collected and analyzed. These metrics are categorized into system metrics, agent metrics, user defined metrics, and logs-based metrics. This blog discussed metric types, the general architectures used for collecting these metrics and a brief summary on which of these metrics are chargeable metrics and which metrics are non chargeable metrics when using Google Cloud Monitoring.
If you have questions or feedback, please share it in the operations suite section of the Google Cloud Community.
