Better Kubernetes application monitoring with GKE workload metrics
Nathan Beach
Group Product Manager, Google Kubernetes Engine
Try Google Cloud
Start building on Google Cloud with $300 in free credits and 20+ always free products.
Free trialEditor’s note (12/15/21): The date that we will begin charging for GKE workload metrics has been rescheduled from December 1, 2021 to February 1, 2022. Please see this page for more information.
The newly released 2021 Accelerate State of DevOps Report found that teams who excel at modern operational practices are 1.4 times more likely to report greater software delivery and operational performance and 1.8 times more likely to report better business outcomes. A foundational element of modern operational practices is having monitoring tooling in place to track, analyze, and alert on important metrics. Today, we’re announcing a new capability that makes it easier than ever to monitor your Google Kubernetes Engine (GKE) deployments: GKE workload metrics.
Introducing GKE workload metrics, currently in preview
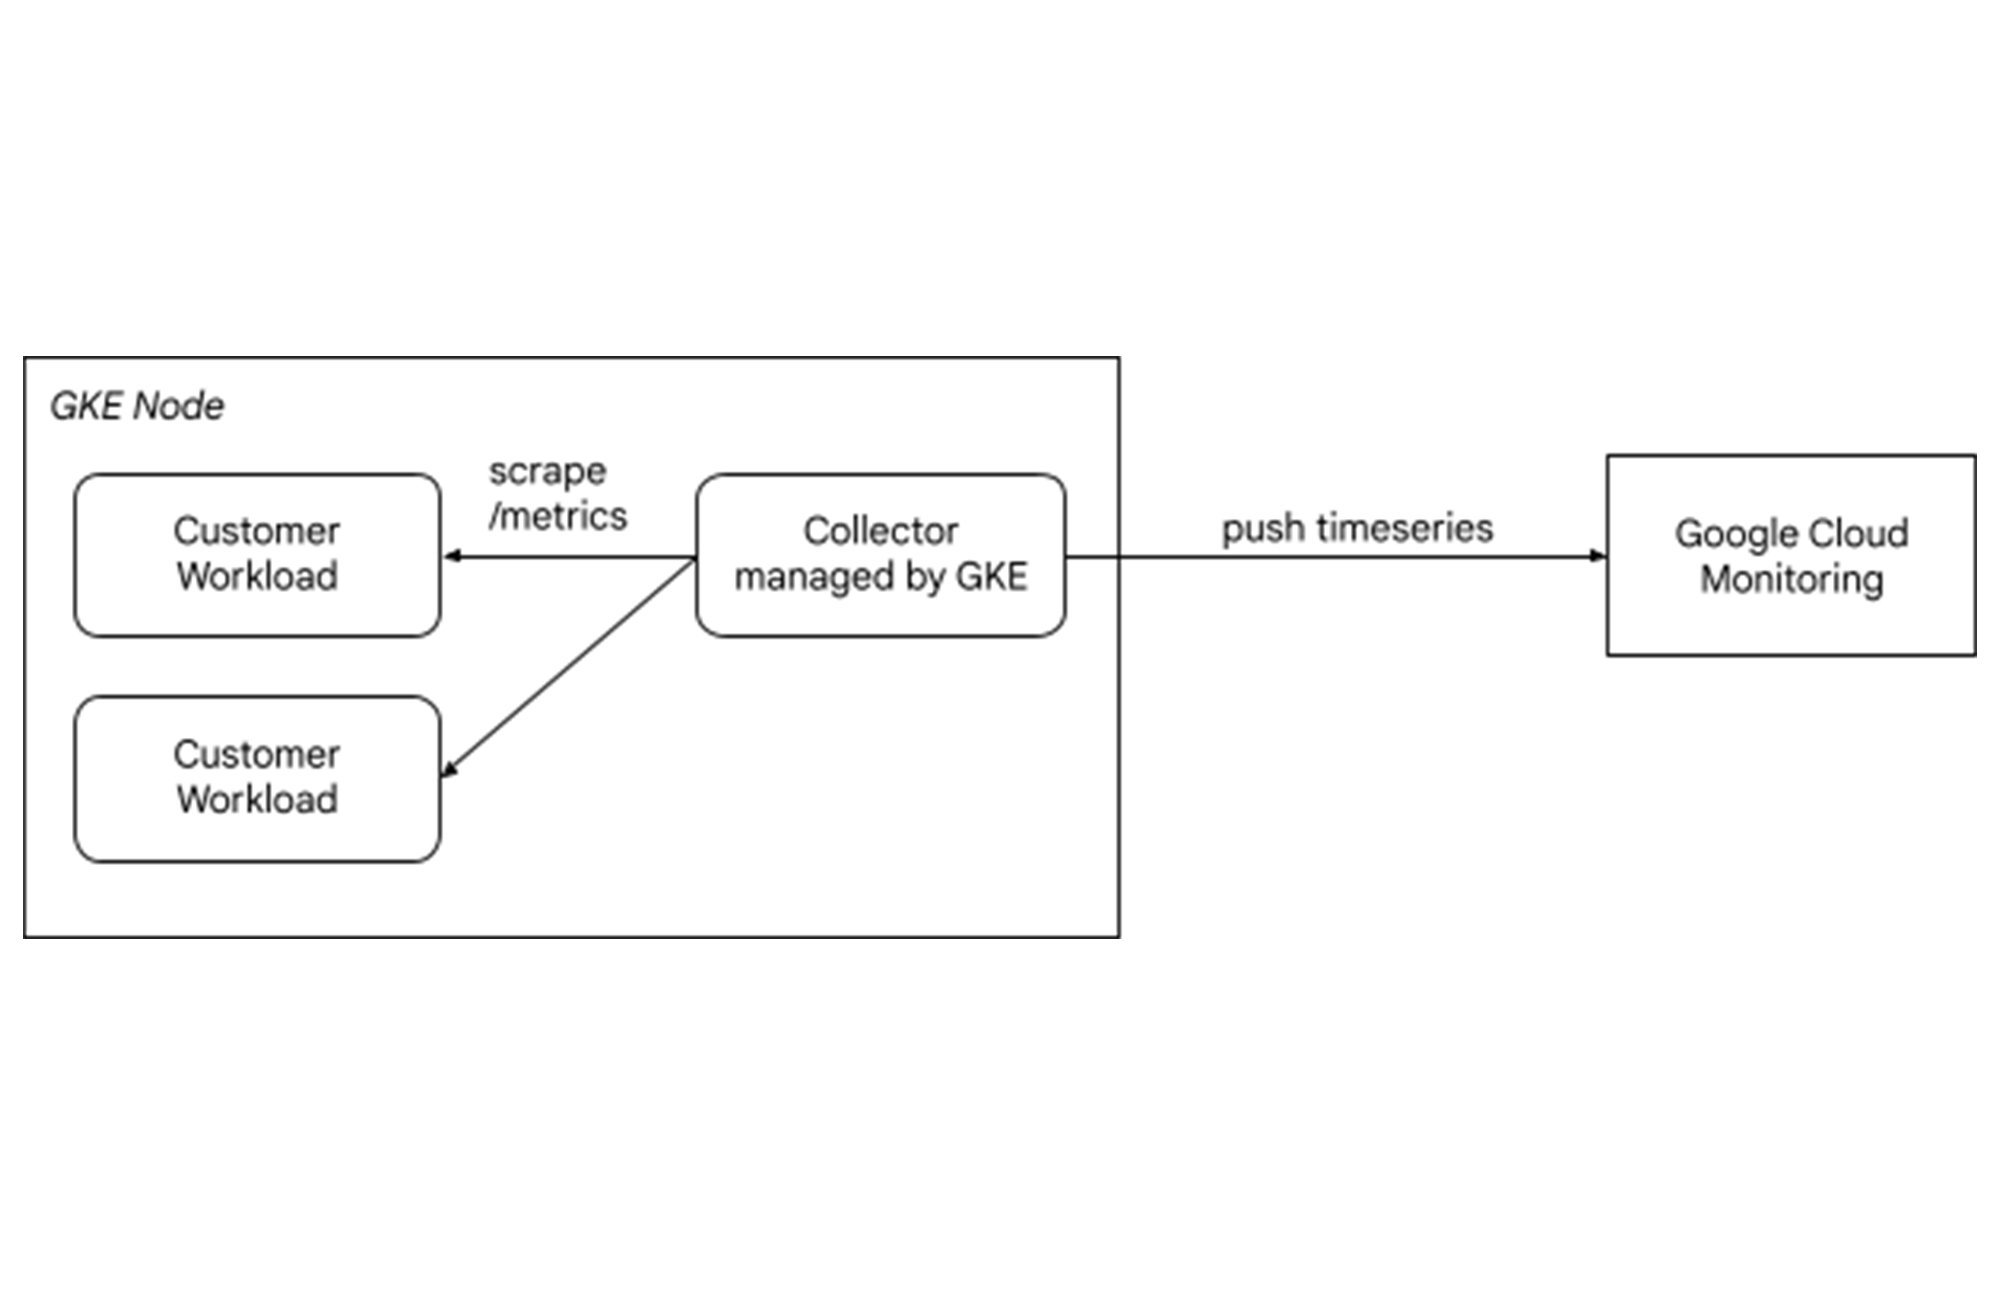
For applications running on GKE, we're excited to introduce the preview of GKE workload metrics. This fully managed and highly configurable pipeline collects Prometheus-compatible metrics emitted by workloads running on GKE and sends them to Cloud Monitoring. GKE workload metrics simplifies the collection of metrics exposed by any GKE workload, such as a CronJob or a Deployment, so you don’t need to dedicate any time to the management of your metrics collection pipeline. Simply configure which metrics to collect, and GKE does everything else.


Benefits of GKE workload metrics include:
Easy setup: With a single
kubectl applycommand to deploy a PodMonitor custom resource, you can start collecting metrics. No manual installation of an agent is required.Highly configurable: Adjust scrape endpoints, frequency and other parameters.
Fully managed: Google maintains the pipeline, lowering total cost of ownership.
Control costs: Easily manage Cloud Monitoring costs through flexible metric filtering.
Open standard: Configure workload metrics using the PodMonitor custom resource, which is modeled after the Prometheus Operator’s PodMonitor resource.
HPA support: Compatible with the Stackdriver Custom Metrics Adapter to enable horizontal scaling on custom metrics.
Better pricing: More intuitive, predictable, and lower pricing.
Autopilot support: GKE workload metrics is available for both GKE Standard and GKE Autopilot clusters.
Customers are already seeing the benefits of this simplified model.
"With GKE workload metrics, we no longer need to deploy and manage a separate Prometheus server to scrape our custom metrics - it's all managed by Google. We can now focus on leveraging the value of our custom metrics without hassle!" - Carlos Alexandre, Cloud Architect, NOS SGPS S.A., a Portuguese telecommunications and media company.
How to get started
Follow these instructions to enable the GKE workload metrics pipeline in your GKE cluster:
GKE workload metrics is currently available in Preview, so be sure to use the gcloud beta command.
See the GKE workload metrics guide for details about how to configure which metrics are collected as well as a guide for migrating to GKE workload metrics from the Stackdriver Prometheus sidecar.
Pricing
Ingestion of GKE workload metrics into Cloud Monitoring is not currently charged, but it will be charged starting February 1, 2022 (see Editor’s note above. Previous version of the blog noted December 1, 2021 as the start date). See more about Cloud Monitoring pricing.
Cloud Monitoring for modern operations
Once GKE workload metrics are ingested into Cloud Monitoring, you can start using all of the great features of the service including global scalability, long-term (24 month) storage options, integration with Cloud Logging, custom dashboards, alerting, and SLO monitoring. These same benefits already exist for GKE system metrics, which are non-chargeable and are collected by default from GKE clusters and made available to you in the GKE Dashboard.
If you have any questions or want to provide feedback, please visit the operations suite page on the Google Cloud Community.


