Troubleshoot GKE apps faster with monitoring data in Cloud Logging
Charles Baer
Product Manager, Google Cloud
Try Google Cloud
Start building on Google Cloud with $300 in free credits and 20+ always free products.
Free trialWhen you’re troubleshooting an application on Google Kubernetes Engine (GKE), the more context that you have on the issue, the faster you can resolve it. For example, did the pod exceed it’s memory allocation? Was there a permissions error reserving the storage volume? Did a rogue regex in the app pin the CPU? All of these questions require developers and operators to build a lot of troubleshooting context.
Cloud Monitoring data for GKE in Cloud Logging
To make it easier to troubleshoot GKE apps, we’ve added contextual Cloud Monitoring data accessible right from Cloud Logging. With this new feature, you can easily see the relevant pod, node and cluster events, metrics, alerts, and SLOs right from the log line itself. Additionally, the data loaded for a specific log entry is scoped to the Kubernetes resource, which saves you valuable time while investigating an app error.
Today’s announcement builds on other recent integrations including the addition of a logs tab nested in the details page of each of your GKE resources and combining metrics and logs in the GKE Dashboard in Monitoring. Now, wherever you start your troubleshooting journey – in Monitoring, Logging or GKE – you have the observability data at your fingertips.
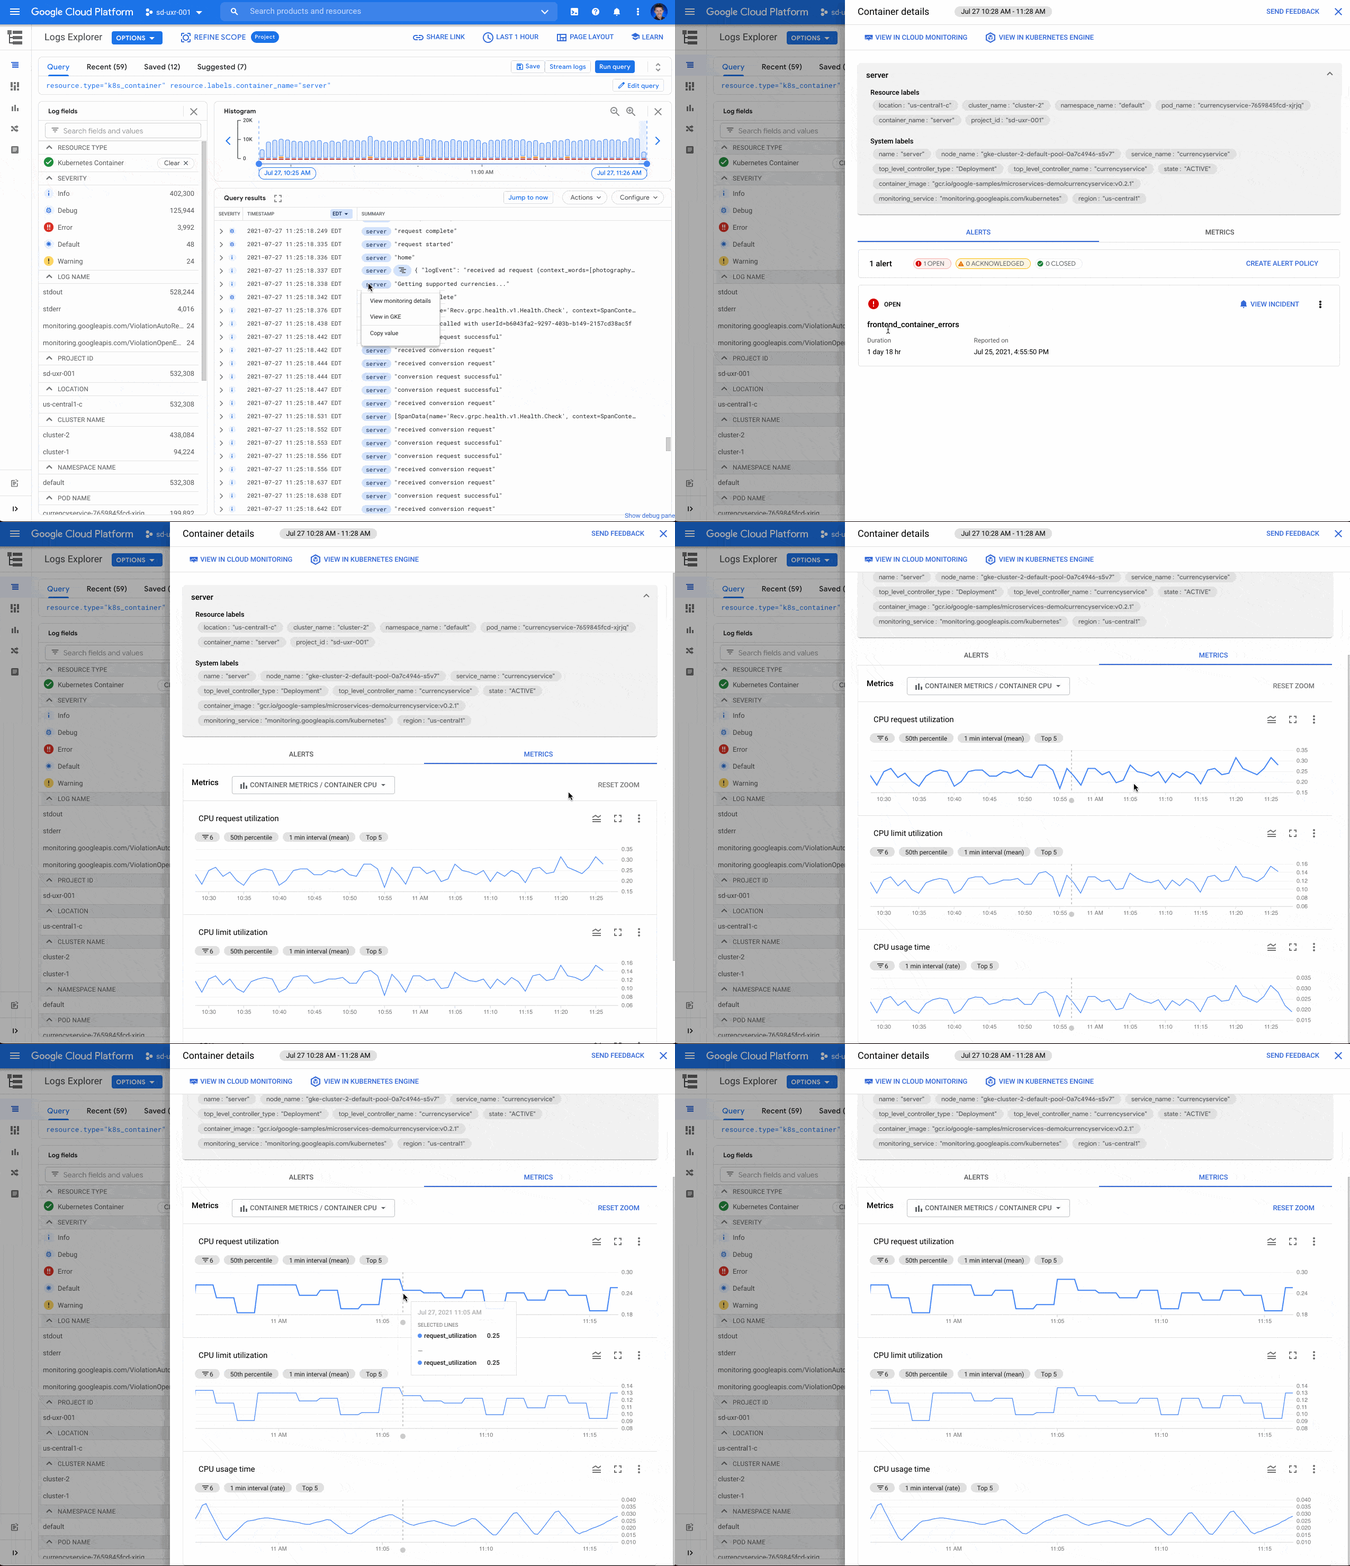
For example, if you’re troubleshooting a GKE app error in Cloud Logging and looking at the app logs, you can now view the metric charts for container restarts, uptime, memory, CPU and storage without leaving the log entry. Active alerts are highlighted on the alerts tab, which can provide helpful context for troubleshooting. This unique and integrated experience brings together critical log and metric data for the specific Kubernetes resource where your app is running.

Viewing Monitoring data for GKE from a log line
From a k8s_container, k8s_pod, k8s_node, or k8s_cluster log, select the blue chip with the resource.labels resource name and then select “View Monitoring details” to access an integrated metrics panel directly from the Logs Explorer. Selecting “View in GKE” opens the detailed view of the GKE resource in the Cloud Console on a new tab.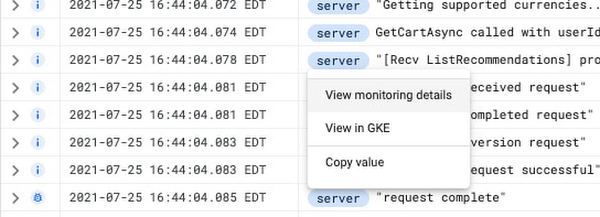

The metrics panel provides a lot of contextual data including alerts, Kubernetes events and metrics related to the GKE resource.
Alerts
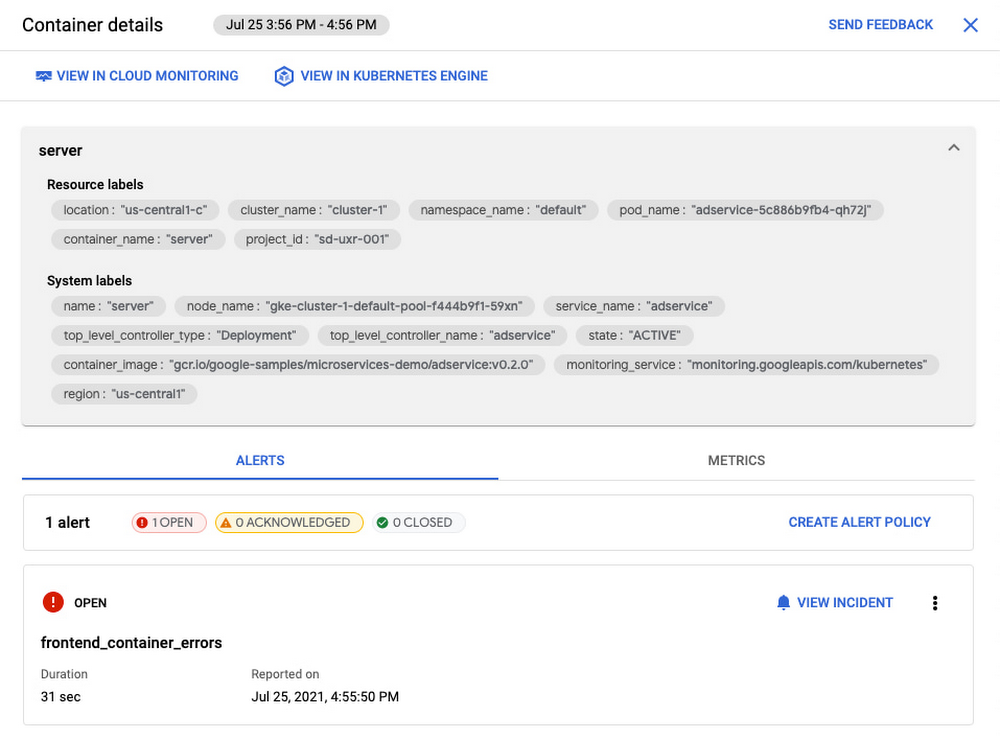
Alerts triggered by the GKE resource are displayed under the alerts tab. The color-coded alert status provides an easy way to see ongoing, acknowledged and closed incidents. Selecting “VIEW INCIDENT” opens the incident details in Cloud Monitoring. If you want to create a new alert, use the link to create a brand new alert policy.

Kubernetes events for clusters and pods
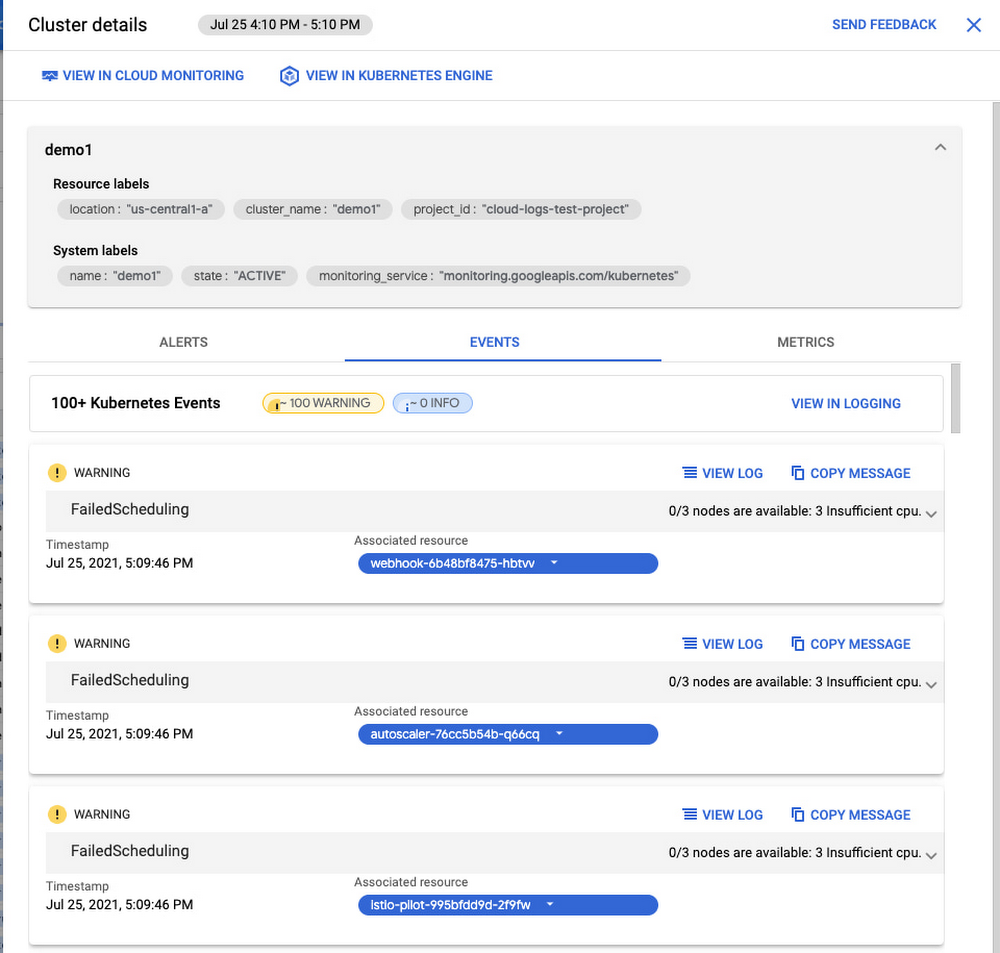
The metrics panel provides select events for clusters and pods. For each event, the name, associated resource and a link to view/copy the log message are displayed. Kubernetes events can provide important information to help determine the root cause of an issue. For example, if a FailedScheduling event is displayed, this can quickly guide troubleshooting to check the resources available to the Kubernetes resource.

Metrics for containers, pods and nodes
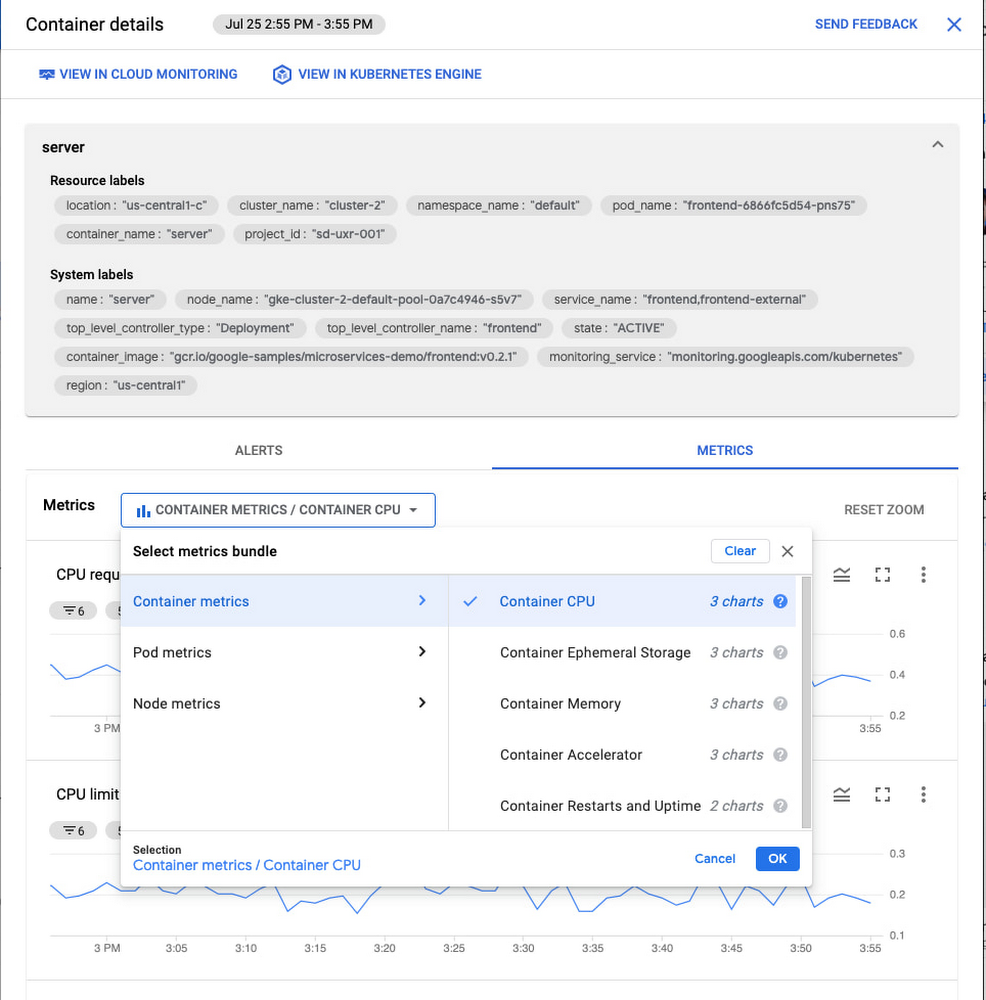
The metrics tab contains metrics bundles for container (default), pod and node metrics collected from the GKE cluster and reported in Cloud Monitoring. Each metric bundle offers pre-built charts that can be selected to view the CPU, memory, storage and container restarts. For example, by looking at the CPU or memory, you can determine whether there were any spikes in the metrics for the Kubernetes resources.

More to come
We’re committed to making Google Cloud’s operations suite the best place to troubleshoot your GKE apps. We’ve integrated logs directly into GKE resource details pages and built a specialized integrated GKE Dashboard, all to make it easier to troubleshoot GKE apps. However, there is still more coming and we’re already working hard to add new features to the metrics panels to surface even more context for troubleshooting GKE apps.
Get started today
If you haven’t already, to get started with Cloud Logging and Cloud Monitoring on GKE, view documentation, watch a quick video on troubleshooting services on GKE and join the discussion in our new Cloud Operations page on the Google Cloud Community site.
