GKE operations magic: From an alert to resolution in 5 steps
Rakesh Dhoopar
Director, Outbound Product Management
John Day
Product Marketing Manager, Google Cloud
As applications move from monolithic architectures to microservices-based architectures, DevOps and Site Reliability Engineering (SRE) teams face new operational challenges. Microservices are updated constantly with new features and resource managers/schedulers (like Kubernetes and GKE) can add/remove containers in response to changing workloads. The old way of creating alerts based on learned behaviors of your monolithic applications will not work with microservices applications.
Therefore teams operating microservices increasingly rely on metrics, logs, and traces to identify and troubleshoot problems. In addition, you need rich context (metadata and relationships between entities) to be more efficient in diagnosing issues. Visualizing this variety of information in one place can make you more productive and cut down the mean-time-to-restore (MTTR) service so you can focus on what you enjoy the most - working on new business functionality!
The GKE Dashboard automatically presents observability data and rich associated context in an easy-to-use, easy-to-comprehend and easy-to-navigate manner. Today we’re going to walk through how you can use the dashboard to go from an alert to resolution in five easy steps.
First it is important to understand how data is organized in this dashboard and how it leverages powerful filtering capabilities to make you efficient, even when you are working with many clusters and with large numbers of Kubernetes objects.
Understanding the GKE Dashboard
The power of the GKE Dashboard comes from three key capabilities:
- All relevant data in one place: All metrics and logs, plus their related metadata (labels), as well as alerts, incidents, Kubernetes events, and SLOs for all GKE entities in one dashboard.
- Powerful filtering and aggregation: Behind the scenes this dashboard maintains a context-graph that manages all of the infrastructure relationships between the GKE objects. These relationships keep an account of containers in a pod, pods in a deployment, deployments in a namespace, nodes associated with a cluster and many such associations. This context-graph powers the filtering mechanism for this dashboard and lets you quickly narrow down data that may be of interest. The aggregation engine also relies on these relationships to compute metrics for composite objects. For example, if a service is running 10 pods, the aggregation engine computes the overall resource utilization for a service.
- Navigation to data explorers: While you can accomplish lots of troubleshooting right here on this dashboard, if required, you can easily and contextually navigate from this dashboard to log explorer, metrics explorer and SLO monitoring details for deeper analysis.
Step 1: Review active alerts associated with Kubernetes entities
When you launch this dashboard, the first thing you see is an alert summary and an alert timeline. Hovering over this timeline pops up an event card that provides more details about each alert including when it happened, the policy that triggered the alert, the resource on which this alert was triggered, and whether there is an incident open for this alert.
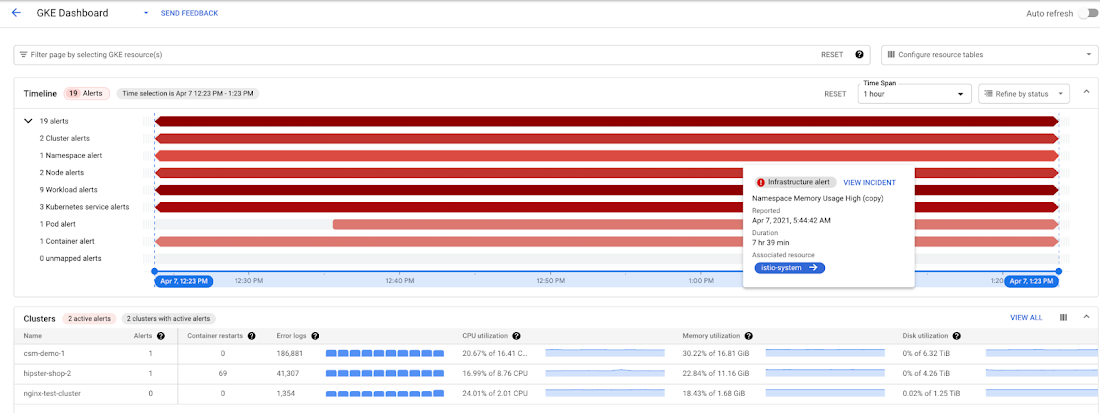

Alerts summary with details pop out displayed when hovering over the timeline
Step 2: Get high-level details for each Kubernetes entity sorted by health
A summary of metric and log data for each Kubernetes object is presented in this group of tables. Within each category, the objects are prioritized based on their health. Objects with a higher number of incidents are listed at the top. Next to the alert counts, you can see the following summaries:
- Container restarts
- SLO status
- Count of Error logs over time
- Key resource utilization metrics (CPU, Memory, Disk)


View of Namespaces table with resources sorted by priority
While only 5 objects are shown in each table, you can view all other objects by clicking on “View All.”
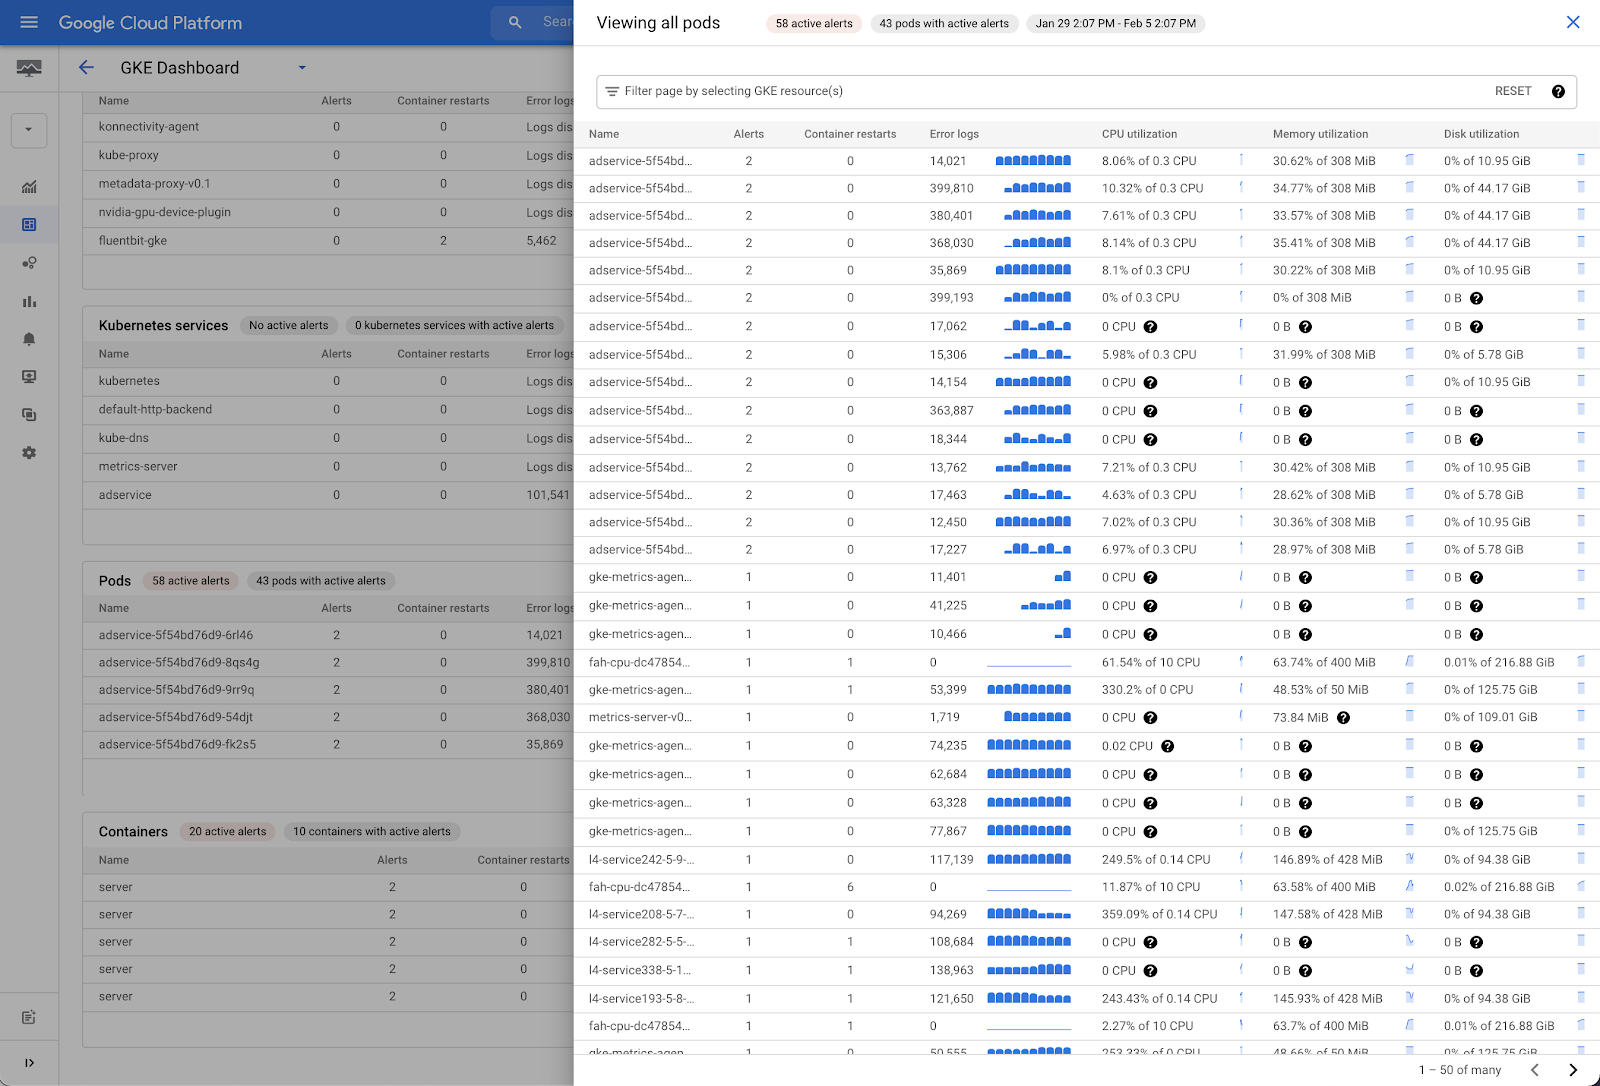

Example of the “View All” side panel available in the GKE Dashboard
Once you decide which alert to work on, you can filter all of the data in the dashboard to just the resource associated with the alert. Note, this filtering is not simply a string-match filtering, it utilizes the context-graph. Therefore, when you filter the dashboard using a specific resource, all other objects that are related to this resource are filtered accordingly.
Step 3: Identify relevant Kubernetes events
Once you have filtered the required resources, simply click on the name of the resource and you can see the relevant Kubernetes events extracted from logs to help narrow down the possible causes that can explain the unhealthy characterics of the GKE entity.
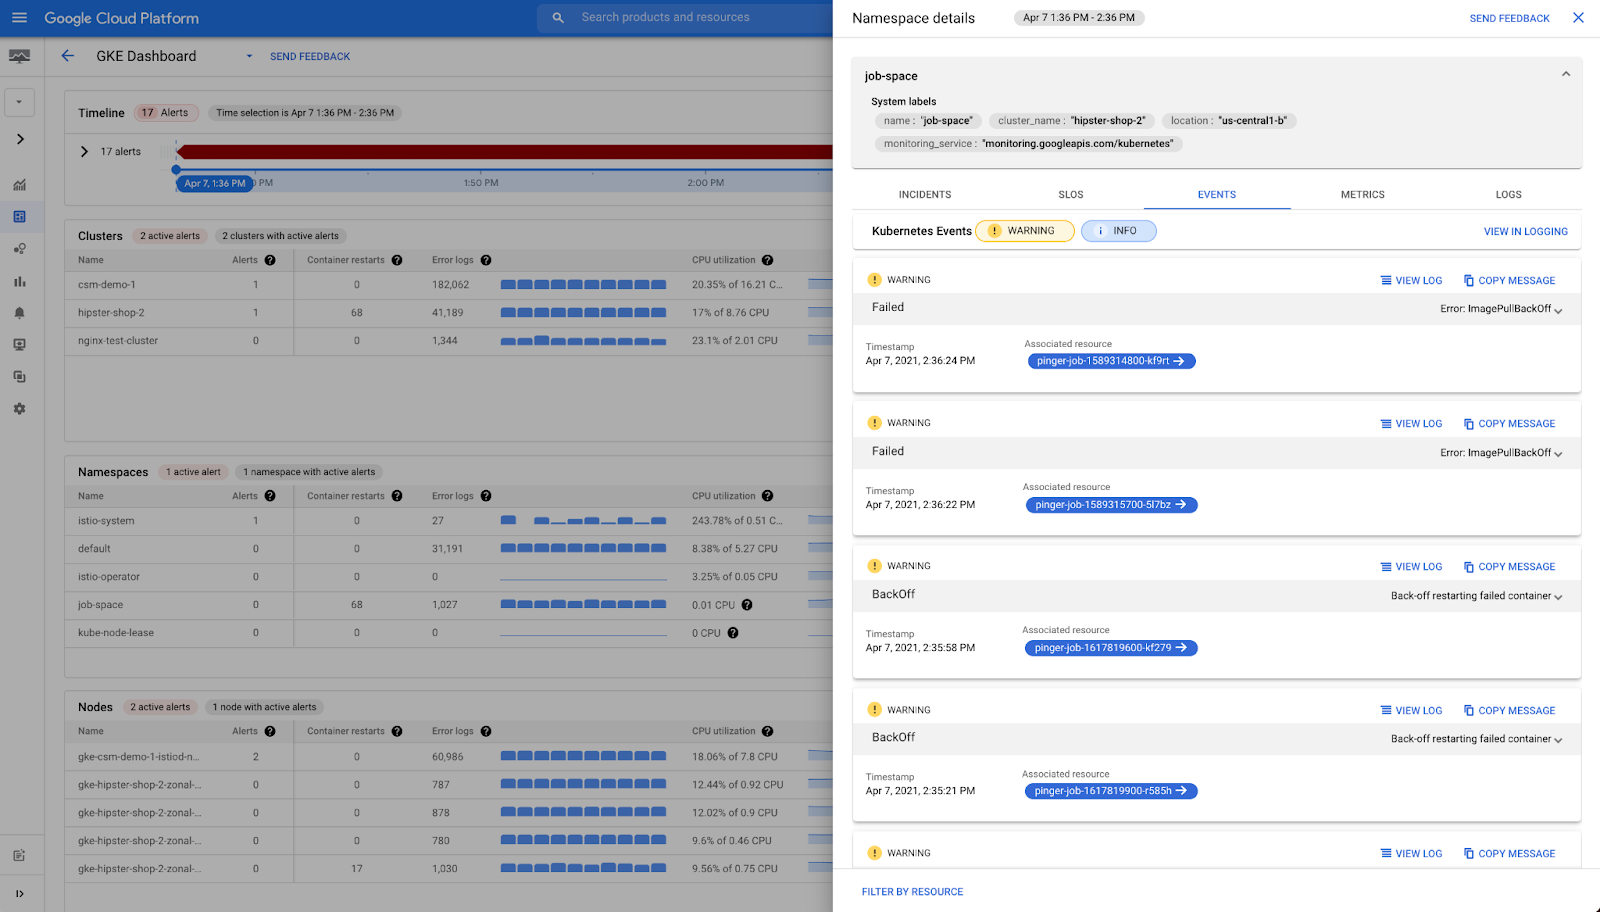

A view of the Namespace details in the side panel
Step 4: Drill down into the metrics of the affected Kubernetes entity
In the Metrics tab you can view the 44 Kubernetes metrics available out-of-the-box in the slide-out panel. For deeper metric exploration, you can easily navigate (in-context) to the Metrics Explorer.
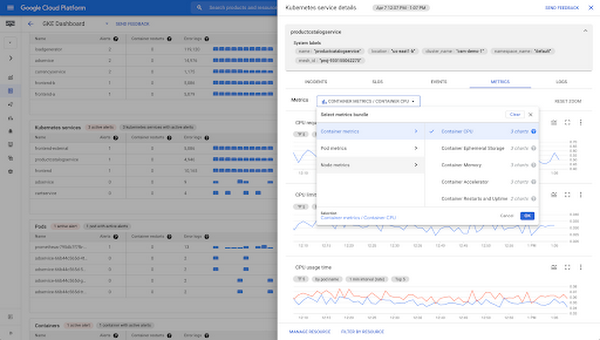

Detailed slide out panel available in the GKE Dashboard
Step 5: Investigate filtered logs of the Kubernetes entity
If you want to see logs for a specific object, simply click on the Logs tab and view the logs. This tab also provides in-place exploration of log data. Filter logs by severity or type search expressions in the Filter bar to narrow down relevant logs for this resource.
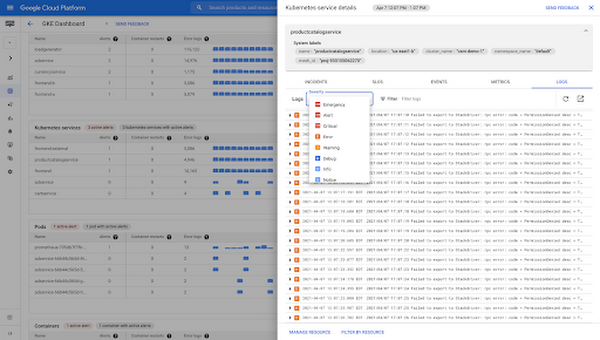

The Logs tab of the service detail slide out panel
In conclusion
The five steps above provide a framework for how you can use the GKE Dashboard to troubleshoot problems that may arise with your applications running on GKE. The out-of-the-box dashboard provides developers, DevOps and SRE teams aggregated observability data and context into one place. It offers the ability to filter, visualize and search that information without having to navigate to different tools. This helps you reduce MTTR so you can focus on coding and building new functional capabilities.
To get started, navigate directly to the GKE Dashboard in Cloud Monitoring or visit the documentation page for more information
