This tutorial shows how to write, deploy, and call a Cloud Run service that reports custom OTLP metrics to Google Cloud Managed Service For Prometheus by using the Google-Built OpenTelemetry Collector as a sidecar. For information about the Google-built Collector, see Overview of the Google-Built OpenTelemetry Collector.
If you have a Cloud Run service that reports Prometheus metrics, then use the Prometheus sidecar for Cloud Run instead.
Objectives
- Write, build, and deploy a service to Cloud Run with the Google-Built OpenTelemetry Collector as a sidecar.
- Generate custom metrics and report them to Google Cloud Managed Service For Prometheus.
Costs
In this document, you use the following billable components of Google Cloud:
To generate a cost estimate based on your projected usage,
use the pricing calculator.
Before you begin
- Sign in to your Google Cloud account. If you're new to Google Cloud, create an account to evaluate how our products perform in real-world scenarios. New customers also get $300 in free credits to run, test, and deploy workloads.
-
In the Google Cloud console, on the project selector page, select or create a Google Cloud project.
Roles required to select or create a project
- Select a project: Selecting a project doesn't require a specific IAM role—you can select any project that you've been granted a role on.
-
Create a project: To create a project, you need the Project Creator role
(
roles/resourcemanager.projectCreator), which contains theresourcemanager.projects.createpermission. Learn how to grant roles.
-
Verify that billing is enabled for your Google Cloud project.
-
Enable the Cloud Run, Cloud Monitoring, Artifact Registry, and Cloud Build APIs.
Roles required to enable APIs
To enable APIs, you need the Service Usage Admin IAM role (
roles/serviceusage.serviceUsageAdmin), which contains theserviceusage.services.enablepermission. Learn how to grant roles. - Install and initialize the gcloud CLI.
- Update Google Cloud CLI:
gcloud components update
Required roles
To get the permissions that you need to complete the tutorial, ask your administrator to grant you the following IAM roles on your project:
-
Cloud Build Editor (
roles/cloudbuild.builds.editor) -
Cloud Run Admin (
roles/run.admin) -
Create Service Accounts (
roles/iam.serviceAccountCreator) -
Project IAM Admin (
roles/resourcemanager.projectIamAdmin) -
Monitoring Metric Writer (
roles/monitoring.metricWriter) -
Service Account User (
roles/iam.serviceAccountUser) -
Service Usage Consumer (
roles/serviceusage.serviceUsageConsumer) -
Storage Admin (
roles/storage.admin)
For more information about granting roles, see Manage access to projects, folders, and organizations.
You might also be able to get the required permissions through custom roles or other predefined roles.
Also note that the Cloud Run service identity needs the
Monitoring Metric Writer (roles/monitoring.metricWriter) role. The
Compute Engine default service account
might have this role by default, but you might need to add it if you have changed
its permissions or are using a different service account.
Setting up gcloud defaults
To configure gcloud with defaults for your Cloud Run service:
Set your default project:
gcloud config set project PROJECT_ID
Replace PROJECT_ID with the name of the project you created for this tutorial.
Configure gcloud for your chosen region:
gcloud config set run/region REGION
Replace REGION with the supported Cloud Run region of your choice.
Cloud Run locations
Cloud Run is regional, which means the infrastructure that
runs your Cloud Run services is located in a specific region and is
managed by Google to be redundantly available across
all the zones within that region.
Meeting your latency, availability, or durability requirements are primary
factors for selecting the region where your Cloud Run services are run.
You can generally select the region nearest to your users but you should consider
the location of the other Google Cloud
products that are used by your Cloud Run service.
Using Google Cloud products together across multiple locations can affect
your service's latency as well as cost.
Cloud Run is available in the following regions:
Subject to Tier 1 pricing
asia-east1(Taiwan)asia-northeast1(Tokyo)asia-northeast2(Osaka)asia-south1(Mumbai, India)europe-north1(Finland) Low CO2
europe-north2(Stockholm) Low CO2
europe-southwest1(Madrid) Low CO2
europe-west1(Belgium) Low CO2
europe-west4(Netherlands) Low CO2
europe-west8(Milan)europe-west9(Paris) Low CO2
me-west1(Tel Aviv)northamerica-south1(Mexico)us-central1(Iowa) Low CO2
us-east1(South Carolina)us-east4(Northern Virginia)us-east5(Columbus)us-south1(Dallas) Low CO2
us-west1(Oregon) Low CO2
Subject to Tier 2 pricing
africa-south1(Johannesburg)asia-east2(Hong Kong)asia-northeast3(Seoul, South Korea)asia-southeast1(Singapore)asia-southeast2(Jakarta)asia-south2(Delhi, India)australia-southeast1(Sydney)australia-southeast2(Melbourne)europe-central2(Warsaw, Poland)europe-west10(Berlin)europe-west12(Turin)europe-west2(London, UK) Low CO2
europe-west3(Frankfurt, Germany)europe-west6(Zurich, Switzerland) Low CO2
me-central1(Doha)me-central2(Dammam)northamerica-northeast1(Montreal) Low CO2
northamerica-northeast2(Toronto) Low CO2
southamerica-east1(Sao Paulo, Brazil) Low CO2
southamerica-west1(Santiago, Chile) Low CO2
us-west2(Los Angeles)us-west3(Salt Lake City)us-west4(Las Vegas)
If you already created a Cloud Run service, you can view the region in the Cloud Run dashboard in the Google Cloud console.
Creating a Artifact Registry image repository
Create an Artifact Registry Docker repository to host the sample service image:
gcloud artifacts repositories create run-otel \
    --repository-format=docker \
    --location=REGION \
    --project=PROJECT_ID
Replace the following:
- PROJECT_ID with the name of the project you created for this tutorial.
- REGION REGION with the supported Cloud Run region of your choice.
Retrieving the code sample
To retrieve the code sample for use:
Clone the sample app repository to your local machine:
Go
git clone https://github.com/GoogleCloudPlatform/golang-samples.git
Alternatively, you can download the sample as a zip file and extract it.
Change to the directory that contains the Cloud Run sample code:
Go
cd golang-samples/run/custom-metrics/
Reviewing the code
The code for this tutorial consists of the following:
- A server that handles incoming requests and generates a metric named
sidecar_sample_counter_total.
- A
Dockerfilethat defines the operating environment for the service.
The sample also includes files under the collector subdirectory for building a custom collector:
A config file for the collector.
A
Dockerfilethat bundles the provided config into an upstream Collector image.
Shipping the code
Shipping code consists of three steps: building a container image with Cloud Build, uploading the container image to Artifact Registry, and deploying the container image to Cloud Run.
To ship your code:
-
Build your sample service container and publish on Artifact Registry:
gcloud builds submit --tag REGION-docker.pkg.dev/PROJECT_ID/run-otel/sample-metrics-app
Upon success, you should see a SUCCESS message containing the ID, creation time, and image name. The image is stored in Artifact Registry and can be re-used if desired.
-
Build your Collector container and publish on Artifact Registry:
gcloud builds submit collector --tag REGION-docker.pkg.dev/PROJECT_ID/run-otel/otel-collector-metrics
Upon success, you should see a SUCCESS message containing the ID, creation time, and image name. The image is stored in Artifact Registry and can be re-used if desired.
-
Deploy your application:
YAML
-
Create a new file called
service.yamlwith the following:apiVersion: serving.knative.dev/v1 kind: Service metadata: name: SERVICE-NAME annotations: run.googleapis.com/launch-stage: BETA spec: template: metadata: annotations: run.googleapis.com/container-dependencies: "{app:[collector]}" spec: containers: - image: REGION-docker.pkg.dev/PROJECT_ID/run-otel/sample-metrics-app name: app ports: - containerPort: CONTAINER_PORT env: - name: "OTEL_EXPORTER_OTLP_ENDPOINT" value: "http://localhost:4317" - image: REGION-docker.pkg.dev/PROJECT_ID/run-otel/otel-collector-metrics name: collector startupProbe: httpGet: path: / port: 13133 -
Replace the following:
- CONTAINER_PORT with the port your service's ingress container listens on. By default, this is
8080. - SERVICE-NAME with any name for your service, such as
custom-metrics-sample-service.
- CONTAINER_PORT with the port your service's ingress container listens on. By default, this is
-
-
Create the new service with the following command:
gcloud run services replace service.yaml
This command returns a service URL. Use this URL to try out the sample application in Trying it out.
Trying it out
Using the URL from the gcloud run command in Shipping the code,
connect to the service to generate some sample metrics (you can run this
command several times to generate more interesting data):
curl -H \
"Authorization: Bearer $(gcloud auth print-identity-token)" \
SERVICE_URL
Replace SERVICE_URL with the URL of your service.
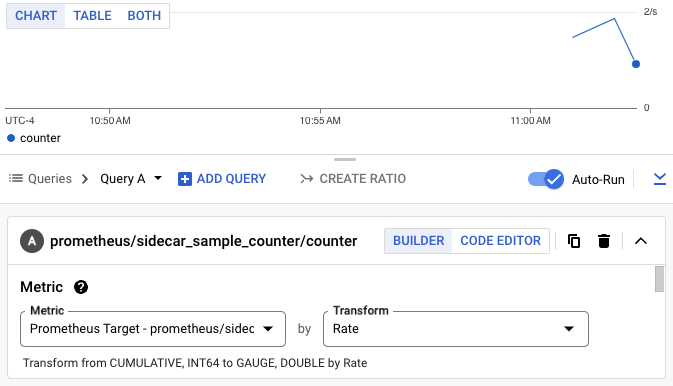
Next, navigate to the Metrics Explorer
within the Cloud Monitoring section of the Google Cloud console and select the
sidecar_sample_counter_total metric.
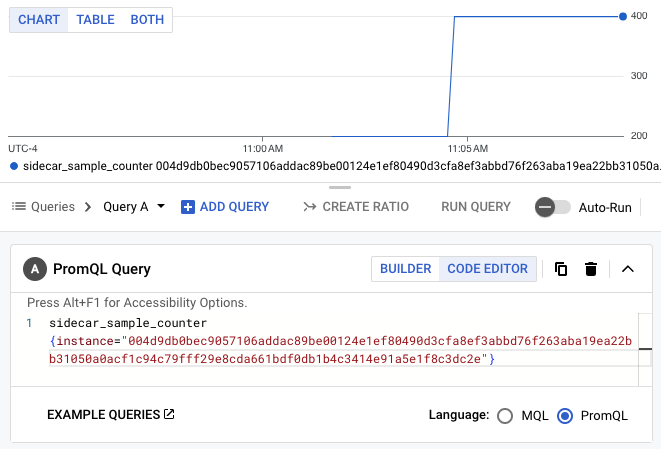
You can also query the metrics with PromQL. For example, the query below will filter metrics based on the Cloud Run instance ID:
sidecar_sample_counter_total{instance="INSTANCE_ID"}
Replace INSTANCE_ID with the ID of any instance for your service (available in the instance logs or from the metadata server).
This query produces a chart like the one below:
Clean up
To avoid additional charges to your Google Cloud account, delete all the resources you deployed with this tutorial.
Delete the project
If you created a new project for this tutorial, delete the project. If you used an existing project and need to keep it without the changes you added in this tutorial, delete resources that you created for the tutorial.
The easiest way to eliminate billing is to delete the project that you created for the tutorial.
To delete the project:
- In the Google Cloud console, go to the Manage resources page.
- In the project list, select the project that you want to delete, and then click Delete.
- In the dialog, type the project ID, and then click Shut down to delete the project.
Delete tutorial resources
Delete the Cloud Run service you deployed in this tutorial. Cloud Run services don't incur costs until they receive requests.
To delete your Cloud Run service, run the following command:
gcloud run services delete SERVICE-NAME
Replace SERVICE-NAME with the name of your service.
You can also delete Cloud Run services from the Google Cloud console.
Remove the
gclouddefault region configuration you added during tutorial setup:gcloud config unset run/regionRemove the project configuration:
gcloud config unset projectDelete other Google Cloud resources created in this tutorial:
What's next
More examples, including examples for traces and logs, are available on GitHub.