Top 10 reasons to get started with Log Analytics today
Charles Baer
Product Manager, Google Cloud
Afrina M
Product Manager, Google Cloud
Logging is a critical part of the software development lifecycle enabling developers to debug their apps, DevOps/SRE teams to troubleshoot issues, and security admins to analyze access patterns. Log Analytics is a new set of features in Cloud Logging available in Preview to help you perform powerful analysis on log data. In this post, we’ll cover 10 reasons why you should get started with Log Analytics today.
Check our introductory blog or join us for a live webinar on Nov 15, 2022 where we will walk attendees through Log Analytics use cases including a demo. Register here today.
#1: Log Analytics is included in Cloud Logging pricing
If you already use Cloud Logging, Log Analytics is included in the Cloud Logging pricing. There are no additional costs associated with upgrading the log bucket or running queries on the Log Analytics UI.
Our standard pricing is based on ingestion which includes storing logs in the log bucket for 30 days, our default period, or you can set a custom log retention period. Check out the pricing blog to learn how to maximize value with Cloud Logging.
If you don’t already use Cloud Logging, you can leverage the free tier of 50GiB/project/month to explore Cloud Logging including Log Analytics.
#2: Enable a managed logging pipeline with one-click
Log Analytics manages the log pipeline for you, eliminating the need to build and manage your own complex data pipelines, which can add cost and operational overhead. A simple one-click set-up allows you to upgrade an existing log bucket or create a new log bucket with Log Analytics. Data is available in real-time, allowing users to immediately access their data via either the Log Explorer or the Log Analytics page.
#3: Log data is available in Cloud Logging & BigQuery
Upgrading a log bucket to Log Analytics means that your logs can be accessed via the Log Analytics page in Cloud Logging. If you also want to access log data from BigQuery, you can enable the checkbox to expose a linked dataset in BigQuery that is linked to your Log Analytics bucket.
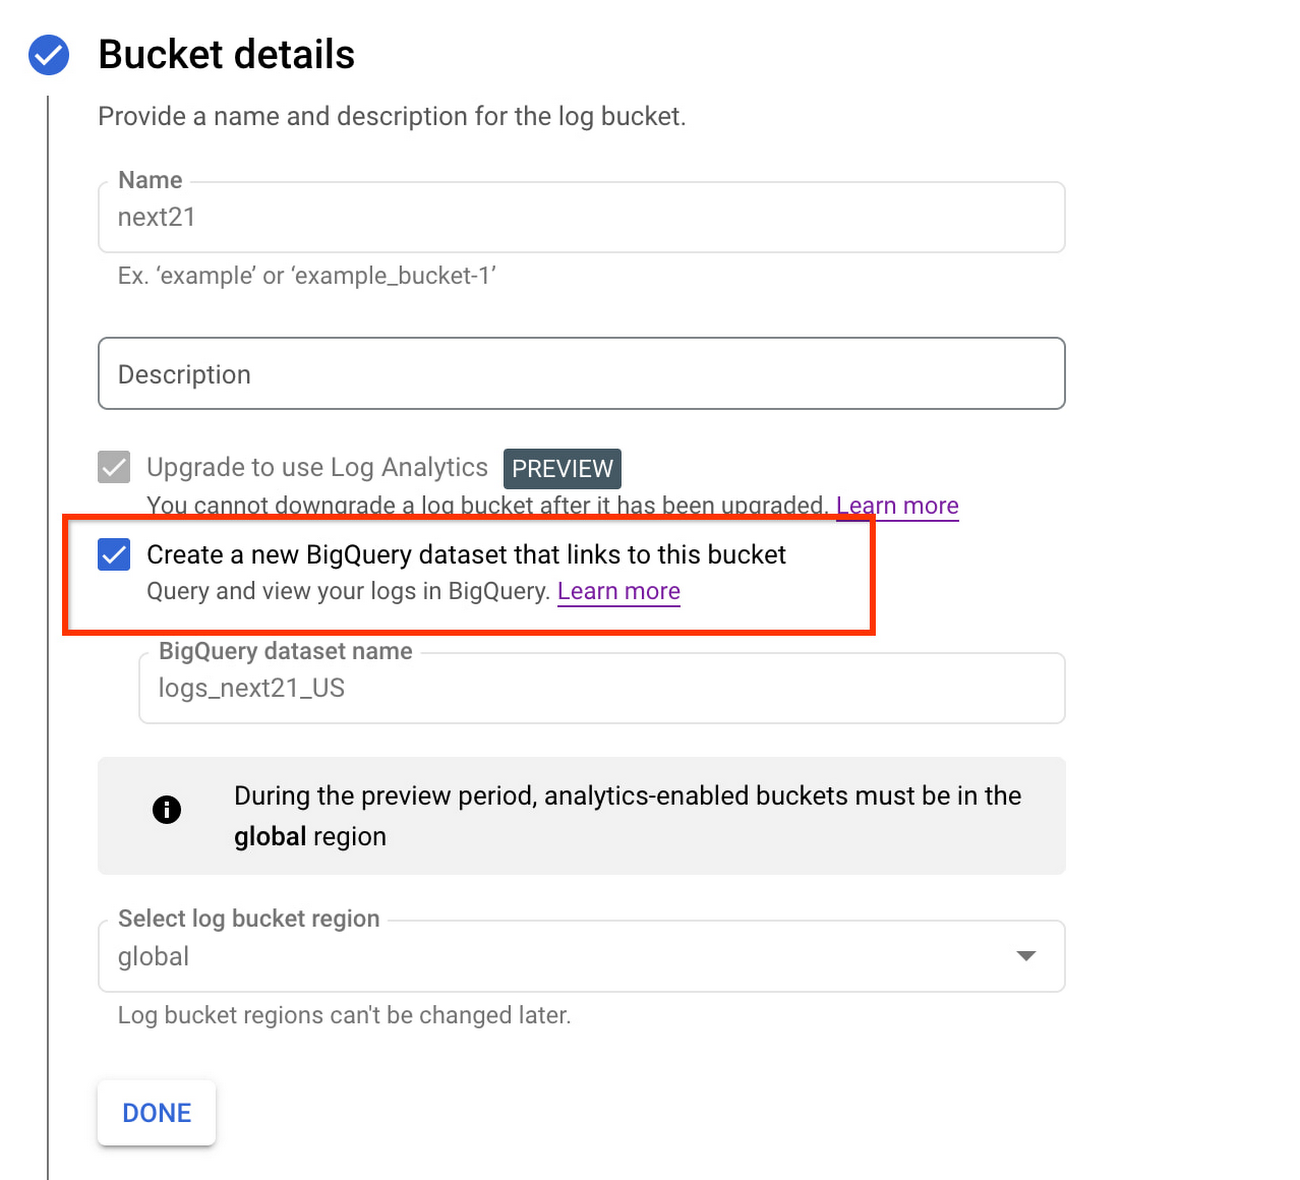

Once the log bucket is upgraded, log data can be accessed both from Log Analytics in Cloud Logging or BigQuery which eliminates the need to manage or build data pipelines to store log data in BigQuery. Cloud Logging will still manage the log data including access, immutability, and retention. Additionally, Cloud Logging uses BigQuery’s new native support for semi-structured data so you don’t need to manage the schema in your logs.
This can be useful when:
You already have other application or business data in BigQuery and want to join it with log data from Cloud Logging
You want to use Looker Studio or other tools in the BigQuery ecosystem.
There is no cost to create a linked dataset in BigQuery, but the standard BigQuery query cost applies to querying logs via the BigQuery APIs.
#4: Determine root cause faster on high cardinality logs
Application, infrastructure and networking logs can often have high cardinality data with unique IP addresses, session ids and instance ids. High cardinality data can be difficult to convert, store, and analyze as metrics.
For example, two common use cases are:
Application and infrastructure troubleshooting
Network troubleshooting
Application and infrastructure troubleshooting
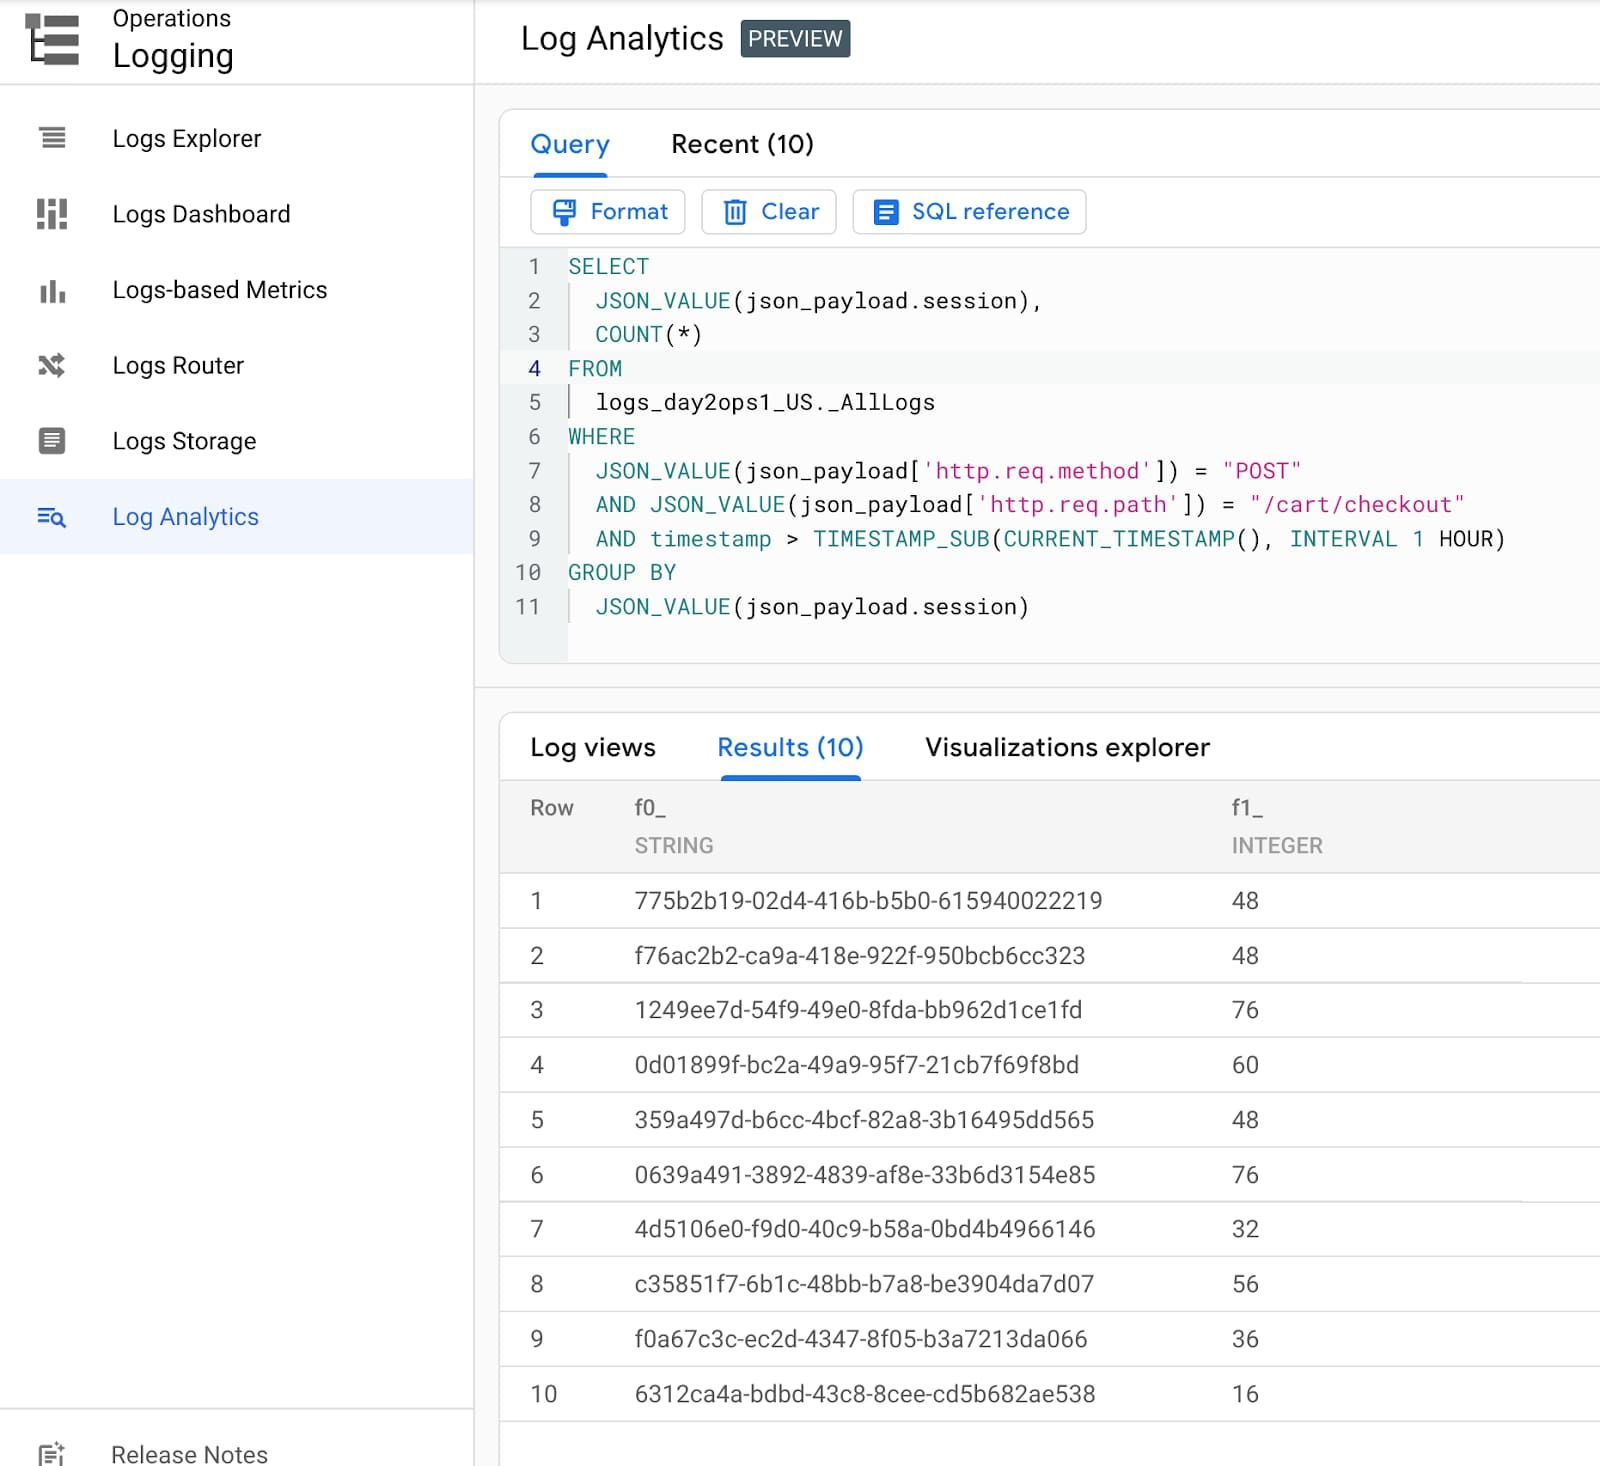
Suppose that you are troubleshooting a problem with your application running on Google Kubernetes Engine and you need to break down the requests by sessions. Using Log Analytics, you can easily group and aggregate your request logs by session, gaining insights into the request latency and how it changes over time. This insight can help you reduce time spent troubleshooting by executing just one SQL query.
Network troubleshooting
Network telemetry logs on Google Cloud are packed with detailed networking data that is often high volume and cardinality. With Log Analytics, we can easily run a SQL query on the VPC Flow Logs to find the top 10 highest count of packets and total bytes grouped by destination IP address. With this information, you can generate insights into whether any of these destination IP addresses represent unusual traffic levels that warrant deeper analysis. This latency analysis makes it easier to identify any unusual values either as a part of network troubleshooting or routine network analysis.
#5: Gather business insights from log data
Log Analytics reduces the need for multiple tools by reducing data silos. The same log data can be used to gain business insights which can be useful for Business Operations teams.
Here are a few examples of how you can use Log Analytics:
- Determine the top 5 regions from where content is being downloaded
- Determine the top 10 referrers to a URL path
- Convert IP addresses to city/state/country mapping.
- Identify unique IP addresses from a given country accessing a URL
#6: Simplify audit log analysis for security users
For security analyses, one common pattern is to review all the GCP audit logs for a given user, IP address or application. This type of analysis requires very broad search and scalable capabilities since different services may log the IP address in different fields.
In Log Analytics, you can easily find values in logs using the SEARCH function to comb through all the fields in the log entry across terabytes of logs without worrying about the speed and performance of the database.
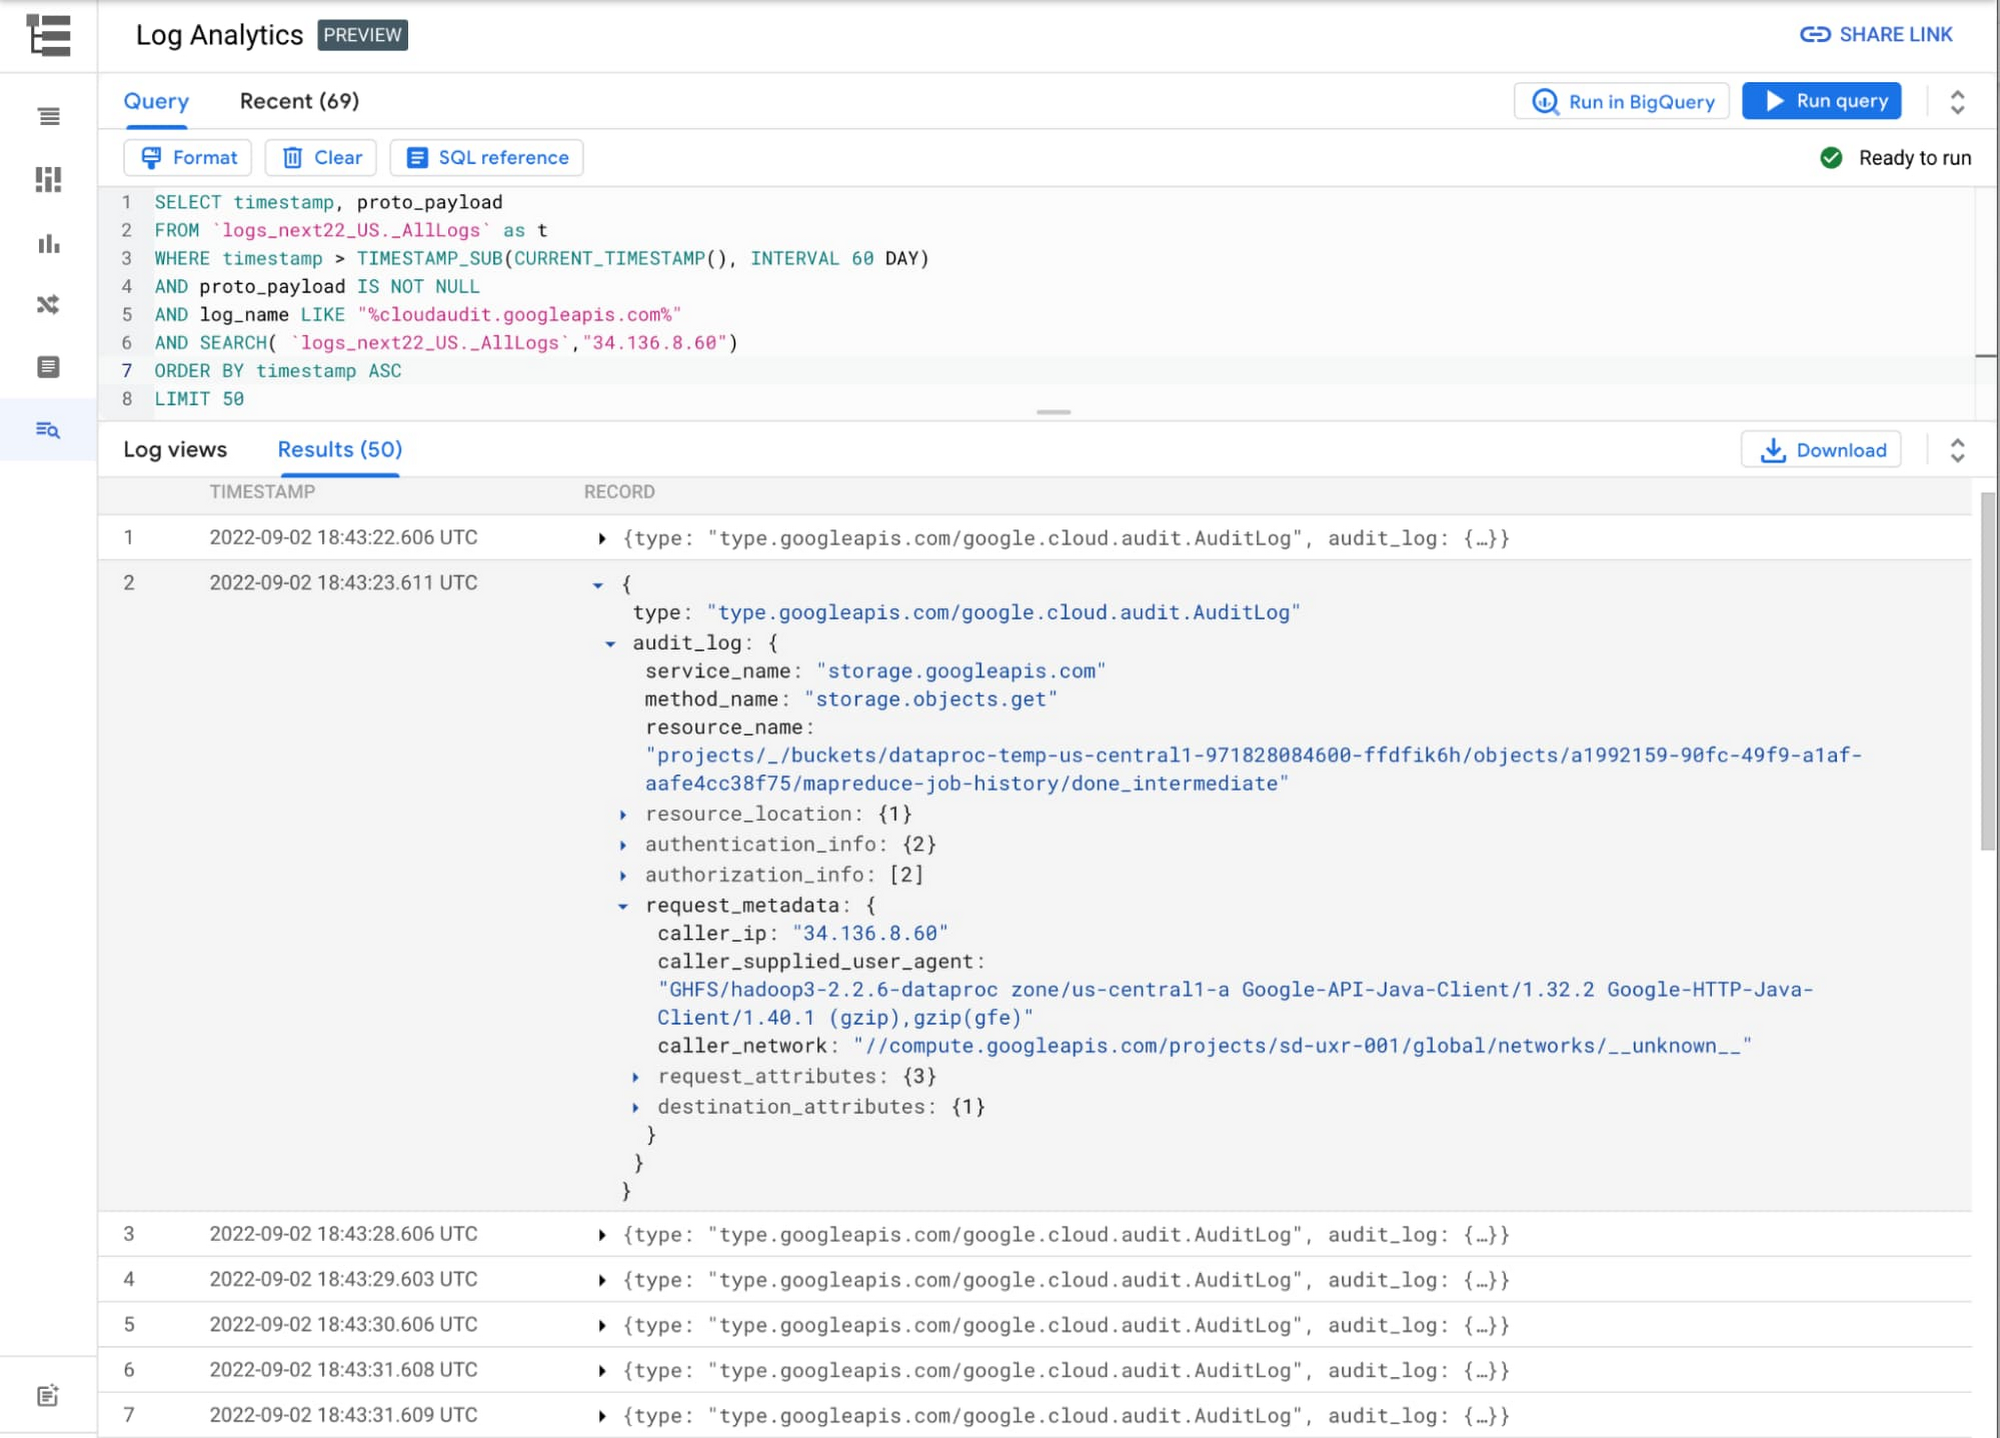

With the SEARCH function, you can now search across log data in SQL even when you’re not exactly sure in which field your specific search term will appear in the log entry.
#7: Use Visualization for better insights
We have many great enhancements on the roadmap that will make it even easier to generate insights. Charting is one of the features that can easily help users make sense of their logs. Charting in Log Analytics is available now as a Private Preview (sign-up form).
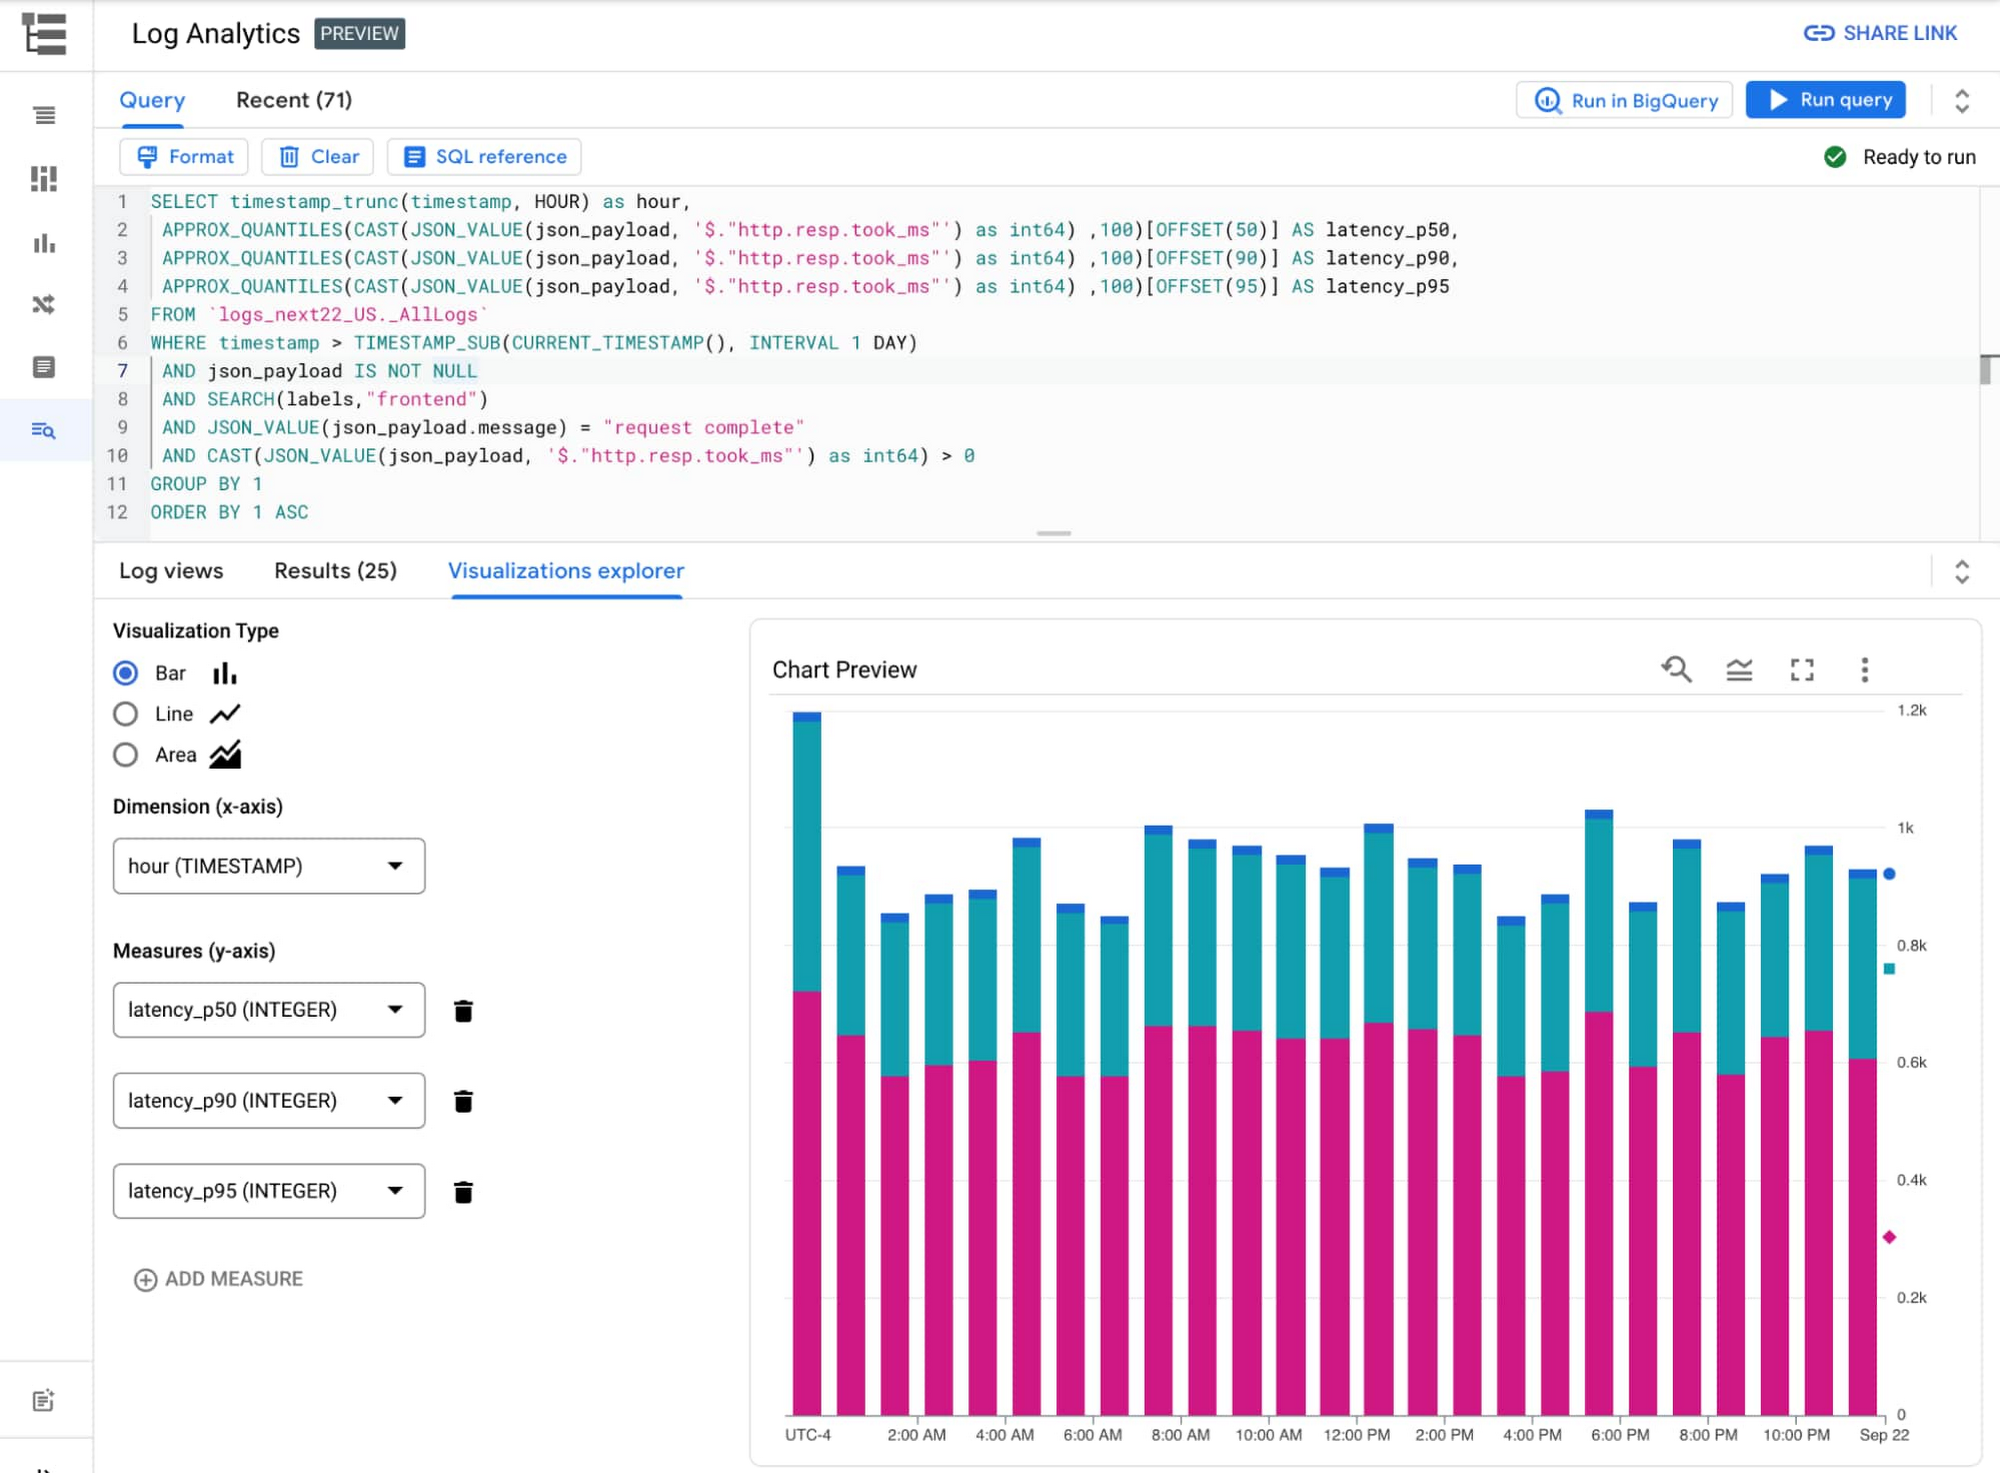

During the Private Preview for charting capabilities, we’re working hard to make it easier to use with support for additional chart types and a simple charting selector.
#8: Cloud Logging provides an enterprise-grade logging platform
While Log Analytics is currently in Preview, the Cloud Logging platform is already GA and provides an enterprise-grade logging solution complete with alerting, logs-based metrics and advanced log management capabilities. With Cloud Logging, you can help reduce operational expenditure while supporting your security and compliance needs.
#9: Use our sample queries to get started today
We put together common queries in our Github repository to make it easy to get started.
Use this SQL query to determine the min, max and average # of requests grouped for a service.
Use this query to determine if your Load Balancer latency was more than 2 seconds.
When actively troubleshooting, you can determine the list of top 50 requests to filter out the HTTP errors with this query.
Check out Github for additional sample queries.
#10: Use our lab to gain hands on experience on Log Analytics
Using the Log Analytics on Google Cloud lab, you can work through deploying a sample application, managing log buckets and analyzing log data. This can be a great way to get started, especially if you’re not already using Cloud Logging.

Summary
We’re building Log Analytics for Developers, SRE, DevOps and Operations teams to gain insights faster while keeping costs under control. To learn more about how you can use Log Analytics, please join our live webinar on Nov 15th (registration) which will include a live demo. To get started with Log Analytics today, you can use the lab to gain hands-on experience, visit the documentation or try out the Log Analytics page in the Cloud Console.
