Viewing event annotations on Monitoring or observability dashboards can help you correlate the events with issues that you might experience in your SAP systems. For more information about event annotations, see About event annotations.
From version 3.7, Google Cloud's Agent for SAP automatically keeps track of certain changes in your SAP systems and the underlying infrastructure. For example, the agent tracks if the SAP HANA database in your SAP system stops or restarts, if the underlying Compute Engine starts or restarts. The agent's integration with Cloud Logging and Monitoring lets you show these events as annotations on Monitoring or predefined observability dashboards.
Supported SAP event types
The following table describes the SAP event types that you can show as annotations on Monitoring or predefined observability dashboards:
| Event type | Description |
|---|---|
| SAP Availability |
Provides information about the status of the following resources whenever they stop, start, or face any errors: SAP HANA, SAP NetWeaver, and the nodes and resources in Pacemaker-managed Linux high-availability (HA) clusters. Showing events of this type as annotations requires Google Cloud's Agent for SAP to collect the following Process Monitoring metrics:
|
| SAP Backint |
Provides information about Backint based backup and recovery operations. Showing events of this type as annotations requires Google Cloud's Agent for SAP to collect the Backint metrics. For information about these metrics, see Backint metrics collection. |
| SAP Operations |
Provides information about the status of data replication in SAP HANA high-availability (HA) systems. Showing events of this type as annotations requires
Google Cloud's Agent for SAP to collect the following
Process Monitoring metric: |
Configure the Agent for SAP
To show SAP events as annotations on Monitoring or predefined observability dashboards, you need to install Google Cloud's Agent for SAP and configure it to emit the required set of metrics.
To do this, complete the following steps:
Make sure that version 3.7 or later of Google Cloud's Agent for SAP is installed on the Compute Engine instances that host the SAP systems that you want to monitor.
For information about how to install the agent, see Install and configure Google Cloud's Agent for SAP on a Compute Engine instance. For information about how to update the agent, see Update Google Cloud's Agent for SAP.
Configure the agent as follows:
Set the
log_to_cloudconfiguration property of the agent to the valuetrue.To set this value, connect to your Compute Engine instance by using SSH and then run the following command:
sudo /usr/bin/google_cloud_sap_agent configure -setting=log_to_cloud -enable
Enable the collection of the required types of metrics.
For information about the metrics that are required for the supported SAP event types, see Supported SAP event types.
Show SAP events on a dashboard
In the Google Cloud project where events need to be shown on dashboards, grant the required IAM roles or permissions to the users who need to view and show the SAP events on dashboards.
For information about the required IAM roles and permissions, see the "Before you begin" section in Show events on a dashboard.
Configure the Monitoring dashboard or predefined observability dashboard to show the required SAP events.
For information about how to configure the dashboard, see the "Show events" section in Show events on a dashboard.
For information about the SAP event types that you can show as annotations on dashboards, see Supported SAP event types.
View SAP event details
When you view a chart on a dashboard, you see the selected SAP events when they occur in your SAP system. You can view additional information about that event by clicking the View button.
For more information about viewing event details, see the "View event details" section in the Show events on a dashboard.
The following example images show SAP events as annotations on dashboards:
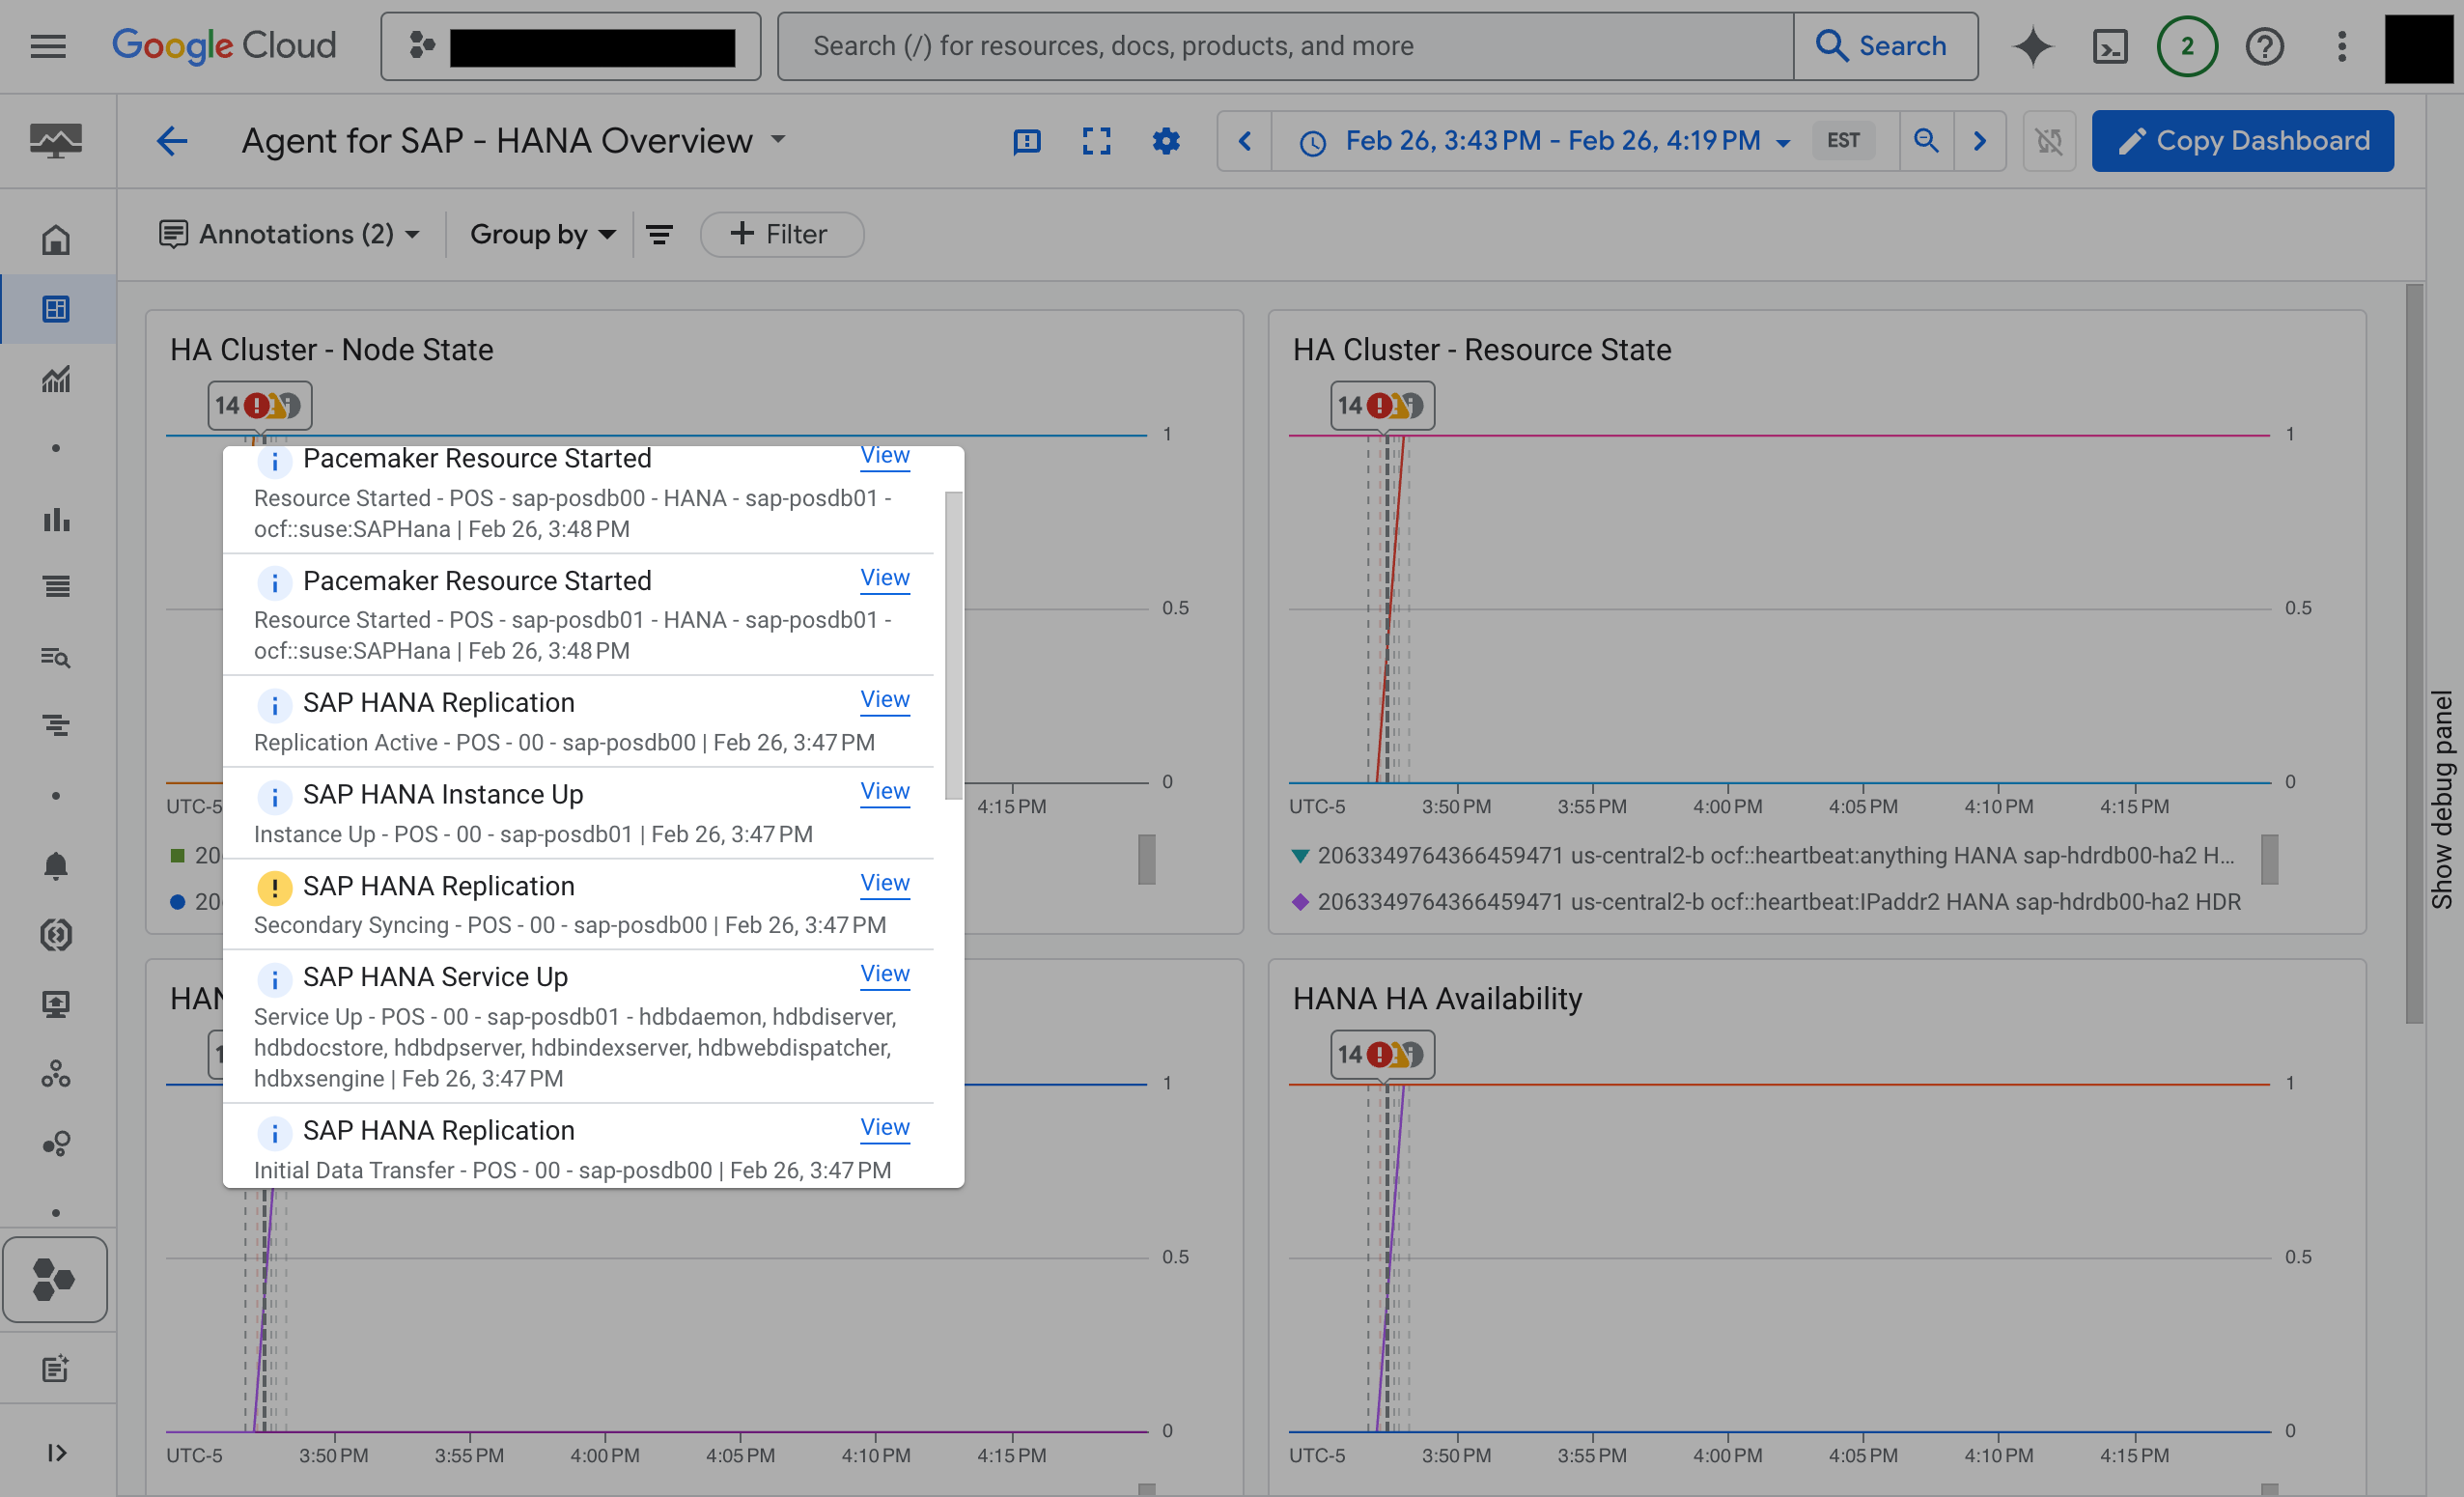
The following example image shows events of types SAP Availability and SAP Operations that get triggered after a failover occurs in the Pacemaker-managed high-availability (HA) cluster, which includes the following:
- Moving the SAP HANA database from the primary node of the cluster to the secondary node.
- Reconnecting the old primary node as the secondary node in the cluster.
- Enabling SAP HANA System Replication between the primary and secondary nodes in the cluster.
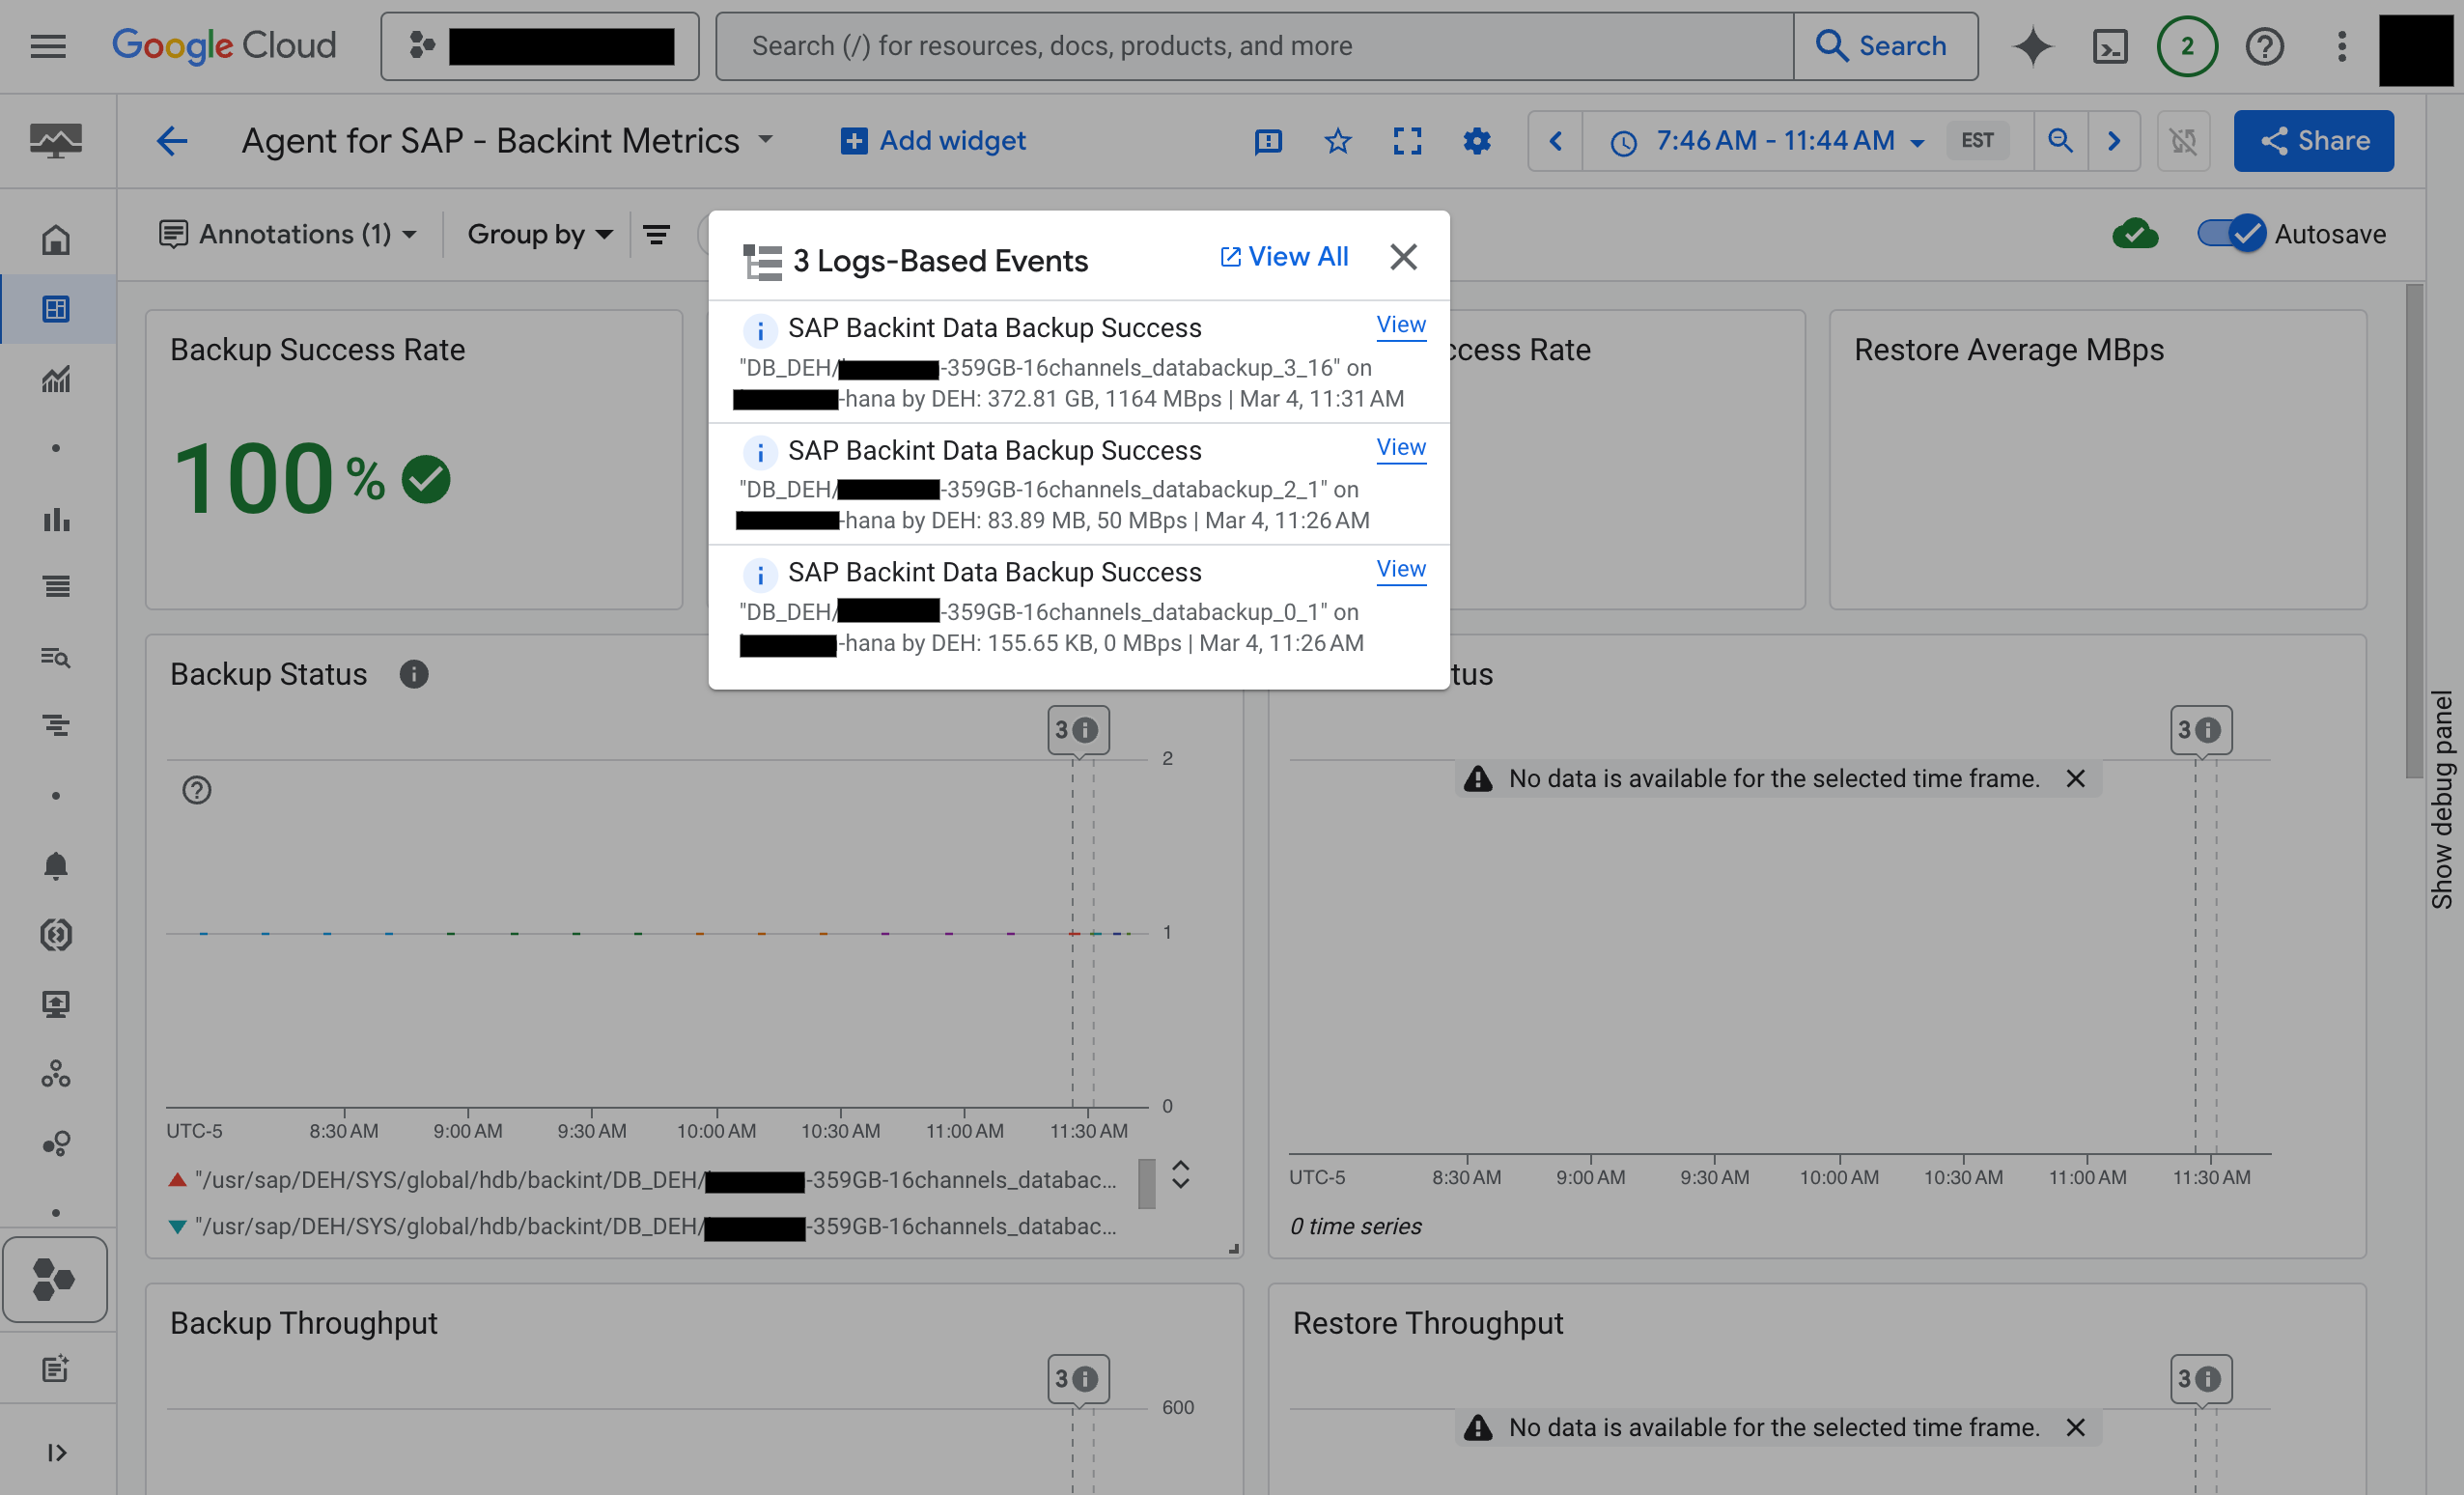
The following example image shows events of type SAP Backint that get triggered after the successful creation of a Backint based backup the SAP HANA data volume and partitions. The event annotation provides information about the throughput and size of the backup.