The Monitoring Dashboard page displays the following execution metrics, both at an integration level and at the task level:
- Count of all the errors and warnings
- Number of executions per minute
- Time take for execution of tasks in
- Average duration of execution for the integration, in ms/minute
To view the Monitoring Dashboard page, open your integration and click Monitoring in the integration designer toolbar.
The following image shows a sample Monitoring Dashboard page.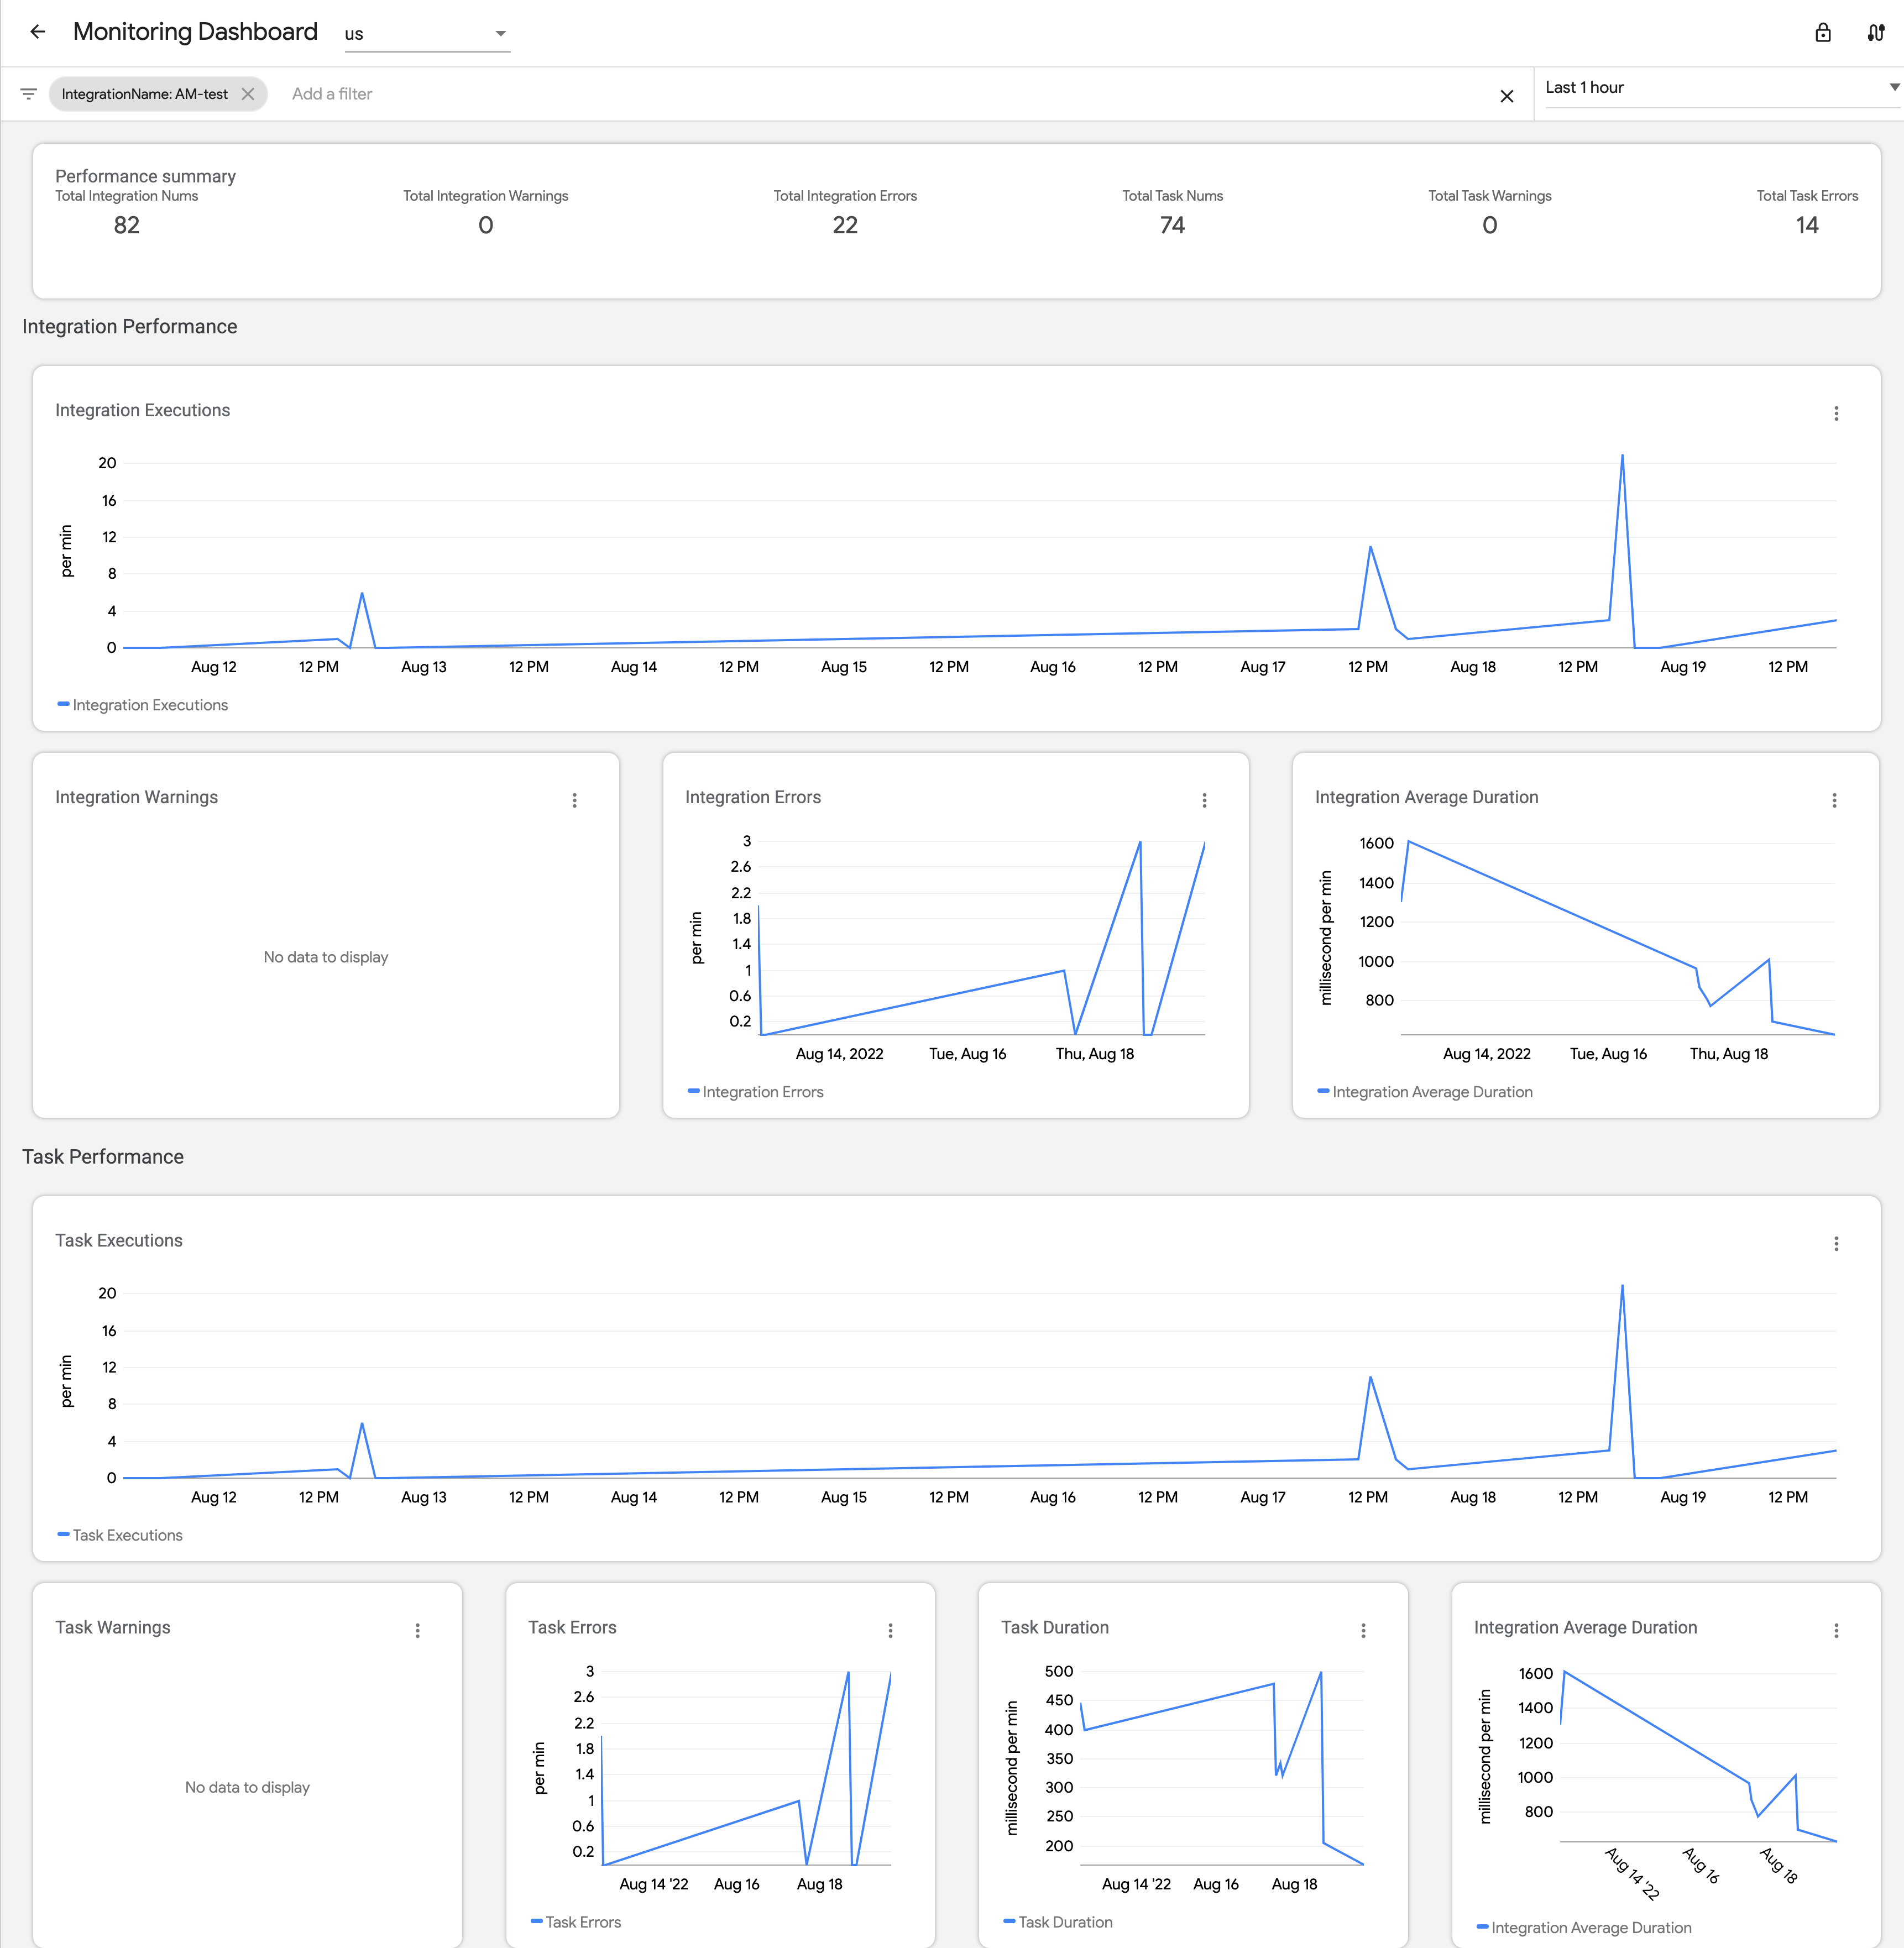
Filters
The Monitoring Dashboard page allows you to filter the metrics based on one or more of the following attributes:
- IntegrationName: Name of the integration.
- TriggerId: Id value of the trigger.
- TaskName: Name of the task.
- ErrorEnum: Value of error code.
- WarningEnum: Value of warning code.
- RetryAttempt: Number of retry attempts.
- Status: Status of the integration.
- TaskNumber: Unique identifier of the task.
Considerations
- Dashboard latency: Latency refers to how long it takes before a new performance metric is available in the Monitoring Dashboard after the execution of an integration. The expected latency is from 1 to 5 minutes.
- Performance metric data accuracy: All the performance metric data that is displayed in the Monitoring Dashboard is for informational purpose only. The aggregated performance metric data might not be 100% accurate.