This page applies to Apigee and Apigee hybrid.
View
Apigee Edge documentation.

Advanced API Security's abuse detection lets you view security incidents involving your APIs. A security incident is a group of events with similar patterns that could represent a security threat. Advanced API Security uses machine learning models to detect patterns that are a sign of malicious activity, including API scraping and anomalies, and cluster events together based on similar patterns.
When Advanced API Security detects a security incident, it reports the following:
- The risk level and duration of the incident
- The proxies affected by the incident
- The IP addresses of the incident events
- The detection rules that were triggered by the incident
- The countries of origin of the incident
and other related information about the incident.
You can access abuse detection either through the Apigee UI, as described below, or through the Incidents API or the Security stats API
See Required roles and permissions for abuse detection for the roles and permissions needed to use abuse detection.
To use this feature, you must enable the add-on. If you are a Subscription customer, you can enable the add-on for your organization. See Manage Advanced API Security for Subscription organizations for more details. If you are a Pay-as-you-go customer, you can enable the add-on in your eligible environments. For more information, see Manage the Advanced API Security add-on.
Opt in for machine learning models for Abuse Detection
Apigee requests your help in improving the machine learning models for abuse detection in your organization, by allowing us to train the models on your data. Training the models on your data helps improve their accuracy for detecting security incidents. The training will only apply to your organization. Your data will not be shared with any other Google Cloud customers for training purposes.
When you first open the Abuse detection page in the Apigee UI, you will see an opt-in request to allow Advanced API Security's machine learning models to use your API traffic data for model training. You must explicitly opt in to use the model for abuse detection. Note that if you do not choose to opt in to model training, you will not see any detections from the Advanced Anomaly Detection rule. This rule does not work without opting in for model training.
See Required roles and permissions for abuse detection for information on roles needed to manage whether machine learning is enabled.
Use a machine learning model for Abuse Detection Advanced Anomaly Detection
In order to see detected anomalies in Abuse Detection, you must opt in to allow the Advanced Anomaly Detection machine learning model to train on your API traffic data.
The model only uses your data for training. Your data is never shared with any other Google Cloud customers.
To opt in to use your API traffic data for anomaly detection model training, select that option when adding anomaly detection to your Abuse Detection configuration.
Open the Abuse detection page
To open the Abuse detection page:
Apigee in Cloud console
In the Google Cloud console, go to the Advanced API Security > Abuse detection page.
Classic Apigee
In the classic Apigee UI, select Analyze > API Security > Abuse detection.
This displays the main Abuse detection page:

Change permissions for allowing Apigee to improve your machine learning models
You can change your permissions for allowing Apigee to improve your machine learning models at any time, by clicking Settings at the top right of the Abuse detection page and selecting the option to either enable or disable this feature.
Main Abuse detection page
At the top of the page, you can select one of the following recent time periods in which to view incidents: the past 1 day, 1 week, or 2 weeks.
The table in the page displays the environments in your organization that are affected by security incidents during the selected time interval.
Each row of the table also displays the following:
- Environment: The environment in which the abuse occurred.
- Total incidents: The total number of incidents in the environment during the selected time interval. See Limitations on incidents and data displayed for more information on what incidents and data are displayed in the UI.
Risk level: Shows the number of incidents at three risk levels: severe, moderate, and low. Risk level is based on different characteristics of an incident, such as the number of rules detected, their types, and the relative size of the incident compared to legitimate traffic. The risk level is intended to help you prioritize which incidents to investigate, so you can focus on the most critical ones.
Risk level can be one of the following:
- Severe: Severe incidents present high risk. We recommend that you prioritize investigating them.
- Moderate: Moderate incidents present some risk, but less than those with severe risk, and we recommend that you prioritize them over low risk incidents.
- Low: Low risk incidents can be investigated last, after you have investigated the higher risk incidents.
The number next to each risk level indicates the number of incidents at that risk level.
Environment details
To view the incidents in an environment for the selected time range, select the environment in the table shown above. This opens the Environment details view:

If you see an incident or detected traffic, and want to create a security action to block or flag requests related to the incident or detected traffic, click Create Security Action at the top of the page. This opens the Security actions page.
The Environment details view has two tabs:
- Incidents: Shows a list of incidents in the environment and information about them.
- Detected traffic: Shows details of detected abuse traffic related to the incidents.
Incidents
The Incidents tab of the Environment details view, shown above, displays the following options:
- Environment: Change the environment in which to view incidents.
- Proxy: You can use Select all to display incidents for all proxies, or select one or more individual proxies to display incidents only for selected proxies.
- Include archived incidents: When this is selected, the incidents list
displays archived incidents. Archived incidents
are displayed with an icon next to them:

To hide archived incidents from the list, deselect Include archived incidents. You might want to hide archived incidents if there are many incidents displayed and you don't want to view them all, or if you want to hide incidents that you have already investigated.
The Incidents view also displays the following:
- Incident name: A generated name summarizing the incident.
You may see "Miscellaneous" for some low risk incident names. These include traffic that did not fit into groupings representing well-defined, higher risk threat patterns. (This functionality is not yet available if you have VPC-SC enabled.) - Risk level: The risk level of the incident. In general, focus on High risk incidents first, which also have higher confidence than Low risk incidents.
Top detection rules: A list of the top detection rules that were triggered by the incident.
- Incident traffic: The total number of events: API calls that were tagged by one of the detection rules related to the incident.
- First event detected: The date and time the first event in the incident was detected.
- Last event detected: The date and time the last event in the incident was detected.
- Duration: The duration of the incident, from its first event to its last.
- UUID: The universally unique identifier of the incident.
Incident details
To view the details of an incident, click its name in the table. This displays the Overview pane of the Incident details view:
You can click Create Security Action at the top of the page to create a security action in response to the incident.
The Incident details view has two tabs, Overview and Attributes. See Overview for information on the overview tab and see Attributes for information on attributes.

Overview
The Overview pane displays basic information about the incident, including the following:
- Incident name: The name of the incident.
- Risk level: The risk level of the incident.
- Impacted proxies: The number of proxies affected by the incident. Click View proxies to view the affected proxies.
- Duration: The duration of the incident, from its first event to its last. It also shows the date and time when the event was first detected.
- IP addresses (count): The number of unique IP addresses detected for this incident. Click View IP addresses to see more information on the IP addresses.
- Insights: Abuse detection incident details might include generative AI insights created using
Google Cloud generative AI large language
models (LLMs).
The LLM summarizes the detected traffic per incident to help you better understand the
security incident, provides additional context and information on the
incident, links to supporting documentation, and recommends next steps. Provide your feedback
by clicking the thumbs up or thumbs down icon and providing an optional explanation.
Insight summaries and recommendations are based on the last 14 days of data, even if the incident started longer than 14 days ago.
These generative AI insights are included automatically in abuse detection if the project and your user account are set up to use the Cloud AI Companion API. See Enable the Cloud AI Companion API in a Google Cloud project and Grant IAM roles in a Google Cloud project. User accounts also need an additional permission to view insights. See Required roles and permissions for abuse detection.
To disable the generative AI insights, disable Cloud AI Companion API for this project following the instructions in Disabling services. - Events: Displays a time series graph of events in the incident. For each time point
in the graph, the corresponding y value is the total number of events in a short time period
around that time. If you hover the cursor over
a point in the graph, the number of events in the most recent time period is
displayed below Value. You can see the values where the time periods change by
moving the cursor to the left or right and observing where the values change.
The Events pane also displays the total environment and incident traffic counts.
- Top rules detected: Displays up to five of the top groups of rules detected,
including the following information:
- Dominant rules: The most significant detection rules that were triggered by the incident.
- Dominant rules API events: The number of API events tagged by the dominant rules.
- Total rules detected: The number of detection rules that were triggered by the incident.
To view all rules, click View All Rules at the bottom of the card.
- Top countries detected: A map showing the countries that
were sources of events in the incident. Below the map is a chart that shows up to five of
these countries and the percentage of the total traffic originating in these countries.
Note: If the country of origin of the events can't be determined, the map displays not set.
To view all countries, click View All Countries at the bottom of the card.
- IP addresses: View incident details by source IP addresses for events in the
incident. Select Display all IP addresses to see all IP addresses in the list.
Note: The IP addresses pane displays unique IP addresses, even if more than one incident corresponds to the same IP address. IP addresses displays the following columns:
- IP address: The IP address for the incident. Click View if the IP address is not visible. Once the IP address is shown, click it to see the Details view.
- Location: Location of the IP address.
- Detected traffic: Total number of requests from the IP address.
- % of calls: Percentage of requests from the IP address out of all calls in the environment.
- First event detected: The first time an event was detected in the incident.
- Last event detected: The last time an event was detected in the incident.
-
API Keys lists incidents by API key. Select Display all API keys to see all API keys in the list. The list includes the following columns:
- API key: The API key for the incident. Click View if the key is not visible. Once the API key is shown, click it to see the Details view.
- App: The developer application or AppGroup application associated with the API key.
- Detected traffic: Total number of requests from the API key.
- % of calls: Percentage of requests from the API key out of all calls in the environment.
- First event detected: The first time an event with a request with this API key was detected in the incident.
- Last event detected: The last time an event with a request with this API key was detected in the incident.
Mitigate large numbers of false positives
If you're seeing a large number of false positives and internal IP addresses flagged as anomalies by Advanced API Security's Abuse Detection rules, follow the guidance in this section to mitigate the problem.
By default, Apigee uses the first public IP address listed in the X-Forwarded-For (XFF) header in the API requests. However, for organizations with significant internal API traffic, the XFF header might include private IPs that are listed before public IPs. (For example, when using a public load balancer IP address). In this case, Apigee's default behavior is to ignore the private IPs in the XFF header, and display the public load balancer IP address as the traffic source. This could result in Apigee attributing an artificially large amount of traffic to that public IP address, which could then be flagged as an anomalous traffic pattern in Advanced API Security's Abuse Detection feature.
You can mitigate this problem by configuring client IP address resolution for the environment to indicate which IP address Apigee should use as the source IP. Using client IP resolution guides Apigee to report the true source IP address for your API traffic. For example, you could tell Apigee to always use the first IP address in your XFF header, even if that is a private IP address.
Archive incidents
To help you distinguish between the incidents you have already investigated from those that you haven't, you can archive the incidents that no longer require your attention. Archiving an incident hides it from the Environment details > Incidents list (provided that Include archived incidents is not selected). Archiving does not delete an incident: you can always unarchive it if you change your mind.
To archive an incident, select Archive at the top of the
Incident details view.
After you do so, the Archive button label changes to
Unarchive.

Unarchive incidents
To unarchive an archived incident:
- In the Environment details > Incidents view, click the icon next to
the incident you want to unarchive:
- At the top of the incident list, click Unarchive.
Alternatively, if you are in the Incident details view for the incident, click Unarchive.
Detected traffic
Detected traffic is traffic that triggered an abuse detection rule. The Detected Traffic view displays information about incidents, which are specific instances of detected traffic. The page shows incidents with Last event detected within the past 14 days. See Limitations on incidents and data displayed for more information on the time range of the data displayed in the UI.
To open the Detected Traffic view, select Detected Traffic in the Environment details view:

The Detected Traffic view displays data for:
- Total traffic: The total number of requests.
- Detected traffic: The number of requests from IP addresses of detected abuse.
- % of detected traffic: The percentage that detected traffic makes up out of total traffic.
- Detected IP address count: The number of distinct IP addresses corresponding to the detected abuse. Multiple requests from the same IP address are only counted once.
The Detected Traffic view also displays a table listing the details of each IP address corresponding to the detected abuse. Note that by default, the IP addresses are not displayed for privacy reasons. To view them, select Display all IP addresses at the top of the table.
Each row of the IP address table displays:
- IP address: IP address of the detected abuse. Click View to see the address. Once the IP address is shown, click it to see the Details view.
- Location: The location of the IP address.
- Top app key: The app key used most frequently in requests from the IP address. Note: app key is another term for API key.
- Detection rules: A list of all detection rules that were triggered by the abuse.
- Top URL: The URL that received the most requests from the IP address.
- Detected traffic: The number of requests from the IP address.
- % of detected traffic: The percentage of requests from the IP address out of all requests in the environment.
- First event detected: The first time an event was detected in a request from the IP address during the time range selected at the top of the Security Scores page.
- Last event detected: The last time an event was detected in a request from the IP address during the time range selected at the top of the Security Scores page.
Details view
The Details view provides information about the incident or detected traffic. It shows detected rules, first and last detection dates, and attributes for detected traffic from the IP address of API key. (See the Analytics dimensions reference and the Security stats API dimensions for more information on the detail fields.)
For IP addresses, the Details tab also includes information about related Ingress access logs. See Ingress access logs in Abuse Detection for information.
If detected rules for the incident or traffic involve anomaly detection rules, the Advanced Anomaly Detection reasons section shows information about the detected anomalous traffic.
Raw data tab
After clicking the IP address or API key, you can select the Raw data tab to see raw data for the detected traffic, including timestamps, request paths, and response status codes. Raw data shown is limited to 1,000 rows and is a sample, not necessarily the most recent data.
Abuse Detail tab
If the incident or detected traffic includes detected anomalies, the Abuse Detail tab shows information about the detected anomalous events, including time series graphs of traffic from the IP address with anomalous events indicated.
The time series charts show activity at and near anomalous indicators. For example, if an error rate spikes, the y-axis of the time series shows the error rate before, at, and after the spike. If traffic volume spikes, the y-axis of the time series shows volume data before, at, and after that event.
The model might not always flag and show all anomalous data in the time series charts. The model selects the activity it determines has the biggest influence on environment-level error rates.
Links under the charts connect directly to the Google Cloud logging related to the event. See Ingress access logs in Abuse Detection for information.
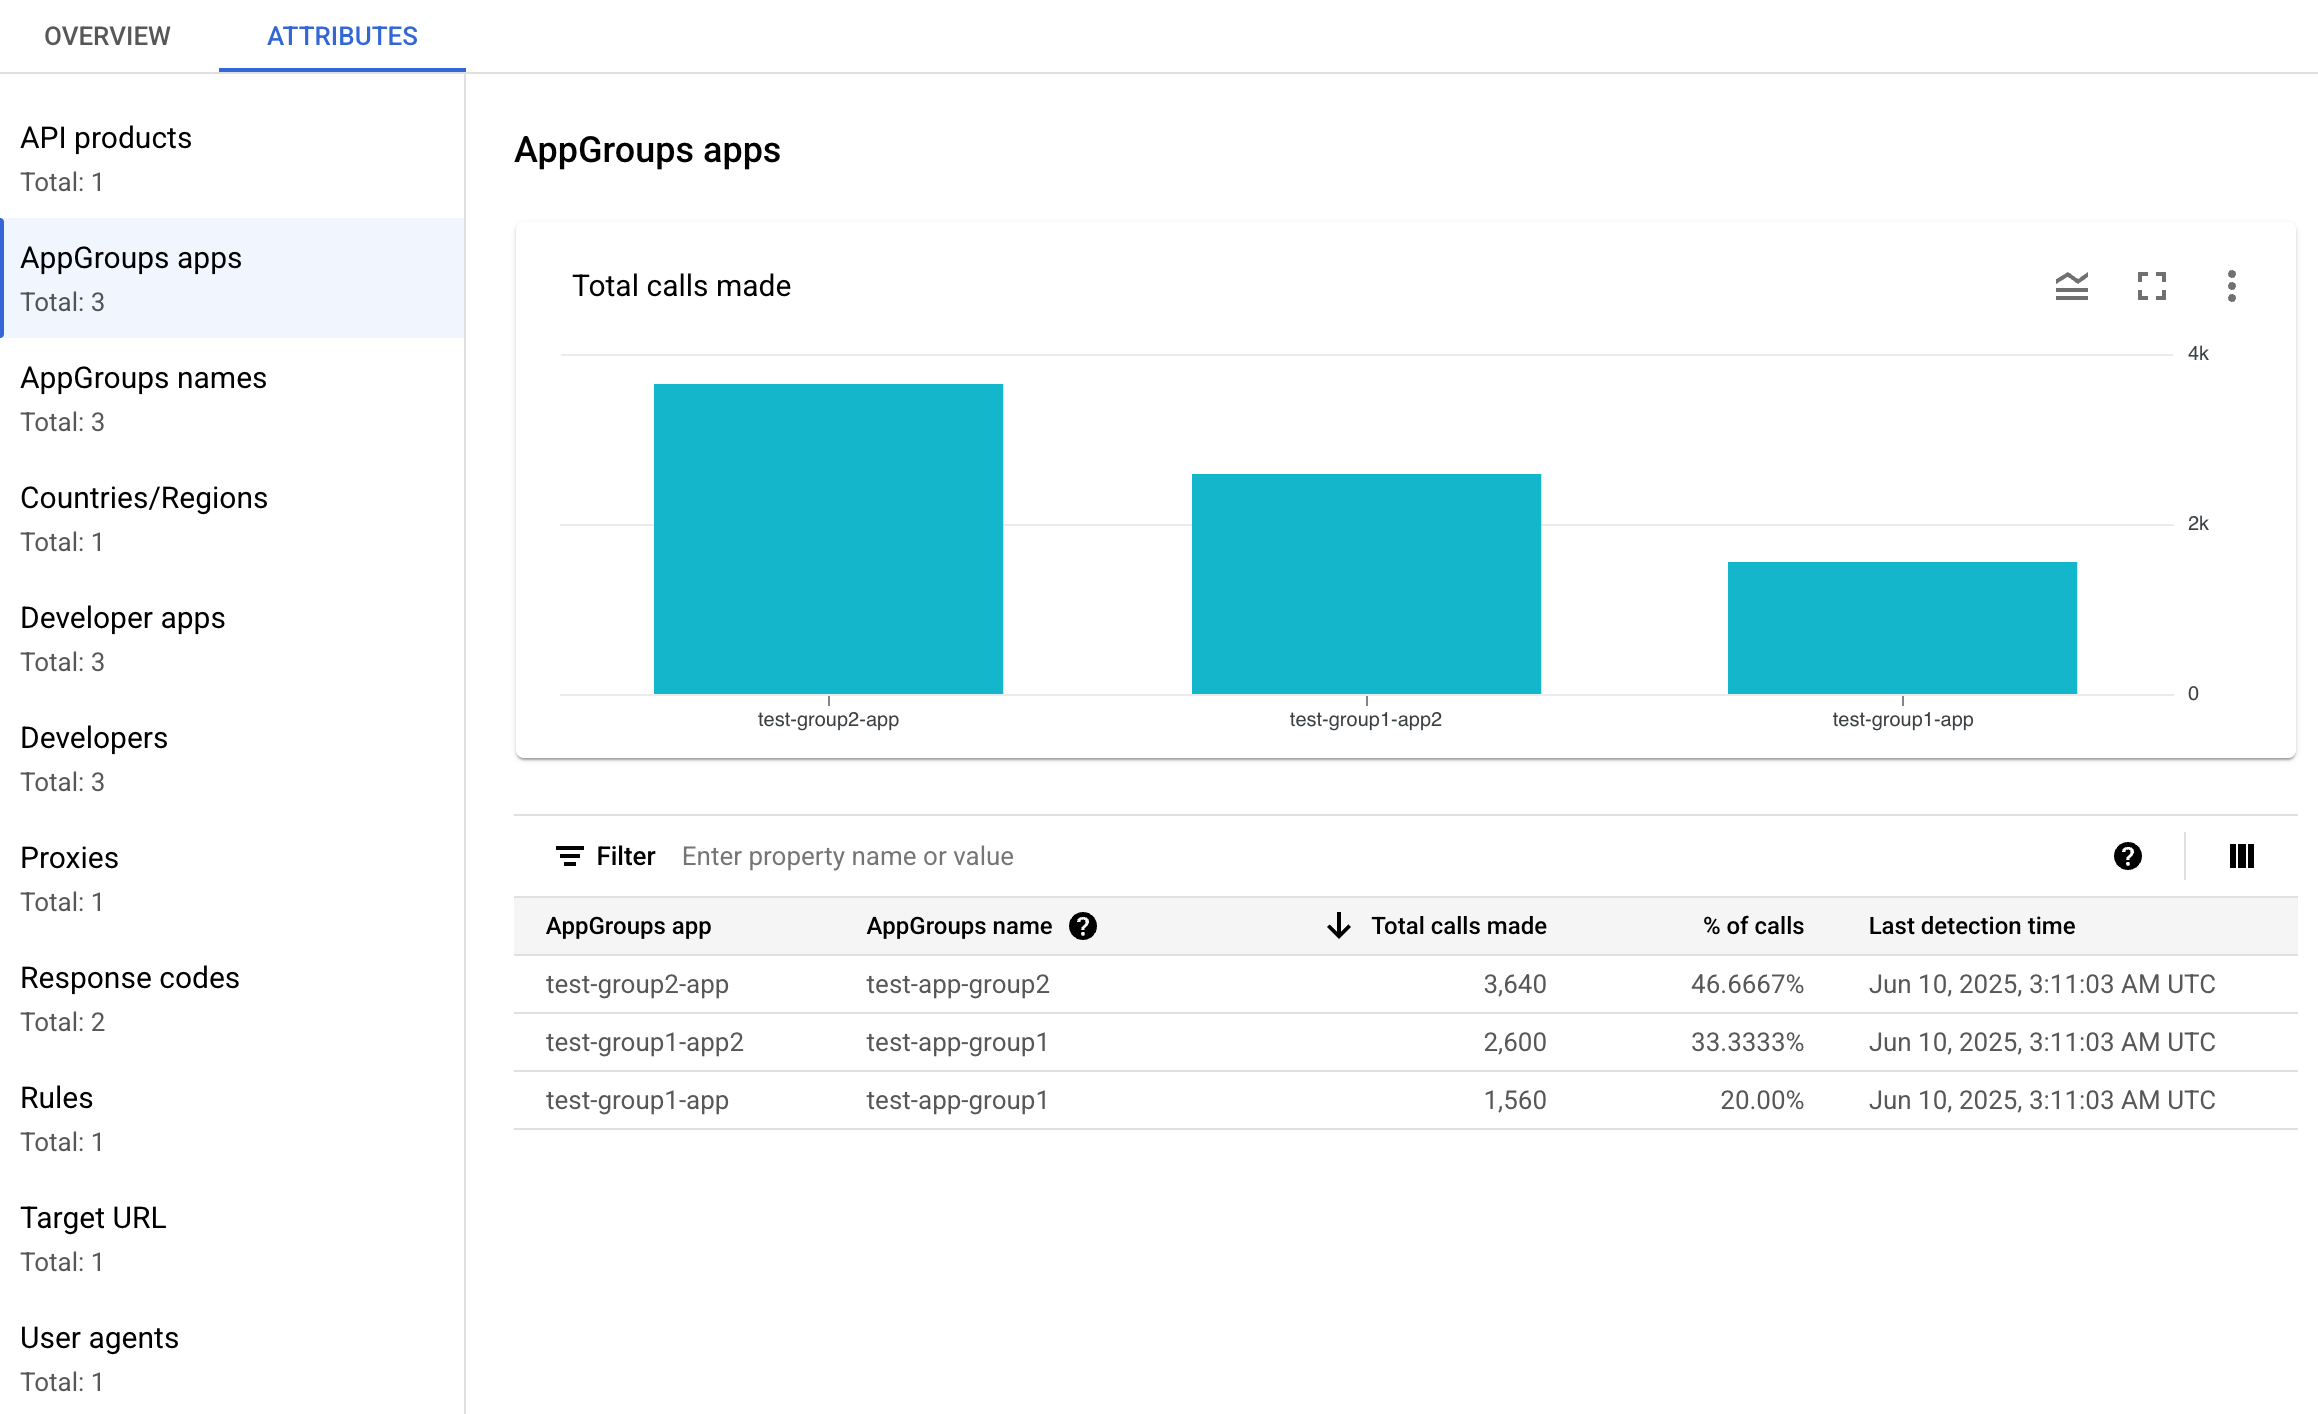
Attributes
The Attributes view lets you drill down on the details of an incident or detected traffic. Attributes—also known as dimensions— are groupings of the data that let you view the incident in different ways. For example, the API products attribute lets you view the data by API product.
To view the Attributes for an incident, select the Attributes tab at the top of the Incident details view.
To view the Attributes for a specific API address or API key in an incident or detected traffic, click the IP address or API key in the results table on that overview page.
The left pane displays all of the attributes and the number of distinct values for each attribute. You can select an attribute to view its incident details.
The picture above shows the Attributes view with Countries/Regions selected. The Countries/Regions pane displays graphs of the percentage of API calls made for each region.
See
What does it mean
when an attribute has the value (not set) if you see (not set)
for any values.
The Filter field lets you filter the data displayed in the pane for an attribute by various properties.
In general, the pane for an attribute displays a table that shows incident data by the values of the attribute. The columns of the table include:
- Total calls made: Total number of API calls.
- % of calls: Percentage of all calls for each value of the attribute.
- Last detection time: The last time an event related to the incident was detected.
For some attributes, the table has additional columns.
See dimensions for information on each attribute, including:
- API products: View details by API product.
- Countries/Regions: View details by the countries and regions where the events in the incident originated.
- AppGroup apps: View details by related
AppGroup
app. If no AppGroup is associated with the request, the AppGroup app and
AppGroup name columns show
(not set). See the Developer apps information instead. - AppGroups: View details by related
AppGroups
by name. If no AppGroup is associated with the request, the AppGroup name and
AppGroup app columns show
(not set). See the Developers information instead. - Developers: View details by
developers—the
people who develop the apps. Developers includes a column labeled
Apps, which lists the applications for each developer. If the app is owned by an
AppGroup,
the Developer column shows
(not set)and the Apps column shows the AppGroup apps. See the AppGroups names tab for more information. - Developer apps: View details by
application.
The Developer Email column lists the emails for each app's developers. If the app is owned by an
AppGroup,
the Developer column shows
(not set)and the Apps column shows the AppGroup apps. See the AppGroups apps tab for more information. - Proxies: View details by proxy.
- Response codes: View details by response code.
- Rules: View details by detection rules.
- User agents: View details by user agent—the software agent that made the API call.
What does it mean when an attribute has the value (not set)?
Occasionally, an attribute has the value (not set). There are several reasons why
this might occur. For one, Apigee might not have enough information to determine the attribute's
value—for example, the country of origin of an API call. Or, the attribute might not
apply in a particular case. See
What does an analytics entity value "(not set)" mean? for more information.
Ingress access logs in abuse detection
If you have enabled Cloud Logging for Apigee ingress access logs, the details page for an IP address or API key provides a link directly to Cloud Logging with a filter set for the currently selected IP address.
See View logs by using the Logs Explorer for usage information. Suggested filters:
- To see all anomaly types, view all calls.
- To find errors only, restrict the results to the Error severity.
See Logging Apigee access logs for information on and important pricing implications when using Cloud Logging ingress access logs for Apigee instances.
Exclude traffic from abuse detection
In some cases you might want to exclude traffic from abuse detection. For example, if you have a set of IP addresses that you know are used for automated testing or probing, you might not want to flag excessive traffic from those sources as abuse.
Exclude traffic from abuse detection by adding attributes to exclusion lists, which specify the traffic to exclude and the reasons why. At this time Apigee supports CIDR ranges and IP addresses as attributes you can use to exclude traffic.
Exclusion lists
Exclusion lists collect the attributes to exclude from detection. You can create multiple exclusion lists for each environment, and each list can include multiple CIDR ranges and IP addresses.
When managing exclusion lists you can add or modify attributes directly. For example, you don't need to wait for an IP address to appear in an abuse detection incident to exclude it from detection.
It can take up to three days for traffic that's added to an exclusion list to be excluded from new incidents. Once the traffic is excluded, it does not appear in any new detections or incidents, but does continue to appear in previous reports, marked in the Exclusions column for incidents and detected traffic in the UI.
Exclusion list fields
Exclusion lists include these fields. All fields are required unless marked optional.
| Field | Description |
|---|---|
| Display name | The display name for the list. This name is shown in the Exclusions tab. |
| IP addresses and CIDR ranges | The IP addresses or CIDR ranges to exclude from detection. You must include at least one
CIDR range or IP address, and can exclude a maximum of 30 total CIDR ranges and IP addresses
per list. Prefer CIDR ranges over IP addresses where possible. |
| Reason | A reason for excluding the traffic. Select from the reasons provided. |
| Details (Optional) | A comment about the list, providing more information on why the traffic is excluded. |
Manage exclusion lists
To manage exclusion lists directly:
- Select an environment for abuse detection.
- Select the Exclusions tab.
- To create a new exclusion list, click Create. To edit an existing exclusion list, select Edit in the more actions menu in the row for that list.
- Complete the fields as described in Exclusion list fields.
Exclude traffic using the abuse detection incident details page
To exclude one or multiple IP addresses:
- View the details for an incident.
- In the IP addresses list, click Display all IP addresses to see the IP addresses in the list.
- For each IP address to exclude from detection, check the box next to the IP address.
- Click Exclude from detection at the top of the list.
- Select an existing exclusion list or create a new one.
- Complete the fields as described in Exclusion list fields.
- Click Save to save your changes.
Exclude traffic using the detected traffic page
To exclude one or multiple IP addresses:
- Select an environment for abuse detection.
- Select the Detected Traffic tab.
- In the IP addresses list for detected traffic, click Display all IP addresses to see the IP addresses in the list.
- For each IP address to exclude from detection, check the box next to the IP address.
- Click Exclude from detection at the top of the list.
- Select an existing exclusion list or create a new one.
- Complete the fields as described in Exclusion list fields.
- Click Save to save your changes.
Limitations on abuse detection
Abuse detection has the following limitations.
- Incidents whose Last event detected was over 14 days in the past are not displayed in the Abuse detection UI. See Limitations on incidents and data displayed for more information on what incidents and data are displayed in the UI.
- When you first enable Advanced API for an organization, or re-enable it, there will be a delay while events are clustered into incidents. After that, there will be periodic delays.
- The Incident details attribute page can take a brief time to load for organizations with a large amount of traffic.
- Exclusion lists support a maximum of 15 lists per environment with a maximum of 30 total CIDR ranges and IP addresses per list.
- Exclusion lists are not available with VPC-SC customers at this time.
- AppGroups are not supported in Apigee hybrid at this time.