This page applies to Apigee and Apigee hybrid.
View
Apigee Edge documentation.

This section describes how to create and manage debug sessions, and view the request and response data using the Apigee UI and API.
Use Offline Debug to view and analyze debug sessions that were previously downloaded.
Creating a debug session
The Debug tool is simple to use. You start a debug session, and then make an API call to Apigee, and then view the request and response data in the UI.
Create a debug session using the Apigee UI or API as described in the following sections.
Apigee Cloud console
Debug v2 (new)
To create a debug session:
-
In the Google Cloud console, go to the Proxy development > API Proxies page.
- Select the API proxy that you want to debug. This displays the Proxy Editor Overview pane.
- Click the Debug tab.
- Click Start debug session. This displays the Start debug session pane.
-
In the Start debug session pane:
- Select the Environment in which you want to run the debug session.
-
(Optional) From the Filter drop-down list, select a filter to apply to all transactions in the debug session you are creating. The default is
None (All
                  transactions)
, which includes all transactions in the debug data.For information on using filters, see Using filters in a debug session. For information about the built-in filters, see Using predefined filters.
- Click Start.
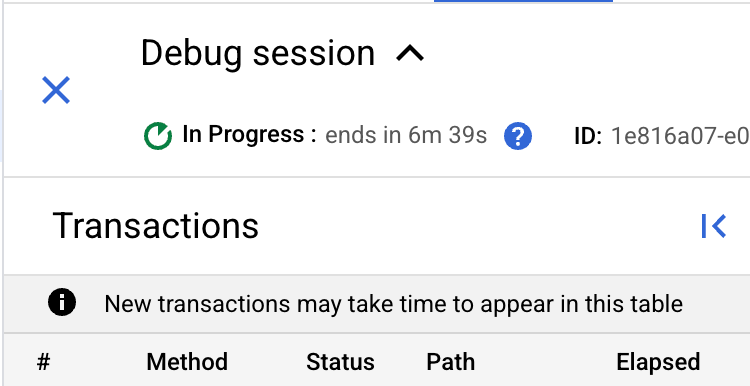
The Apigee UI now displays the Debug session in progress pane.
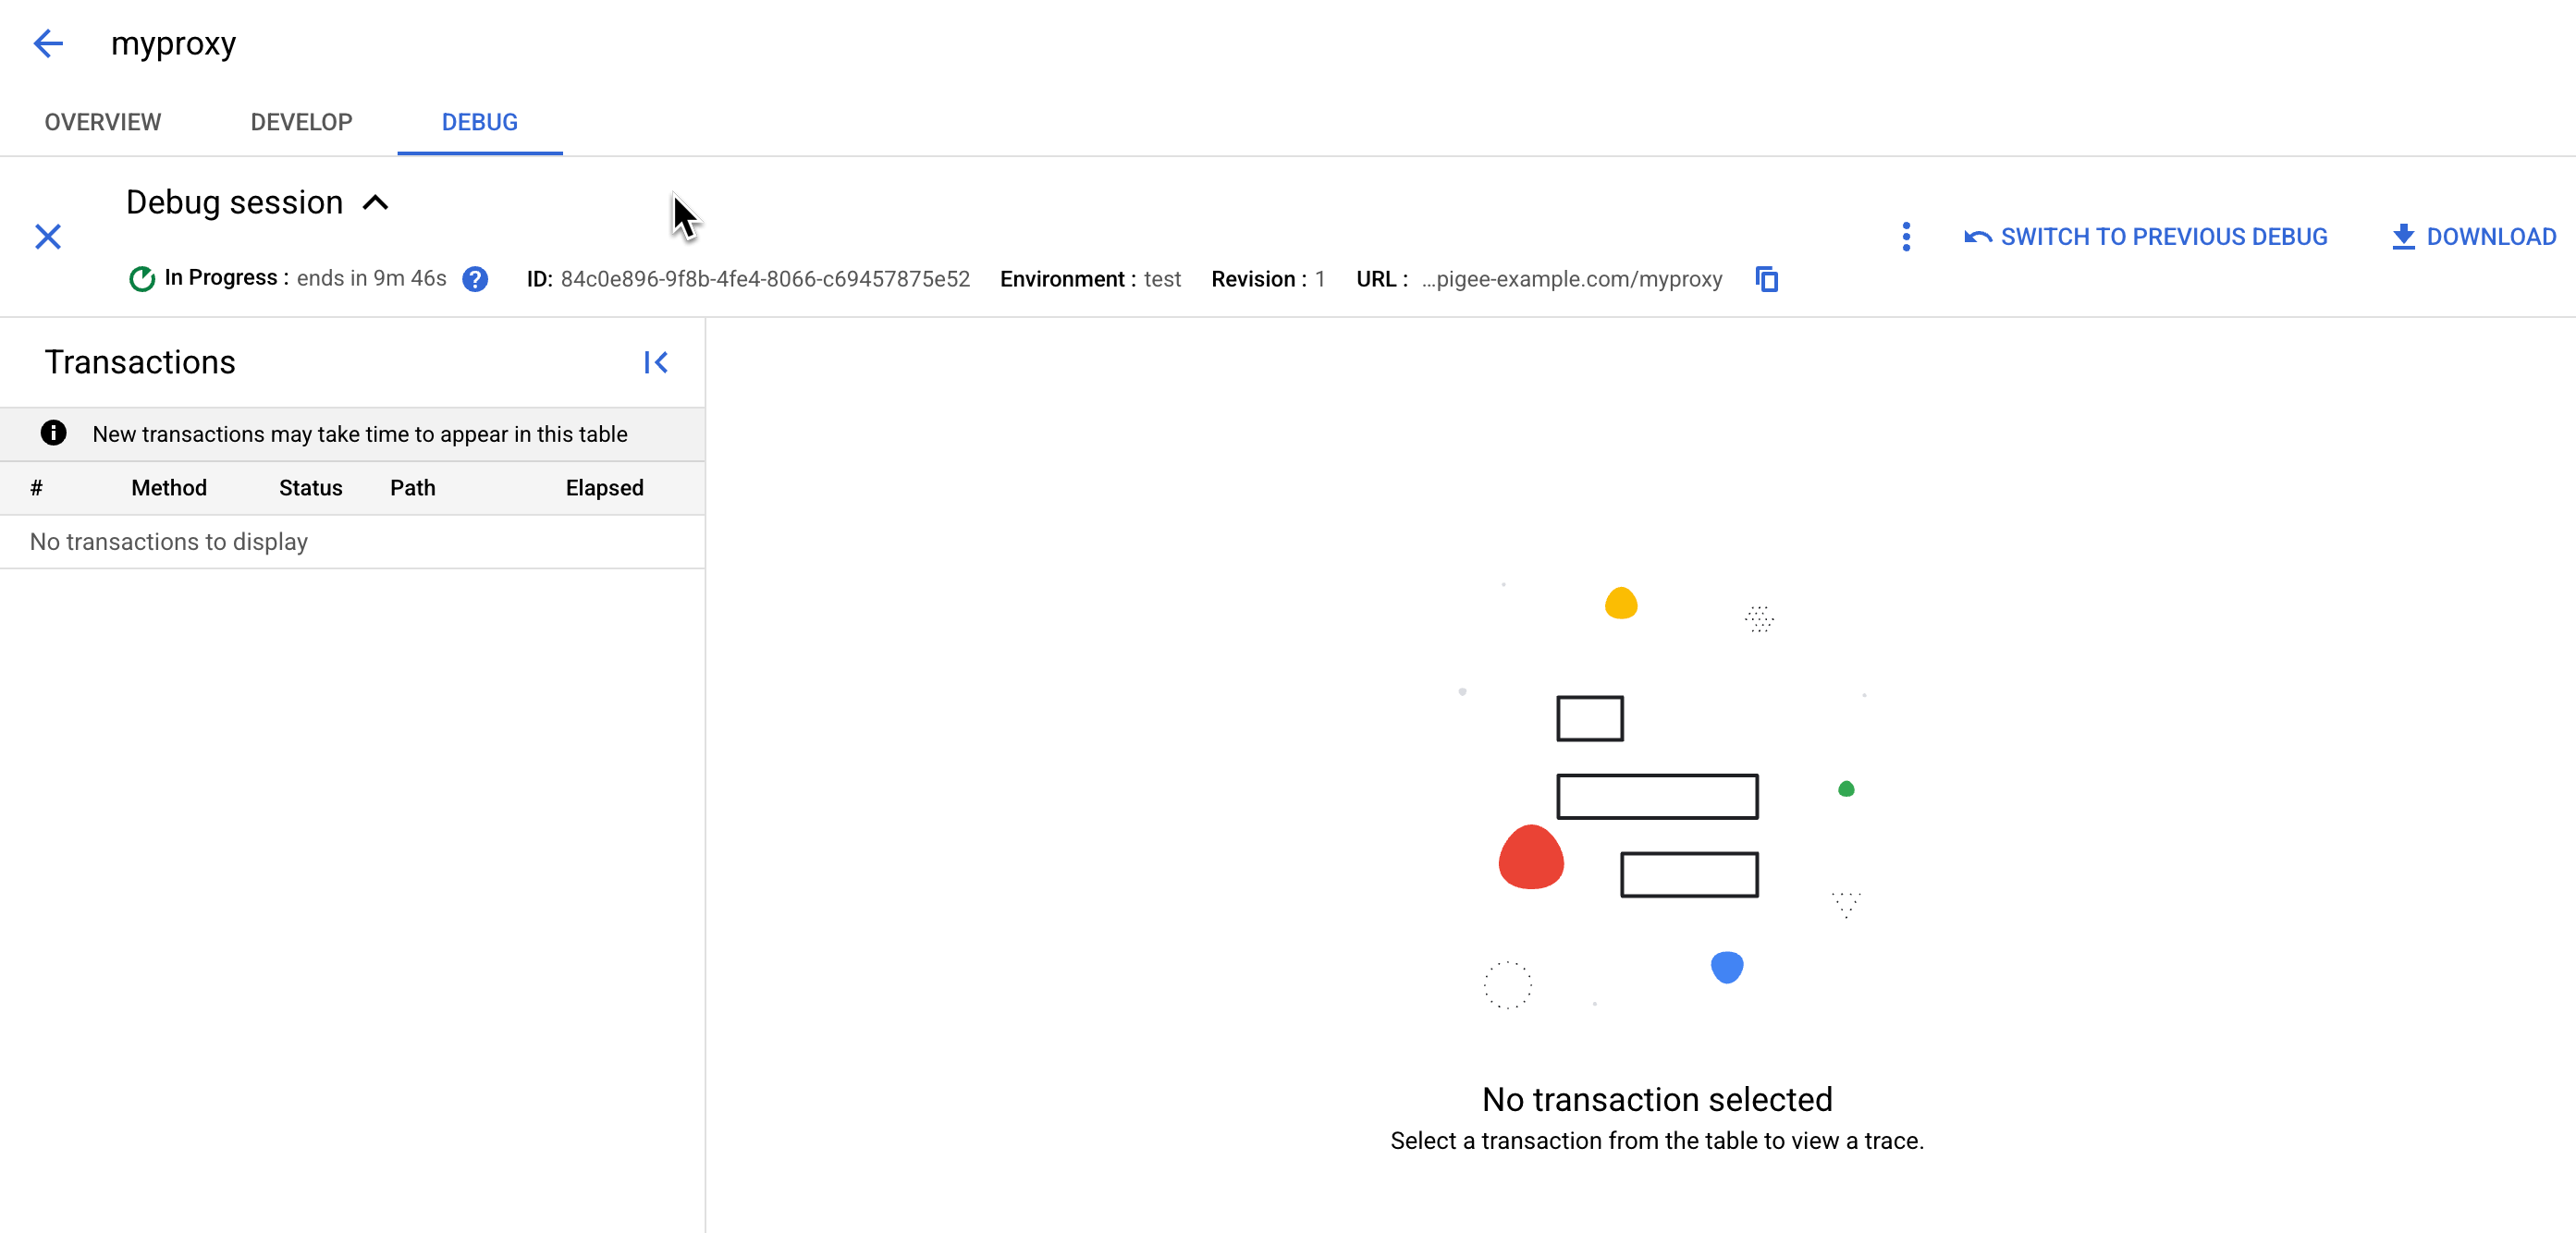
The debug session records requests for 10 minutes or until 15 requests have been captured. You can adjust the 10-minute limit if you create the debug session using the API. The Ends within field displays the amount of time remaining in the session.
You won't see any information displayed in the Debug pane until you send a request to the proxy you are debugging in the selected environment for the debug session.
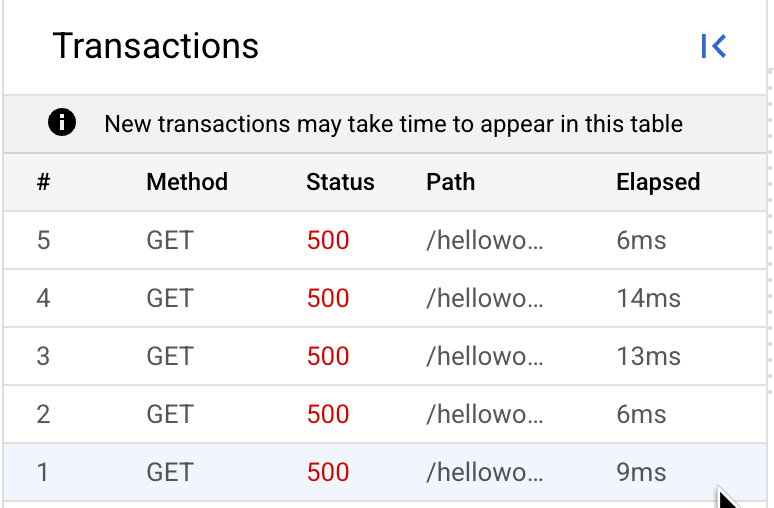
After you send the request, it is displayed in the Transactions list pane. The Transactions list updates every five seconds.
To view or copy transaction output:
- In the Transactions list, click View transaction output. The Transaction output pane displays.
- Click an individual transaction, or click All transactions.
- Click Copy to copy the transaction output to the clipboard.
- Click Close.
Debug v1
To create a debug session in the new Proxy Editor:
- Sign in to the Google Cloud console.
Select Proxy development > API Proxies.
Select the API proxy that you want to debug. This displays the Proxy Editor Overview view.
- Click the Debug tab at the top-left of the window.
- Click the Start Debug Session at the top right of the Debug pane. This
displays the Start debug session dialog.

In the dialog:
- Select the Environment in which you want to run the debug session.
- (Optional) From the Filter drop-down list, select a filter to apply to
all transactions in the debug session you are creating.
The default is
None (All transactions), which includes all transactions in the debug data.For information on using filters, see Using filters in a debug session. For information about the built-in filters, see Using predefined filters.
- Click Start.
The Apigee UI now displays the Debug session in progress view.

The debug session records requests for 10 minutes or until 15 requests have been captured. You can adjust the 10-minute limit if you create the debug session using the API. The Ends within field displays the amount of time remaining in the session.
You won't see any information displayed in the Debug pane until you send a request to the proxy you are debugging in the selected environment. environment for the debug session.
After you send the request, it is displayed at the bottom of the left-hand pane.

Note: During an active debug session, you can start another session in the Apigee UI. To do so, simply click Start Debug Session again.
Classic UI
To create a debug session in the classic Proxy Editor:
- Sign in to the Apigee UI.
- Select API Proxies from the main view.
Select the API proxy that you want to debug.
The Overview tab displays.
- Click the Debug tab in the upper right of the page:

The Debug view displays:

- In the Start a debug session panel:
- From the Env drop-down list, select the environment + revision number of the API proxy you want to debug.
- (Optional) From the Filter drop-down list, select a filter to apply to
all transactions in the debug session you are creating.
The default is
None, which includes all transactions in the debug data.For information on using filters, see Using filters in a debug session. For information about the built-in filters, see Using predefined filters.
- Click Start Debug Session.
The Apigee UI now displays details about the current debug session, including its ID, in the Debug details panel.
Although the UI created the debug session, you still need to send the request before there is any data to collect.
From the Debug details panel, you can do the following:
Icon Function Description 
Download Download the active session's debug data, which you can then view offline. 
Return Return to the previous panel, where you can start another debug session. The current debug session continues until it reaches its timeout or transaction count. 
Delete Delete the currently selected debug session's data. This deletes the session's data, but does not stop the sessions. There is a default timeout limit of 10 minutes for a debug session that you start in the UI (it's different for a session started with the API).
The clock starts running as soon as you click Start Debug Session, so you can choose to wait until after the next step before you click Start Debug Session to maximize the amount of data you gather.
The following example shows the Start a debug session panel:

- In the Send Requests panel:
- In the URL field, enter the endpoint that you want to send a request
to. Optionally, append query string parameters to the URL. You cannot submit requests
other than
GET.How to find the endpoint URL
- Go to Admin > Environments > Groups
- The URL is the Hostname for the respective environment you'd like to run your debug session with.
- Click Send.
Apigee sends a request to the specified URL. Each time you click Send, the Apigee UI logs the request in the Debug details panel.
The following example shows several successful requests (resulting in an HTTP status code of
200):
Click Copy to copy the debug ID for future reference or queries.
In addition, the UI displays debug data in the Transaction Map and Phase Details sections of the Send Requests panel, and populates the Proxy Endpoint, Request Headers, Request Content, and Properties sections, as the following example shows:

For more information about the phases, transaction map, and other sections of the Send Requests view, see How to read a debug.
The Send Requests panel only shows the data for UI-based requests. Note, however, that debug also records data for requests that were not initiated by the UI.
The debug session is now active and records data about all requests (unless they are filtered out). The session will remain active until either the timeout is reached or the number of requests recorded in the session is exceeded.
- In the URL field, enter the endpoint that you want to send a request
to. Optionally, append query string parameters to the URL. You cannot submit requests
other than
- You can create any number of debug sessions in the UI. For more information, see Starting another debug session.
API
To create a debug session using the API, issue a POST request to the following
resource:
https://apigee.googleapis.com/v1/organizations/$ORG/environments/$ENV/apis/$API/revisions/$REV/debugsessions
Optionally, you can:
- Set the length of a debug session (in seconds) by passing the
timeoutproperty as a query parameter or in the request body. If both are specified, thetimeoutvalue specified in the request body takes precedence. - Filter data in a debug session by passing the
filterproperty in the request body.
The following example demonstrates how to create a debug session using the API.
curl "https://apigee.googleapis.com/v1/organizations/ORG/environments/ENV/apis/PROXY/revisions/REV/debugsessions" \
      -X POST \
      -H "Authorization: Bearer $TOKEN"
Where $TOKEN is set to your OAuth 2.0 access token, as described in
Obtaining an OAuth 2.0 access token. For information about the curl options used in this example, see
Using curl. For a description of environment variables you can use, see
Setting
environment variables for Apigee API requests.
The following provides an example of the response:
{
      "name":"56382416-c4ed-4242-6381-591bbf2788cf",
      "validity":300,
      "count":10,
      "tracesize":5120,
      "timeout":"600"
    }
Subsequent requests to your API proxy (until the session duration or maximum number of requests is reached) will be evaluated and potentially stored in the debug session data.
For more information, see the Create debug session API.
Setting the length of a debug session using the API
To set the length of a debug session using the API, include the following as a payload in your debug session creation request:
{
      "timeout":"debug_session_length_in_seconds"
    }
The following example creates a debug session that is just 42 seconds long:
curl https://apigee.googleapis.com/v1/organizations/ORG/environments/ENV/apis/PROXY/revisions/REV/debugsessions"
      -X "POST" \
      -H "Authorization: Bearer $TOKEN" \
      -d ' {
        "timeout":"42"
      } '
You can set a session's timeout in debug session creation requests only; you cannot
change a session's duration after you create the session.
The default value of timeout is 300 (5 minutes). The maximum value is 600 seconds
(10 minutes).
Copy the proxy URL
The proxy URL is used to send requests to your API proxy.
Apigee Cloud console
Debug v2 (new)
To find and copy the proxy URL:
- In the Debug session pane, URL field, click Copy.
- If a Debug session is not open:
In the Google Cloud console, go to the Management > Environments > Environment Groups page.
- The URL is the Hostname for the respective environment you'd like to run your debug session with. Select it and then copy it.
To select a different proxy URL:
- In the Debug session pane, URL field, click Edit.
- Make any desired changes and then click Update.
- If a Debug session is not open:
- Find the proxy URL.
- Click More, and then click Edit.
- Make any desired changes and then click Update.
Debug v1
To find and copy the proxy URL:
- In the Google Cloud console, go to Management > Environments > Environment Groups
- The URL is the Hostname for the respective environment you'd like to run your debug session with. Select it and then copy it.
To edit the proxy URL:
- Find the proxy URL.
- Click More, and then click Edit.
- Make any desired changes and then click Update.
Classic UI
To find and copy the endpoint URL:
- In the Apigee UI, go to Admin > Environments > Groups. You will be redirected to the Google Cloud console, Management > Environments > Environment Groups page.
- The URL is the Hostname for the respective environment you'd like to run your debug session with. Select it and then copy it.
To edit the target URL:
- Find the endpoint URL.
- Click More, and then click Edit.
- Make any desired changes and then click Update.
Starting another debug session in the UI
You can create any number of debug sessions in the UI.
Apigee Cloud console
During an active debug session, you can start another session in the Apigee UI. To do this, click Close in the Debug session pane:
The UI returns to the Start a debug session panel, where you can start a new debug session.
Classic UI
During an active debug session, you can start another session in the Apigee UI. To do this, click the back arrow icon () in the Debug details panel:

The UI returns to the Start a debug session panel, where you can start a new debug session.
When does a debug session end?
You cannot simply stop an active debug session. You can, however, delete an active session's data, as described in Deleting debug session data.
When you create a debug session, two properties determine when it ends:
- timeout: The length of time for which you collect data during a session. The default length depends on how you started the session (through the UI or API). The maximum value is 600 seconds (or 10 minutes).
- count: The maximum number of requests that are recorded in a single session per Message Processor. Because the number of Message Processors in most clusters is variable, the effects of the count can be unpredictable. Apigee does not recommend customizing this setting.
When either the timeout or the count is reached, the debug session for that Message Processor ends.
The following terms are used to describe the state of a debug session:
- active session is a debug session that has not yet reached its timeout or exceeded its count. An active session is still recording request data for requests that are not filtered out.
- completed session is a debug session that has either reached its timeout or exceeded its count; a completed session no longer records data about new requests and its data is deleted within 24 hours of the time at which the session ended.
How to read a debug session
This section provides an overview of a debug session.
See also:
Apigee Cloud console
Debug v2 (new)
The Debug Tool has two main parts, the transaction pane and the phase details:
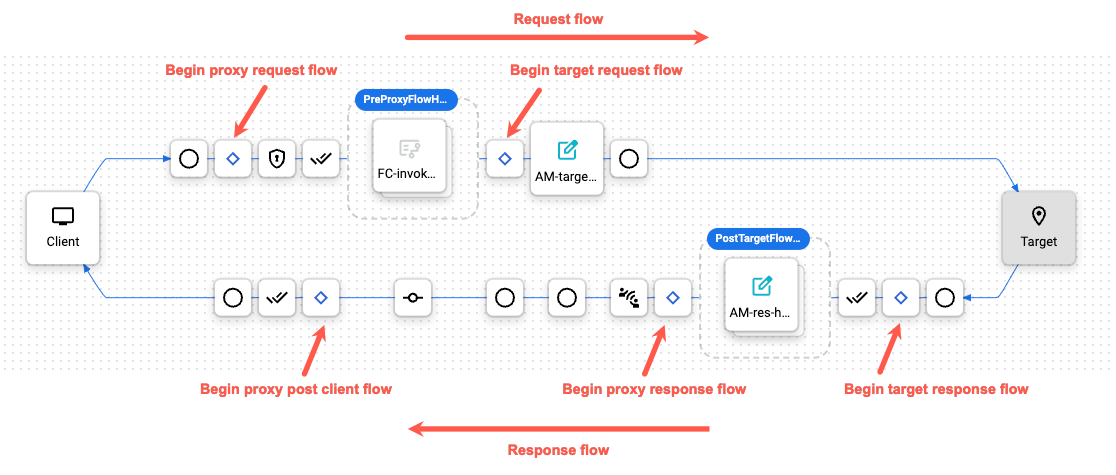
- The transaction pane uses icons to mark each notable step that occurs during an API proxy transaction, including policy execution, conditional steps, and transitions. Hover over any icon to see summary information. The request flow steps appear along the top of the transaction map and response flow steps along the bottom.
- The phase details pane lists information about the proxy's internal processing, including variables that were set or read, request and response headers, and much more. Click any icon to see the phase details for that step.
Debug v1
This version of the debug tool utilizes a Gantt chart to display the steps in the request and response.
Classic UI
The debug tool has two main parts, the transaction map and the phase details:
- The transaction map uses icons to mark each notable step that occurs during an API proxy transaction, including policy execution, conditional steps, and transitions. Hover over any icon to see summary information. The request flow steps appear along the top of the transaction map and response flow steps along the bottom.
- The phase details section of the tool lists information about the proxy's internal processing, including variables that were set or read, request and response headers, and much more. Click any icon to see the phase details for that step.
Transaction pane
The transaction pane shows the steps in the request and response.
Apigee Cloud console
Debug v2 (new)
Here's a sample debug tool transaction pane with the main proxy processing segments labeled:
Debug v1
To view the details of a transaction (request and response) in the Debug view, click the row for the transaction to display a Gantt chart in the right-hand pane that shows the steps in the request and response.

The horizontal axis of the diagram denotes the times at which each step occurred, measured in milliseconds. Each step is represented by a rectangle that extends from the start time to the end time of the step.
You can step through a debug session using the Back and Next buttons at the bottom right of the debug pane. Click:
- Back to move the selected row to the previous step in the chart.
- Next to move the selected row to the next step in the chart.
In the example shown above, the chart displays two policies that are executed in the response:
- ResponsePayload
- Add CORS
You can click on either of these steps to view its details. For example, if you clicked the Add CORS policy, you would see details like the ones shown below displayed next to the Gantt chart.

If you then decided to change something in the policy configuration, you could then click Develop to switch to the Develop view, where you would see the same two policies in the Response PostFlow.

Classic UI
Here's a sample debug tool map with the main proxy processing segments labeled:
Debug tool's transaction map

Transaction pane legend
The following describes the icons in the transaction pane:
Apigee Cloud console
Debug v2 (new)
This section describes the icons in the transaction pane:
Policy icons
Each type of policy has a unique icon. These icons let you see where policies are executed in the proper order and if they are successful or not. You can click a policy icon to see the results of its execution and if they are expected or not. For example, you can see if the message was transformed properly or if it is being cached.
Standard policies augment your APIs to control traffic, enhance performance, enforce security, and increase the utility of your APIs, without requiring you to write code or modify backend services.
Extensible policies let you add custom logic to your API proxies. You can use these policies to add functionality that is not provided by the standard policies.
See Policy reference overview for more information about policies and categories.
To filter the table:
- Select one policy type and/or one policy category.
- Click the Name column header to sort the table by policy name.
- Type a keyword to search for a policy name.
| Icon | Name | Type | Category |
|---|---|---|---|
| manage_search | ParseDialogflowRequest policy | Extensible | Dialog flow |
| chat_add_on | SetDialogflowResponse policy | Extensible | Dialog flow |
| stacked_line_chart | DataCapture policy | Extensible | Extension |
| display_external_input | ExternalCallout policy | Standard | Extension |
| flowsheet | FlowCallout policy | Extensible | Extension |
| automation | IntegrationCallout policy | Extensible | Extension |
| JavaCallout policy | Extensible | Extension | |
| JavaScript policy | Extensible | Extension | |
| add_notes | MessageLogging policy | Extensible | Extension |
| chat_paste_go | PublishMessage policy | Standard | Extension |
| PythonScript policy | Extensible | Extension | |
| integration_instructions | ServiceCallout policy | Extensible | Extension |
| automation | SetIntegrationRequest policy | Extensible | Extension |
| waterfall_chart | TraceCapture policy | Extensible | Extension |
| cloud_done | AccessEntity policy | Extensible | Mediation |
| account_tree | AsseretCondition policy | Standard | Mediation |
| edit_square | AssignMessage policy | Extensible | Mediation |
| login | ExtractVariables policy | Extensible | Mediation |
| GraphQL policy | Standard | Mediation | |
| sync_alt | HTTPModifier policy | Standard | Mediation |
| sync_alt | JSONtoXML policy | Standard | Mediation |
| account_tree | KeyValueMapOperations policy | Extensible | Mediation |
| sync_alt | MonetizationLimitsCheck policy | Extensible | Mediation |
| cloud_done | OASValidation policy | Standard | Mediation |
| report | RaiseFault policy | Standard | Mediation |
| sync_alt | ReadPropertySet policy | Standard | Mediation |
| cloud_done | SOAPMessageValidation policy | Standard | Mediation |
| sync_alt | XMLtoJSON policy | Standard | Mediation |
| cloud_done | XSLTransform policy | Extensible | Mediation |
| lock | AccessControl policy | Standard | Security |
| security | BasicAuthentication policy | Extensible | Security |
| connect_without_contact | CORS policy | Standard | Security |
| lock | DecodeJWS policy | Extensible | Security |
| lock | DecodeJWT policy | Standard | Security |
| passkey | DeleteOAuthV2Info policy | Extensible | Security |
| lock | GenerateSamlAssertion policy | Extensible | Security |
| lock | GenerateJWS policy | Extensible | Security |
| lock | GenerateJWT policy | Extensible | Security |
| passkey | GetOAuthV2Info policy | Extensible | Security |
| lock | HMAC policy | Standard | Security |
| security | JSONThreatProtection policy | Extensible | Security |
| passkey | OAuthV2 policy | Extensible | Security |
| security | RegularExpressionProtection policy | Extensible | Security |
| passkey | RevokeOAuthV2 policy | Extensible | Security |
| passkey | SetOAuthV2Info policy | Extensible | Security |
| lock | ValidateSamlAssertion policy | Extensible | Security |
| key | VerifyAPIKey policy | Extensible | Security |
| passkey | VerifyIAM policy | Extensible | Security |
| lock | VerifyJWS policy | Extensible | Security |
| lock | VerifyJWT policy | Standard | Security |
| security | XMLThreatProtection policy | Extensible | Security |
| cached | InvalidateCache policy | Extensible | Traffic management |
| cached | LookupCache policy | Extensible | Traffic management |
| cached | PopulateCache policy | Extensible | Traffic management |
| bar_chart_4_bars | Quota policy | Extensible | Traffic management |
| repartition | ResetQuota policy | Extensible | Traffic management |
| cached | ResponseCache policy | Extensible | Traffic management |
| emergency_home | SpikeArrest policy | Standard | Traffic management |
Other icons
The following table describes the intent of the other icons you will see in the transaction pane. These icons mark each of the notable processing steps throughout the proxy flow.
To filter the table:
- Select one icon type.
- Click the Name column header to sort the table by icon name.
- Type a keyword to search for an icon name.
| Icon | Name | Type | Description |
|---|---|---|---|
| monitor | Client app | Standard transaction | The client app that sends a request to the ProxyEndpoint of the API proxy. |
| circle | Transitional endpoint | Standard transaction | The circle marks transitional endpoints in the proxy flow. They are there when a request comes in from the client, when the request goes to the target, when the response comes back from the target, and when the response goes back to the client. |
| stat_0 | Flow segment | Standard transaction |
The diamond indicates the beginning of a flow segment in the API proxy flow. Flow segments are: ProxyEndpoint request, TargetEndpoint request, TargetEndpoint response, and ProxyEndpoint response. A segment includes the PreFlow, Conditional Flows, and PostFlow. See Conditional flows for more information. |
| Conditional flow true | Standard transaction |
A conditional flow that evaluates to true (like an
Note that some conditions are Apigee-generated. For example, the following is an expression that Apigee uses to check if an error occurred in the ProxyEndpoint:
|
|
| Conditional flow false | Standard transaction |
A conditional flow that evaluates to false. For an introduction to conditional flows, see Conditional flows. Note that some conditions are Apigee-generated. For example, the following is an expression that Apigee uses to check if an error occurred in the TargetEndpoint:
|
|
| Flow info | Standard transaction | Represents contextual information about the API proxy execution, which varies depending on the point in the flow. This includes details about the proxy configuration, the current execution state (e.g., PreFlow, PostFlow, flow hooks), policy execution details, and variables populated during policy execution, to indicate the specific state of the proxy at that point. | |
| done_all | Flow execution | Standard transaction | Marks the beginning or end of a flow's execution, indicating the timeframe of a distinct flow segment, to visually demarcate flow boundaries and indicate the sequence of flow execution. |
| commit | Flow processing | Standard transaction | Indicates active processing within a flow, representing the period during which policies and flow logic are executed. |
| bar_chart | Apigee analytics captured data | Standard transaction | Indicates that Analytics actions have occurred in the background. |
| location_on | Backend service | Standard transaction | Backend service that receives the request. The backend target called by the API proxy. |
| Disabled | Step status | Appears on a policy icon when a policy is disabled. A policy can be disabled with the public API. See API proxy configuration reference. | |
| Error | Step status | Appears on a policy icon when the policy step condition evaluates to false (see Conditions with flow variables), or on the RaiseFault policy icon whenever a RaiseFault policy executes. | |
| Skipped | Step status | Appears on a policy icon when the policy was not executed because the step condition evaluated to false. See Conditions with flow variables) for more information. |
Debug v1
This version utilizes a Gantt chart to display the steps in the request and response; there is no legend provided.
Classic UI
The following table describes the intent of the icons you will see in the transaction map. These icons mark each of the notable processing steps throughout the proxy flow.
Transaction map icons
 |
The client app that sends a request to the ProxyEndpoint of the API proxy. |
| The circles mark transitional endpoints in the proxy flow. They are there when a request comes in from the client, when the request goes to the target, when the response comes back from the target, and when the response goes back to the client. | |
|
The tall bars indicate the beginning of a flow segment in the API proxy flow. Flow segments are: ProxyEndpoint request, TargetEndpoint request, TargetEndpoint response, and ProxyEndpoint response. A segment includes the PreFlow, Conditional Flows, and PostFlow. See Configuring flows for more information. |
|
|
Indicates that Analytics actions have occurred in the background. |
|
|
A conditional flow that evaluates to true. For an introduction to conditional flows, see Configuring flows. Note that some conditions are Apigee-generated. For example, the following is an expression that Apigee uses to check if an error occurred in the ProxyEndpoint: ((error.state equals PROXY_REQ_FLOW) or (error.state equals
PROXY_RESP_FLOW))
|
|
|
A conditional flow that evaluates to false. For an introduction to conditional flows, see Configuring flows. Note that some conditions are Apigee-generated. For example, the following is an expression that Apigee uses to check if an error occurred in the TargetEndpoint: (((error.state equals TARGET_REQ_FLOW) or (error.state equals
TARGET_RESP_FLOW)) or ((error.state equals REQ_SENT) or (error.state equals
RESP_START)))
|
|
|
|
Policies. Each type of policy has a unique icon. This one is for the AssignMessage policy. These icons let you see where policies are executed in the proper order and if they are successful or not. You can click a policy icon to see the results of its execution and if they are expected or not. For example, you can see if the message was transformed properly or if it is being cached. Properly executing policies are clearly indicated by check-marks. In the case of an error, a red exclamation mark is displayed on the icon. |
 |
The backend target called by the API proxy. |
 |
The time line indicates how long (in milliseconds) that the processing time took to complete. Comparing the elapsed time segments helps you isolate the policies that are taking the longest to execute that are slowing down your API calls. |
| The Epsilon indicates a time-span smaller than a millisecond. | |
|
Disabled. Appears on a policy icon when a policy is disabled. A policy can be disabled with the public API. See API proxy configuration reference. |
|
| Error. Appears on a policy icon when the Policy Step condition evaluates to false (see Flow variables and conditions), or on the RaiseFault policy icon whenever a RaiseFault policy executes. | |
| Skipped. Appears on a policy icon when the policy was not executed because the step condition evaluated to false. See Flow variables and conditions for more information. |
Phase details pane
The phase details pane tells you about the state of your proxy at each processing step.
Apigee Cloud console
Debug v2 (new)
The phase details pane tells you a lot about the state of your proxy at each processing step. Here are some of the details provided. Click any icon in the debug tool to see details for the selected step, or use the > Next or < Back buttons to move from one step to another.
The following table describes the details provided in the phase details pane.
| Phase Detail | Description |
| Variables |
Lists the flow variables that were read and assigned a value by a policy, See also Using flow variables. |
| Request Headers | Lists the HTTP request headers. |
| Request Content | Shows the HTTP request body. |
| Properties | Properties represent the internal state of the API proxy. These are not shown by default. |
| Target Endpoint | Indicates which TargetEndpoint was selected for execution. |
| Response Headers | Lists the HTTP response headers. |
| Response Content | Shows the HTTP response body. |
Debug v1
Click on steps in the Gantt chart to see the phase details or step through a debug session using the > Next or < Back buttons.
Classic UI
The Phase Details part of the tool tells you a lot about the state of your proxy at each processing step. Here are some of the details provided in the Phase Details. Click any icon in the debug tool to see details for the selected step, or use the Next/Back buttons to move from one step to another.
| Phase Detail | Description |
| Proxy Endpoint | Indicates which ProxyEndpoint flow was selected for execution. An API proxy can have multiple named proxy endpoints. |
| Variables |
Lists the flow variables that were read and assigned a value by a policy, See also Using flow variables. Note:
|
| Request Headers | Lists the HTTP request headers. |
| Request Content | Shows the HTTP request body. |
| Properties | Properties represent the internal state of the API proxy. These are not shown by default. |
| Target Endpoint | Indicates which TargetEndpoint was selected for execution. |
| Response Headers | Lists the HTTP response headers. |
| Response Content | Shows the HTTP response body. |
| PostClientFlow | Shows information about the PostClientFlow, which executes after the request is returned to the requesting client app. Only MessageLogging policies can be attached to the PostClientFlow. The PostClientFlow is currently used primarily for measuring the time interval between the start and end timestamps for the response message. |
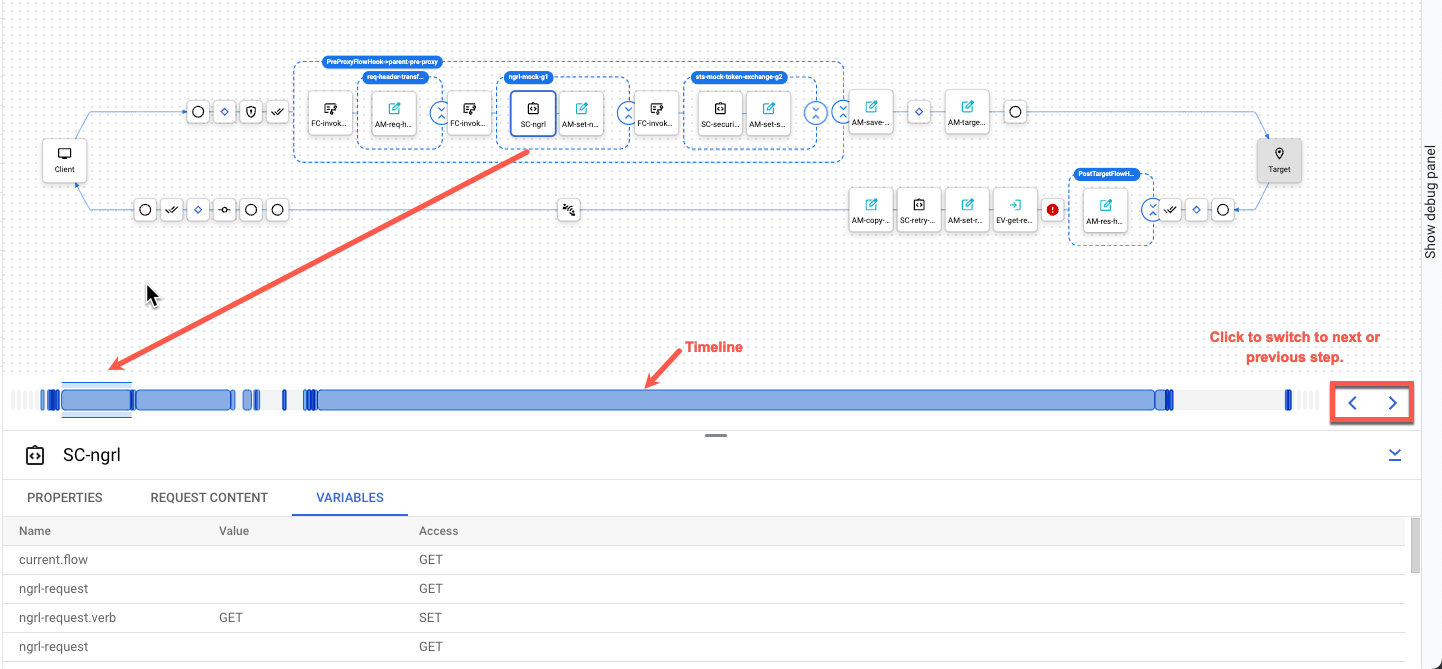
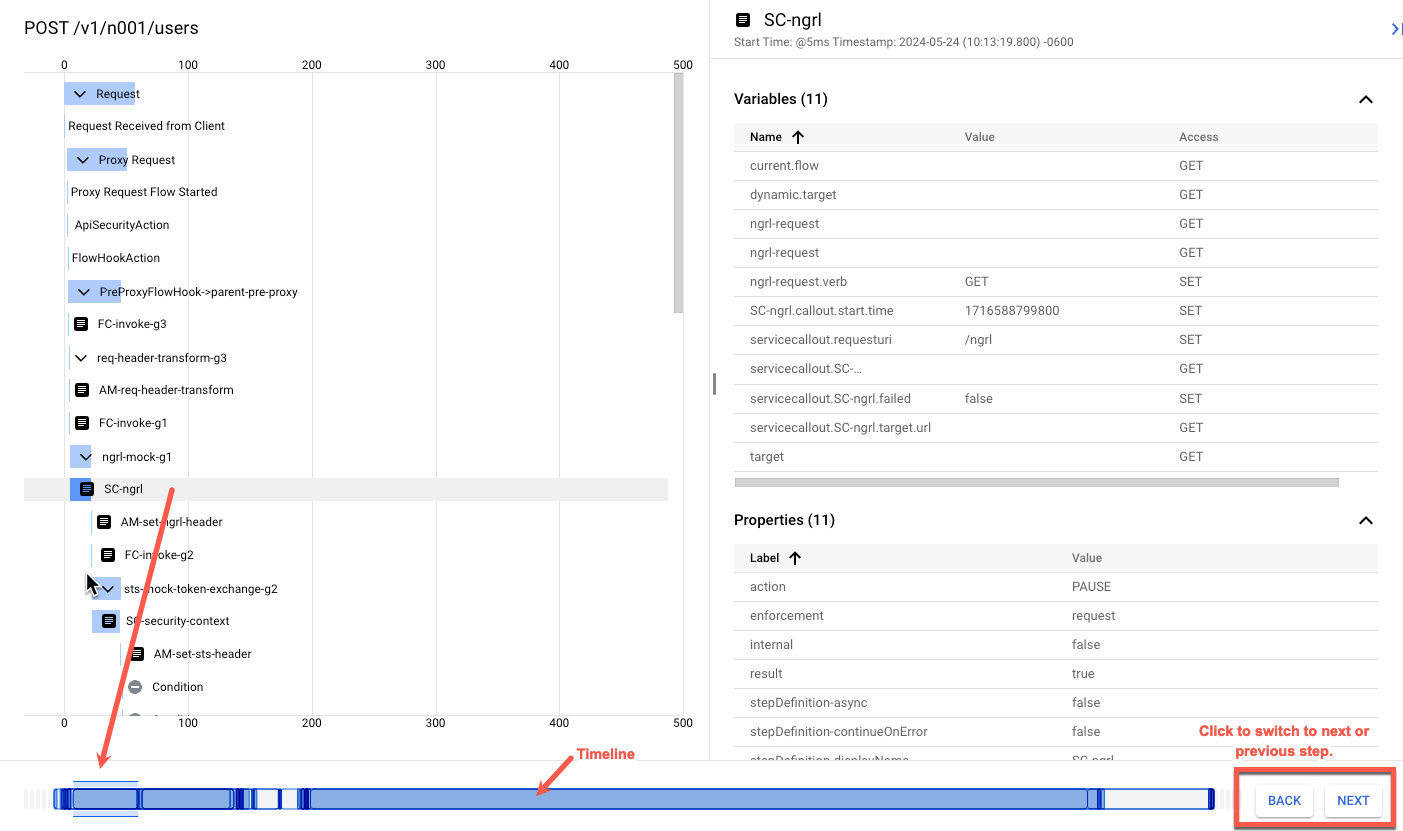
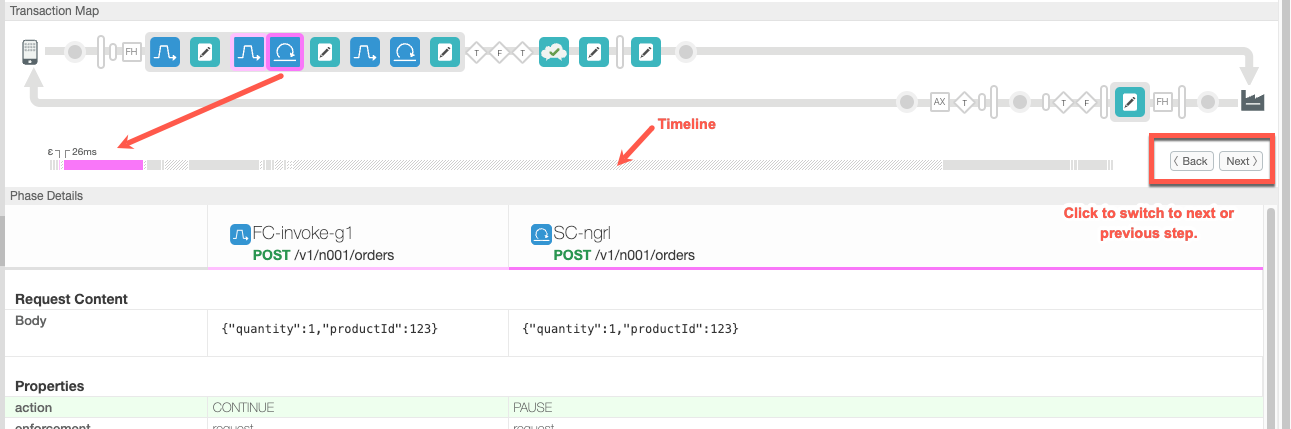
Timeline
The timeline indicates how long (in milliseconds) that the processing time took to complete. Comparing the elapsed time segments helps you isolate the policies that are taking the longest to execute that are slowing down your API calls.
The Epsilon indicates a time-span smaller than a millisecond.
Apigee Cloud console
Debug v2 (new)
Debug v1
Classic UI
Expanding and collapsing groups
This section describes how to expand and collapse groups in the Transaction pane.
Apigee Cloud console
Debug v2 (new)
Transaction steps, for both request and response, are grouped by how they were configured previously on the Develop tab; by shared flow. For example: pre-proxy, post-proxy, pre-target, and post-target.
Each grouping clearly displays relevant policies, conditions, shared flows, and flow information.
Shared flows are grouped and collapsed by default.
The following actions are available in the Transaction pane:
| Item | Name | Description |
|---|---|---|
|
Expand all Collapse all |
Expand or collapse all groups. |
|
|
Expand Collapse |
Expand or collapse a group. |
See also:
Debug v1
Expanding and collapsing groups is not available in this version.
Classic UI
Expanding and collapsing groups is not available in this version.
Search
Search allows you to find a word or phrase in the request or response.
Apigee Cloud console
Debug v2 (new)
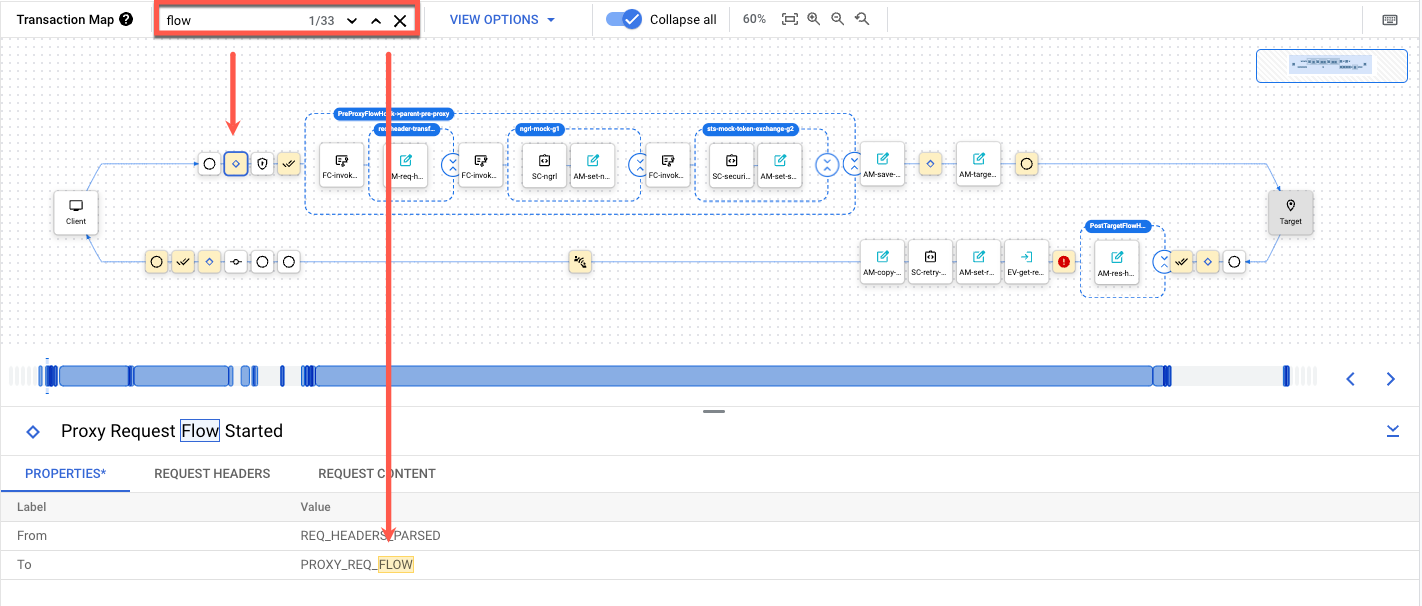
Search allows you to find a word or phrase in the request or response.
Note the following:
- Search is case-insensitive
- Search applies to a single transaction; that is, it does not search across all transactions in the entire debug session.
- Search expands collapsed sections, but does not show information on nodes that are filtered out by View Options selections.
To search:
- Type text in the search box.
-
Press Enter.
The search results are highlighted in the Transaction pane and in the Phase Details pane.
- Click keyboard_arrow_up Back or keyboard_arrow_down Next to move to the next or previous step.
Debug v1
Search is not available in this version.
Classic UI
Search is not available in this version.
Zoom
Zoom allows you to control the view of the Transaction pane.
Apigee Cloud console
Debug v2 (new)
Zoom controls the view of the Transaction pane as follows:
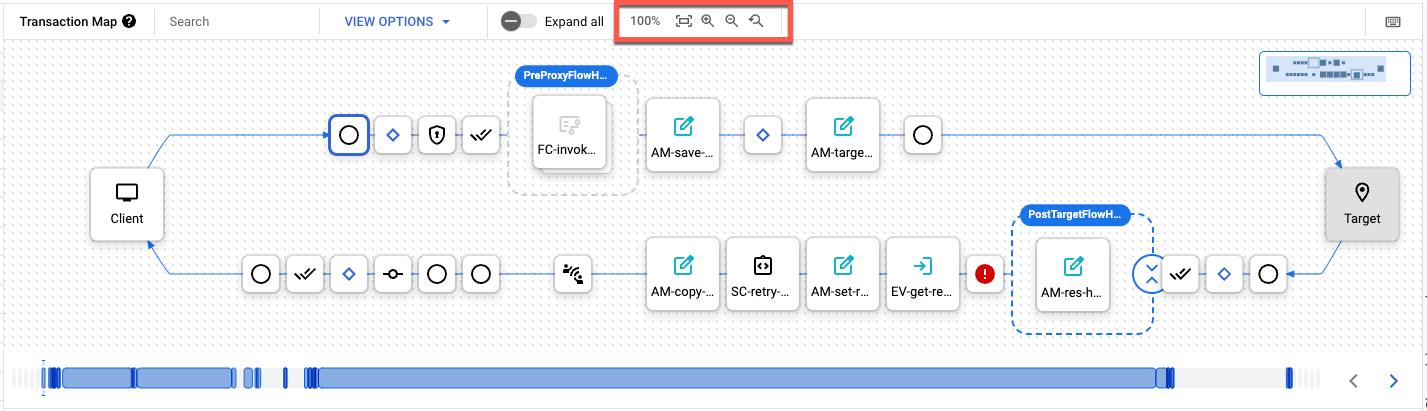
| Icon | Description |
|---|---|
| 100% | Current zoom level. Defaults to 100%. |
| fit_screen | Fit to screen |
| zoom_in | Zoom in |
| zoom_out | Zoom out |
| youtube_searched_for | Zoom reset |
Debug v1
Zoom is not available in this version.
Classic UI
Zoom is not available in this version.
Debugging with the debug tool
The debug lets you see a lot of internal details about an API proxy. For example:
- You can see at a glance which policies are executing correctly or failing.
- Let's say you noticed through one of the Analytics dashboards that one of your APIs is experiencing an unusual decrease in performance. Now, you can use Debug to help identify where the bottleneck is occurring. Debug gives the time, in milliseconds, that it takes for each processing step to complete. If you find one step is taking too long, you can take corrective action.
- You can check headers that are being sent to the backend, view variables set by policies, and so on.
- By verifying the base path, you can ensure that a policy is routing the message to the correct server.
Filtering data in a debug session
When you create a debug session, you can add a filter to that session so that Apigee returns only the data you want. A filter is a conditional statement that Apigee evaluates against request and response messages to determine if its debug data should be included in the debug session. For example, you can filter out all requests with an HTTP response code that is less than 599 or compare values in the request against custom variables.
Note the following:
- Requests that are not included in a debug session because they are filtered out do not count towards the maximum number of transactions in the debug session.
- Apigee does not support adding filters in the query string.
- You cannot add a filter to a debug session once the session has started. To add a filter, you must create a debug session.
Using filters
Use a filter when creating a debug session using the Apigee UI or API, as described in the following sections.
Apigee Cloud console
When you create a debug session in the UI, in the Filters drop-down list you can choose a predefined filter to apply in the Start a debug session panel or choose Custom Filter and build your own with the filter syntax.
Classic UI
When you create a debug session in the UI, in the Filters drop-down list you can choose a predefined filter to apply in the Start a debug session panel or choose Custom Filter and build your own with the filter syntax.
API
To create a debug session with a filter using the API, include the following as a payload in your debug session creation request:
{
  "filter":"filter_body"
}
For information on constructing filters, see Filter syntax.
The following example creates a debug session that includes only transactions in which
header A equals 42 and header B equals 43, or
the fault code is ExpectedEOF:
curl -H "Authorization: Bearer $TOKEN" -X "POST"
  https://apigee.googleapis.com/v1/organizations/ORG/environments/ENV/apis/PROXY/revisions/REV/debugsessions
  -d ' {
    "filter":"(request.header.A == '42' && request.header.B == '43') || fault.code == 'jsonparser.ExpectedEOF'"
  } '
You can define a filter in debug session creation requests only; you cannot add a filter to an existing debug session, and you cannot remove a filter from an active debug session.
Filter syntax
Filters support the same syntax that is used by Apigee conditions, as described in Conditions reference. This includes:
- Grouping
- Logical AND (
&&) and OR (|") - Path expressions
- Operators and Operands
- Literals
(
null,true, andfalse)
In addition, filters can access all flow variables that are described in the Flow variables reference as well as custom variables. The following examples show just some of the possible flow variables that you can use in filters:
# Response codes:
  response.status.code <= 599
  response.status.code >=301 && response.status.code <=420

# Requests/responses:
  request.verb == "GET"
  request.header.A == 'B' || request.queryparam.X == 'Y'

# Query parameters:
  request.queryparam.myparam == 'fish'
  (request.queryparam.param1 == 'X' || request.queryparam.param2 == 'Y') && request.queryparam.param3 == 'Z'

# Faults:
  fault.code != 'messaging.runtime.RouteFailed'
  fault.name == 'IPDeniedAccess'
For information about using custom variables, see How to use custom attributes in Apigee in the Apigee Community.
Predefined UI filters
The Apigee UI provides a set of common filters so that you don't have to write your own custom filters. The predefined filters are as summarized in the following table.
| Filter Name | Description |
|---|---|
Response Time Greater Than |
Checks for latency issues where:
For example: target.duration > 420 && client.duration > 1000 For more information, see
|
Response Code |
Checks if the HTTP response code matches the specified value; for example: response.status.code <= 599 |
Header |
Checks if the specified request header is equal to the specified value; for example: request.header.cache-control.1 == "16544" |
Path |
Checks if the request matches the specified path. You can use wildcard matching in your value; for example: request.path == /myproxy/customer/4* |
Query Param |
Checks if the specified request query parameter is equal to the specified value; for example: request.queryparam.lang == "language:en-us" |
Custom |
Lets you insert your own expressions. You can use any objects in the Flow variables reference and the syntax in Conditions reference. In addition, you can use custom variables. For more information about creating custom filters, see Filter syntax. |
Viewing debug sessions
Apigee saves debug session data for 24 hours. You cannot configure this value; after 24 hours, the data will no longer be available. Before that time, you can view the debug sessions.
View recent debug sessions using the Apigee UI or API, as described in the following sections.
Apigee Cloud console
Debug v2 (new)
To view debug sessions using the Google Cloud console
-
In the Google Cloud console, go to the Proxy development > API Proxies page.
- Click the proxy that you want to debug.
- Click the Debug tab.
- The Recent debug sessions displays a list of debug sessions that are available.
Click the link for the session you want to view.
Debug v1
To view debug sessions using the New Proxy Editor:
- Sign in to the Google Cloud console.
Select Proxy development > API Proxies.
- Select the proxy that you want to debug.
- Click the Debug tab.
- The Recent debug sessions displays a list of debug sessions that are available.
Click the link for the session you want to view.
Classic UI
To view debug sessions using the Classic Proxy Editor:
- Sign in to the Apigee UI.
- Select API Proxies from the main view.
- Select the proxy that you want to debug.
- Click the Debug tab in the upper right of the Deployments view.
- In the Recent debug sessions panel:
- From the Env drop-down list, select the environment of the API proxy whose debug session you want to view.
- From the Rev drop-down list, select the revision number of the API proxy whose debug session you want to view.
The Apigee UI displays a list of debug sessions that are available.
Click the link for the session you want to view.
The Apigee UI loads the debug session and populates the Send Requests panel with the debug data.
API
Using the API, you can:
- View all debug sessions
- View all transactions for a debug session
- View transaction data for a debug session
View all debug sessions using the API
To view all recent debug sessions defined for an API proxy revision in an environment, issue a GET request to the following resource:
https://apigee.googleapis.com/v1/organizations/org/environments/env/apis/api/revisions/rev/debugsessions
Optionally, you can specify one of the following query parameters to control the amount of data returned:
- pageSize: Maximum number of debug sessions to list. The page size defaults to 25.
- pageToken: Page token, returned from a previous call, that you can use to retrieve the next page.
The following example demonstrates how to view the debug sessions for revision 1 of the
helloworld API proxy in the test environment.
curl "https://apigee.googleapis.com/v1/organizations/myorg/environments/test/apis/helloworld/revisions/1/debugsessions" \
-X GET \
-H "Authorization: Bearer $TOKEN"
Where $TOKEN is set to your OAuth 2.0 access token, as described in
Obtaining an OAuth 2.0 access token. For information about the curl options used in this example, see
Using curl. For a description of environment variables you can use, see
Setting
environment variables for Apigee API requests.
The response includes a sessions object that contains a list of currently
active debug sessions, as shown in the following example:
{
"sessions": [
{
"id": "a423ac73-0902-4cfa-4242-87a353a84d87",
"timestamp_ms": 1566330186000
},
{
"id": "f1eccbbe-1fa6-2424-83e4-3d063b47728a",
"timestamp_ms": 1566330286000
}
]
}
Only debug sessions that contain at least one transaction are included in the response; debug sessions that do not have any transactions are not included in this list.
For more information, see List Debug sessions API.
View all transactions for a debug session using the API
To view a list of transactions for a debug session, issue a GET request to the following resource:
https://apigee.googleapis.com/v1/organizations/org/environments/env/apis/api/revisions/rev/debugsessions/debugsession/data
Where debugsession is the ID of a debug session returned when you view debug sessions.
The following example demonstrates how to view the transactions for a debug session for revision 1 of the helloworld API in the test environment.
curl "https://apigee.googleapis.com/v1/organizations/myorg/environments/test/apis/helloworld/revisions/1/debugsessions/a423ac73-0902-4cfa-4242-87a353a84d87/data" \
-X GET \
-H "Authorization: Bearer $TOKEN"
Where $TOKEN is set to your OAuth 2.0 access token, as described in
Obtaining an OAuth 2.0 access token. For information about the curl options used in this example, see
Using curl. For a description of environment variables you can use, see
Setting
environment variables for Apigee API requests.
The response includes an array of transaction IDs, as shown in the following example:
[
"myorg-test-ver-5qxdb-64",
"myorg-test-ver-5qxdb-65",
"myorg-test-ver-5qxdb-66",
"myorg-test-ver-5qxdb-67",
"myorg-test-ver-5qxdb-68",
"myorg-test-ver-5qxdb-69",
"myorg-test-ver-5qxdb-70",
"myorg-test-ver-5qxdb-71",
"myorg-test-ver-5qxdb-72"
]
For more information, see List debug session data API.
Viewing transaction data for a debug session using the API
To view transaction data for a debug session, issue a GET request to the following resource:
https://apigee.googleapis.com/v1/organizations/{org}/environments/{env}/apis/{api}/revisions/{rev}/debugsessions/{debugsession}/data/{transactionId}Where debugsession is the ID of a debug session returned when you view debug sessions and transactionId is the transaction ID returned when you View a list of transactions for a debug session.
The transaction data saved during a debug session is formatted in JSON. You can load this data in the Offline Debug tool.
The following example demonstrates how to download the transaction data for a debug session for revision 1 of the helloworld API in the test environment.
curl "https://apigee.googleapis.com/v1/organizations/myorg/environments/test/apis/helloworld/revisions/1/debugsessions/a423ac73-0902-4cfa-4242-87a353a84d87/data/myorg-test-ver-5qxdb-64" \
-X GET \
-H "Authorization: Bearer $TOKEN"
Where $TOKEN is set to your OAuth 2.0 access token, as described in
Obtaining an OAuth 2.0 access token. For information about the curl options used in this example, see
Using curl. For a description of environment variables you can use, see
Setting
environment variables for Apigee API requests.
The response consists of a JSON payload that contains the data for the specified transaction, as described in Download data structure.
Debug data contains all information about the request and response for each part of the flow in a proprietary JSON format. You can save this data and later use it in the Offline Debug tool.
If no requests were added to the session before it ended, then the response will look like the following:
[]
For more information, see Get debug session data API.
Selecting view options in the UI
This section describes how to select view options to filter what is shown in the UI.
Apigee Cloud console
To choose the view options for the debug session, select or clear options from the View options pane. These view options are persisted across debug session for each user.

| Option | Description |
|---|---|
| Show disabled policies | Show any disabled policies. A policy can be disabled with the public API. See API proxy configuration reference. |
| Show skipped policies | Show any policies that were skipped. A skipped policy occurs when policy was not executed because the step condition evaluated to false. See Conditions with flow variables for more information. |
| Show all FlowInfos | Represent transitions within a flow segment. |
| Show all flow conditions | Represent the conditions that were evaluated for each flow. |
Classic UI
To choose the view options for the debug session, select or clear options from the View options pane:

| Option | Description |
|---|---|
| Show Disabled Policies | Show any disabled policies. A policy can be disabled with the public API. See API proxy configuration reference. |
| Show Skipped Phases | Show any phases that were skipped. A skipped phase occurs when policy was not executed because the step condition evaluated to false. See Conditions with flow variables for more information. |
| Show all FlowInfos | Represent transitions within a flow segment. |
| Automatically Compare Selected Phase | Compares the selected phase to the previous one. Turn this off to see only the selected phase. |
| Show Variables | Show or hide variables that were read and/or assigned a value. |
| Show Properties | Properties represent the internal state of the API proxy. (Hidden by default.) |
Share a debug session
You can share a debug session with other users who have access to your organization and the necessary permissions. To do so, just send them the URL displayed in your browser when you are viewing the debug session. The link is only valid for 24 hours after the debug session is created.
Downloading debug session data
You can download a file of raw debug results for offline viewing. The downloaded file shows the complete details of the debug session including the contents of all headers, variables, and policies.
Debug session data is available to download or view in the UI for 24 hours only. After that point, Apigee deletes the session data.
To view downloaded debug session data, use the Offline Debug tool.
Apigee Cloud console
Debug v2 (new)
To download the current debug session in the Google Cloud console, click Download in the Debug view.
Debug v1
To download the current debug session, click Download Session in the left-hand pane of the Debug view.

Note that a debug session is deleted within 24 hours of the time it is completed, so if you want to view the debug session after that time, you need to download it before then.
Classic UI
To download the current debug session's data using the classic Proxy Editor:
- Active session: Click the Download icon (
)
in the Debug details panel.
- Previous session: Click the name of the session in the Recent debug
sessions panel, as described in Viewing debug sessions. Then
click in the Debug details panel.
API
To view the IDs of all transactions for the current debug session using the Apigee API, enter the following command:
    curl -H "Authorization: Bearer $(gcloud auth print-access-token)" \
         https://apigee.googleapis.com/v1/organizations/ORG/environments/ENV/apis/PROXY/revisions/REV/debugsessions/SESSION_ID/data
where SESSION_ID is the ID for the debug session you want to download.
See List the transaction IDs from a debug session.
To get the debug data for a transaction using the Apigee API, enter the following command:
    curl -H "Authorization: Bearer $(gcloud auth print-access-token)" \
    https://apigee.googleapis.com/v1/organizations/ORG/environments/ENV/apis/PROXY/revisions/REV/debugsessions/SESSION_ID/data/TRANSACTION_ID
Download data structure
The download structure of the debug session data is different for the Apigee UI and Apigee API.
Apigee Cloud console
When you download data using the Apigee UI, the data structure:
- Includes all transactions in the entire session
- Stores transactions in a
Messagesarray - Includes metadata about the session (as a
DebugSessionobject)
Classic UI
When you download data using the Apigee UI, the data structure:
- Includes all transactions in the entire session
- Stores transactions in a
Messagesarray - Includes metadata about the session (as a
DebugSessionobject)
API
You cannot use the Apigee API to view an entire sessions' data at one time; you can only use the API to view individual transaction data, as described in Viewing debug sessions.
For example:
{
"completed": true,
"point": [
  ...
...
}
Download data examples
The following example highlights a DebugSession metadata object in the downloaded
data. This object is following by the Messages array that contains the transactions
in the session.
{
  "DebugSession": {
    "Retrieved": "2019-06-08T13:08:13.395Z",
    "Organization": "myorg",
    "Environment": "prod",
    "API": "myproxy",
    "Revision": "1",
    "SessionId": "a2a271aa-4242-4ac6-97cb-aec8dcb115a9"
  },
  "Messages": [
    {
      "completed": true,
      "point": [
        {
          "id": "Paused"
        },
        {
          "id": "Resumed"
        },
        {
          "id": "StateChange",
          "results": [
            {
              "ActionResult": "DebugInfo",
              "properties": {
                "property": [
                  {
                    "name": "To",
                    "value": "REQ_HEADERS_PARSED"
                  },
                  {
                    "name": "From",
                    "value": "REQ_START"
                  }
                ]
              },
              "timestamp": "8-6-19 13:08:37:718"
            },
            {
              "ActionResult": "RequestMessage",
              "headers": [
                {
                  "name": "accept",
                  "value": "*/*"
                },
                {
                  "name": "accept-encoding",
                  "value": "gzip,gzip,deflate,br"
                },
                {
                  "name": "content-length",
                  "value": "0"
                },
                {
                  "name": "host",
                  "value": "myorg.example.domain.net"
                },
                {
                  "name": "user-agent",
                  "value": "Google-Apigee"
                },
                {
                  "name": "x-b3-sampled",
                  "value": "0"
                },
                {
                  "name": "x-b3-spanid",
                  "value": "d4ee579206759662"
                },
                {
                  "name": "x-b3-traceid",
                  "value": "adc1e171777c237dd4ee579206759662"
                },
                {
                  "name": "x-forwarded-for",
                  "value": "66.102.8.98"
                },
                {
                  "name": "x-forwarded-proto",
                  "value": "https"
                },
                {
                  "name": "x-request-id",
                  "value": "54e05cba-4242-4490-4242-60c45c156f90"
                }
              ],
              "uRI": "/myproxy",
              "verb": "GET"
            }
          ]
        },
        {
          "id": "FlowInfo",
          "results": [
            {
              "ActionResult": "DebugInfo",
              "properties": {
                "property": [
                  {
                    "name": "environment.name",
                    "value": "prod"
                  },
                  {
                    "name": "environment.qualifiedname",
                    "value": "myorg__prod"
                  },
                  {
                    "name": "environment.orgname",
                    "value": "myorg"
                  }
                ]
              },
              "timestamp": "8-6-19 13:08:37:718"
            }
          ]
        },
        {
          "id": "FlowInfo",
          "results": [
            {
              "ActionResult": "DebugInfo",
              "properties": {
                "property": [
                  {
                    "name": "organization.name",
                    "value": "myorg"
                  }
                ]
              },
              "timestamp": "8-6-19 13:08:37:718"
            }
          ]
        },
        {
          "id": "FlowInfo",
          "results": [
            {
              "ActionResult": "DebugInfo",
              "properties": {
                "property": [
                  {
                    "name": "apiproxy.qualifiedname",
                    "value": "myproxy__1"
                  },
                  {
                    "name": "apiproxy.basepath",
                    "value": "/"
                  },
                  {
                    "name": "apiproxy.revision",
                    "value": "1"
                  },
                  {
                    "name": "apiproxy.name",
                    "value": "myproxy"
                  }
                ]
              },
              "timestamp": "8-6-19 13:08:37:718"
            }
          ]
        },
        ...
      ...
    }
  ]
}
If the debug session did not include any requests, then the Message array is empty,
as the following example shows:
{
  "DebugSession": {
    "Retrieved": "2019-06-08T13:08:13.395Z",
    "Organization": "myorg",
    "Environment": "prod",
    "API": "myproxy",
    "Revision": "1",
    "SessionId": "a2a271aa-4242-4ac6-97cb-aec8dcb115a9"
  },
"Messages": []
}
Deleting data for a debug session
Delete data for a debug session using the Apigee UI or API, as described in the following sections.
Apigee Cloud console
Debug v2 (new)
To delete a debug session in the Google Cloud console:
- On the Debug tab, click the row for the session you want to delete.
- In the Debug session pane, click Delete.
Debug v1
To delete a debug session:
- Select the row for the session you want to delete.
- Click the three-dot menu at the end of the row and select Delete.
Classic UI
Click ![]() in the Debug details panel for the debug session.
in the Debug details panel for the debug session.
API
To delete all debug session data using the API, issue a DELETE request to the following resource:
https://apigee.googleapis.com/v1/organizations/org/environments/env/apis/api/revisions/rev/debugsessions/debugsession/data
Where debugsession is the ID of a debug session returned when you view debug sessions.
The following example demonstrates how to delete debug session data for revision 1 of the helloworld API in the test environment.
curl "https://apigee.googleapis.com/v1/organizations/myorg/environments/test/apis/helloworld/revisions/1/debugsessions/a423ac73-0902-4cfa-4242-87a353a84d87/data" \
      -X DELETE \
      -H "Authorization: Bearer $TOKEN"
Where $TOKEN is set to your OAuth 2.0 access token, as described in
Obtaining an OAuth 2.0 access token. For information about the curl options used in this example, see
Using curl. For a description of environment variables you can use, see
Setting
environment variables for Apigee API requests.
If successful, the response body will be empty.
Debug session data is persisted for 24 hours only. If you do not explicitly delete it before that time, then Apigee deletes it for you.