Mit Apigee können Sie Benachrichtigungen erstellen, die durch bestimmte API-Trafficmuster ausgelöst werden, beispielsweise wenn die Fehlerrate einer API einen vordefinierten Schwellenwert erreicht. AAPI Ops erweitert diese Funktion durch Anomaliebenachrichtigungen, die ausgelöst werden, wenn Apigee ungewöhnliche API-Trafficdaten erkennt. Der Vorteil von Anomaliebenachrichtigungen ist, dass Sie die genauen Bedingungen nicht für jede Anomalie selbst definieren müssen. AAPI Ops ermittelt mithilfe von statistischen Methoden die passenden Anomaliebedingungen und aktualisiert diese fortlaufend auf Grundlage aktueller Trafficdaten.
Mit der Anomalieerkennung lassen Sie Apigee Traffic- und Leistungsprobleme erkennen, anstatt die Bedingungen für Benachrichtigungen selbst zu bestimmen.
Wenn AAPI Ops eine Anomalie erkennt, wird das Ereignis im Dashboard für Anomalieereignisse angezeigt. Es wird jedoch nicht automatisch eine Benachrichtigung über die Anomalie verschickt. Wenn Sie eine Anomalie im Dashboard untersuchen und sich dafür entscheiden, über ähnliche Ereignisse in der Zukunft benachrichtigt werden zu wollen, können Sie eine Anomaliewarnung erstellen und eine Benachrichtigung einrichten, die Sie immer informiert, sobald die Anomalie erkannt wird.
Prüfen Sie vor dem Erstellen einer Anomaliebenachrichtigung, ob Ihnen die erforderlichen Rollen für AAPI Ops zugewiesen wurden.
So erstellen Sie eine Anomaliebenachrichtigung im Dashboard für Benachrichtigungsrichtlinien:
Hinweis: Öffnen Sie das Dashboard "Benachrichtigungsrichtlinie erstellen" in einem neuen Tab, wenn Sie die folgenden Schritte ausführen möchten.
Klicken Sie auf BEDINGUNG HINZUFÜGEN. Dadurch wird eine neue Seite geöffnet, auf der Sie die Benachrichtigungsbedingung hinzufügen können.
Optional: Fügen Sie im Feld Unbenannte Bedingung einen Titel für die Bedingung hinzu. In diesem Beispiel bleibt das Feld leer. In diesem Fall erhält die Bedingung einen Standardtitel.
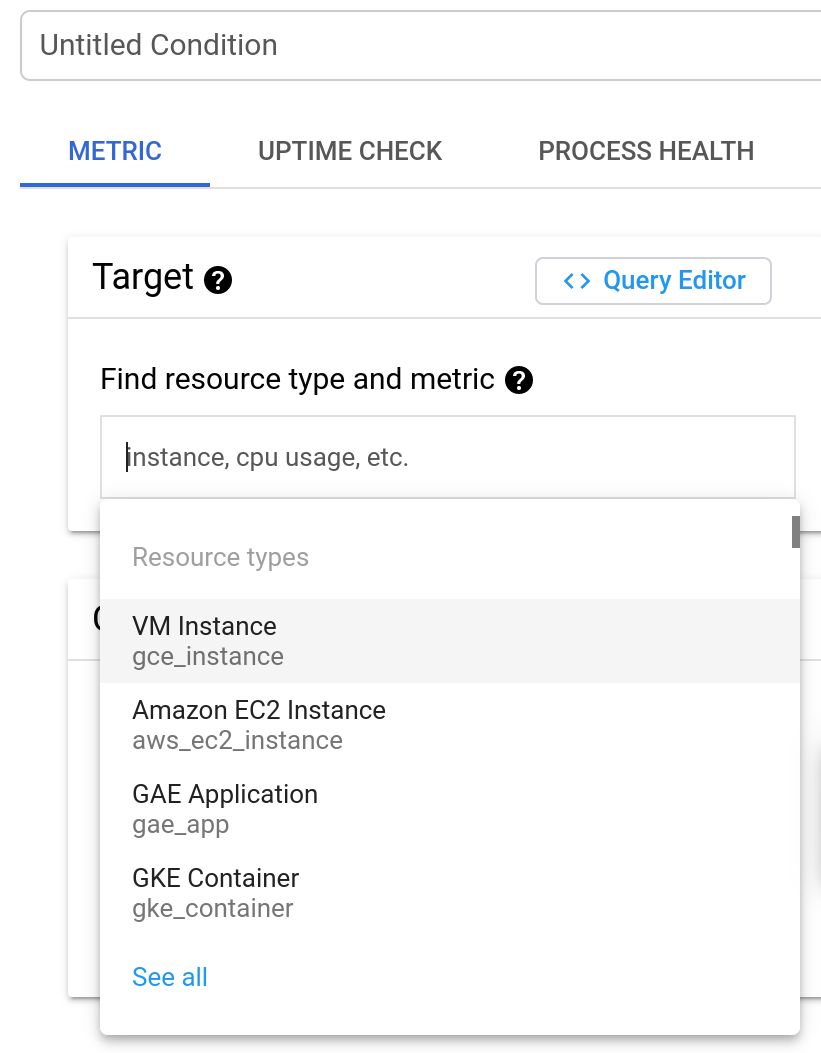
Geben Sie im Feld Ressourcentyp und Messwert suchen den folgenden Wert ein:
anomaly
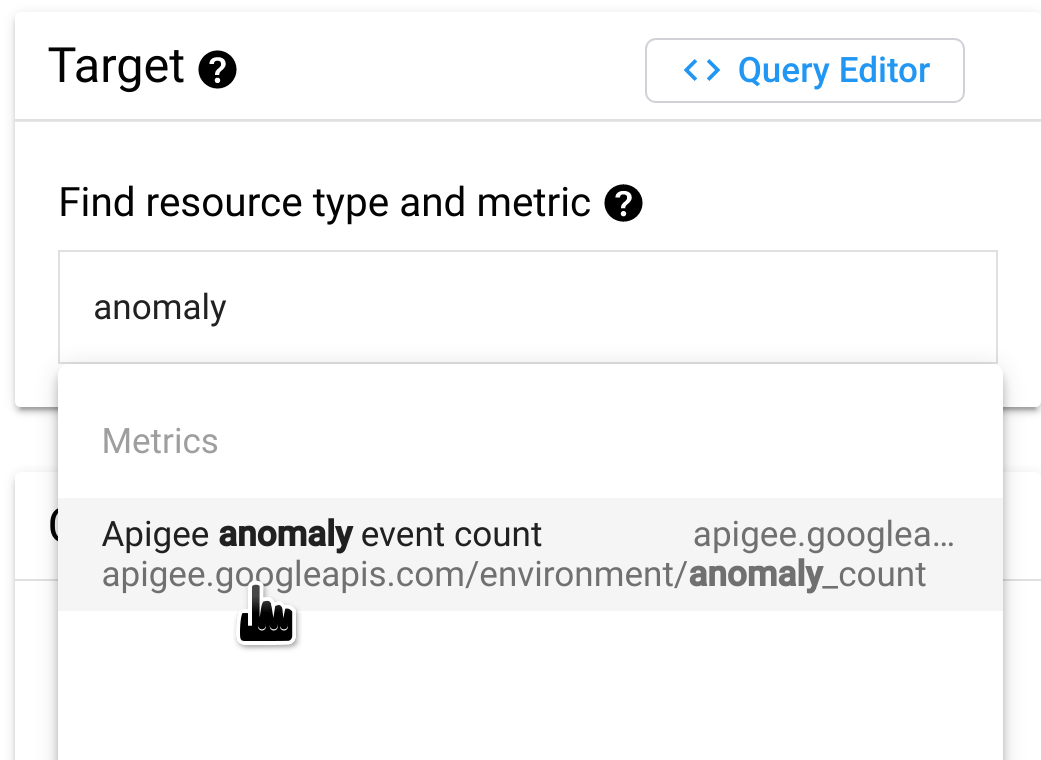
Wählen Sie dann Anzahl von Apigee-Anomalieereignissen aus.
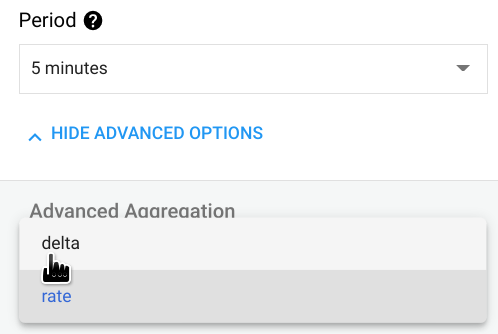
Klicken Sie auf ERWEITERTE EINSTELLUNGEN ANZEIGEN und wählen Sie im Bereich Erweiterte Aggregation im Feld Aligner die Option Delta aus. Hier wird angegeben, wie die Daten über jeden Zeitraum aggregiert werden, den Sie im Feld Zeitraum festlegen können.
Bei der Einstellung delta entspricht der aggregierte Wert dem endgültigen Datenwert im Zeitraum abzüglich des ursprünglichen Datenwerts.
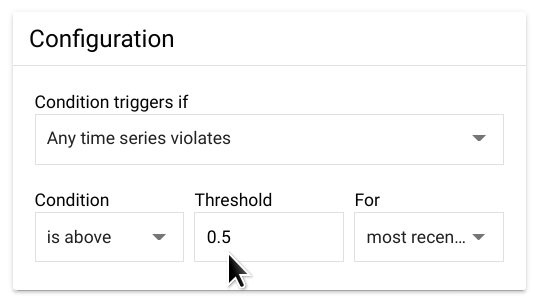
Legen Sie im Bereich Konfiguration unter Grenzwert den Wert 0,5 fest.
(Jede Zahl zwischen 0 und 1 kann als Grenzwert festgelegt werden.)
Mit diesem Wert überschreitet eine einzelne Anomalie den Grenzwert und löst die Benachrichtigung aus.
Klicken Sie auf Hinzufügen. Dadurch gelangen Sie zurück zur Seite Benachrichtigungsrichtlinie erstellen, auf der Sie die Bedingung sehen können, die Sie gerade erstellt haben.
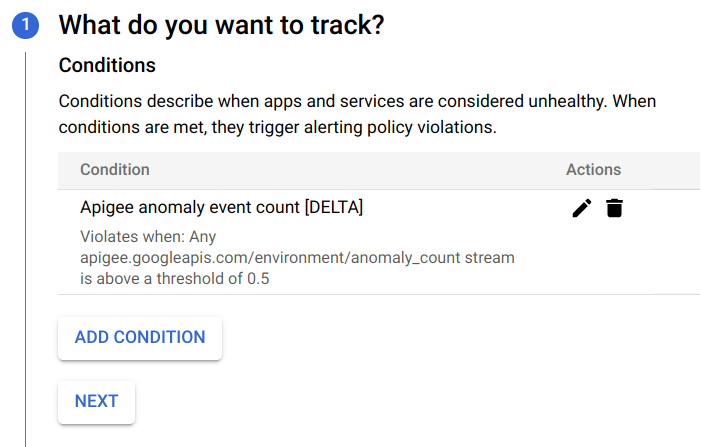
An dieser Stelle haben Sie folgende Möglichkeiten:
Klicken Sie auf Bedingung hinzufügen, um eine weitere Bedingung für die Benachrichtigung zu erstellen.
Klicken Sie auf Weiter, um mit dem nächsten Schritt fortzufahren, in dem Sie eine Benachrichtigung über die Warnung erstellen können, wie im nächsten Abschnitt beschrieben.
Wenn Sie keine Benachrichtigung erstellen möchten, klicken Sie zweimal auf Weiter, ohne etwas einzugeben. Die Schritte 2 und 3 werden dann übersprungen.
Klicken Sie auf Speichern, um die Benachrichtigung zu speichern.
Benachrichtigung für eine Warnung erstellen
Wenn Sie bei einem Vorfall sofort benachrichtigt werden möchten, können Sie eine Benachrichtigung für die Warnung erstellen. Wenn die Warnung ausgelöst wird, sendet Apigee Ihnen eine Benachrichtigung. Sie können einen der folgenden Kanäle auswählen, um die Benachrichtigung zu erhalten:
E-Mail
PagerDuty
Slack
Webhooks
So erstellen Sie eine Benachrichtigung:
Wenn Sie gerade die Warnung erstellt haben (wie im vorherigen Beispiel gezeigt) und die Seite Benachrichtigungsrichtlinie erstellen gerade aufrufen, fahren Sie mit dem nächsten Schritt fort.
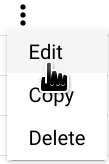
Öffnen Sie andernfalls den Bereich Richtlinien im Cloud Console-Benachrichtigungs-Dashboard, klicken Sie in der Zeile für die erstellte Warnung auf die drei Punkte am Ende der Zeile und wählen Sie Bearbeiten aus.
Dadurch wird das Dashboard Benachrichtigungsrichtlinie bearbeiten geöffnet:
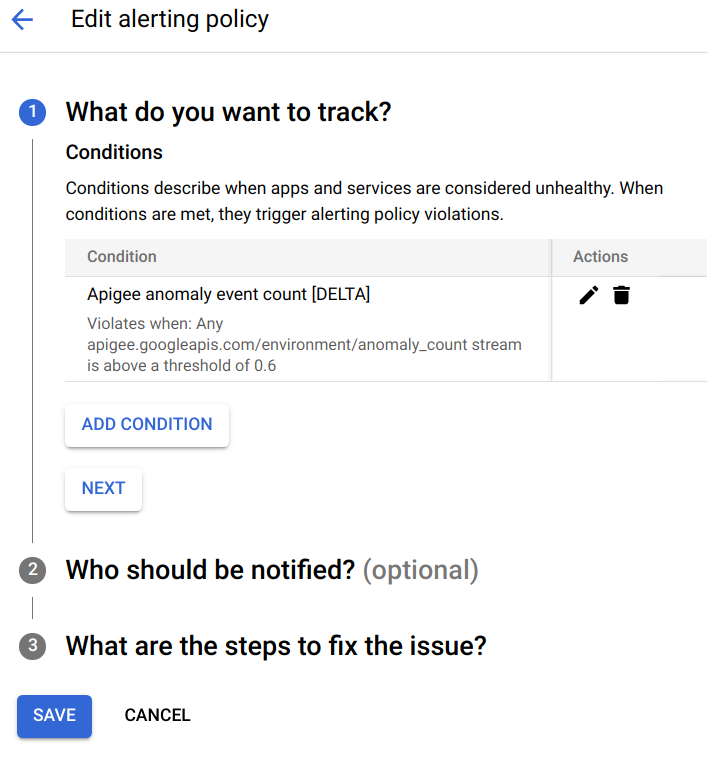
Klicken Sie im Bereich Was möchten Sie erfassen? auf Weiter.
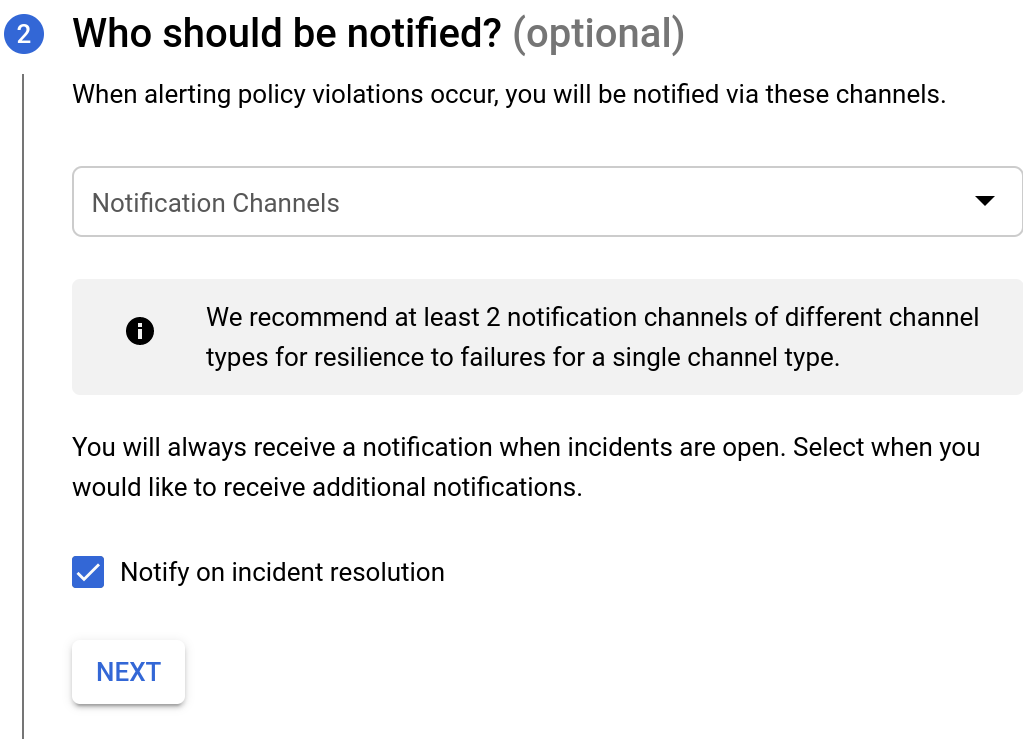
Wählen Sie im Abschnitt Wer soll benachrichtigt werden die Option Benachrichtigungskanäle aus. Sie können aus vorhandenen Kanälen für den Empfang von Benachrichtigungen auswählen.
Wenn Sie einen neuen Benachrichtigungskanal erstellen möchten, wählen Sie Benachrichtigungskanäle verwalten aus. Dadurch wird das Dashboard „Benachrichtigungskanäle“ in der Cloud Console geöffnet, in dem Sie Kanäle hinzufügen können. Weitere Informationen finden Sie unter Benachrichtigungskanäle erstellen und verwalten.
Tippen Sie auf Weiter. Die unten angezeigten Optionen werden angezeigt.
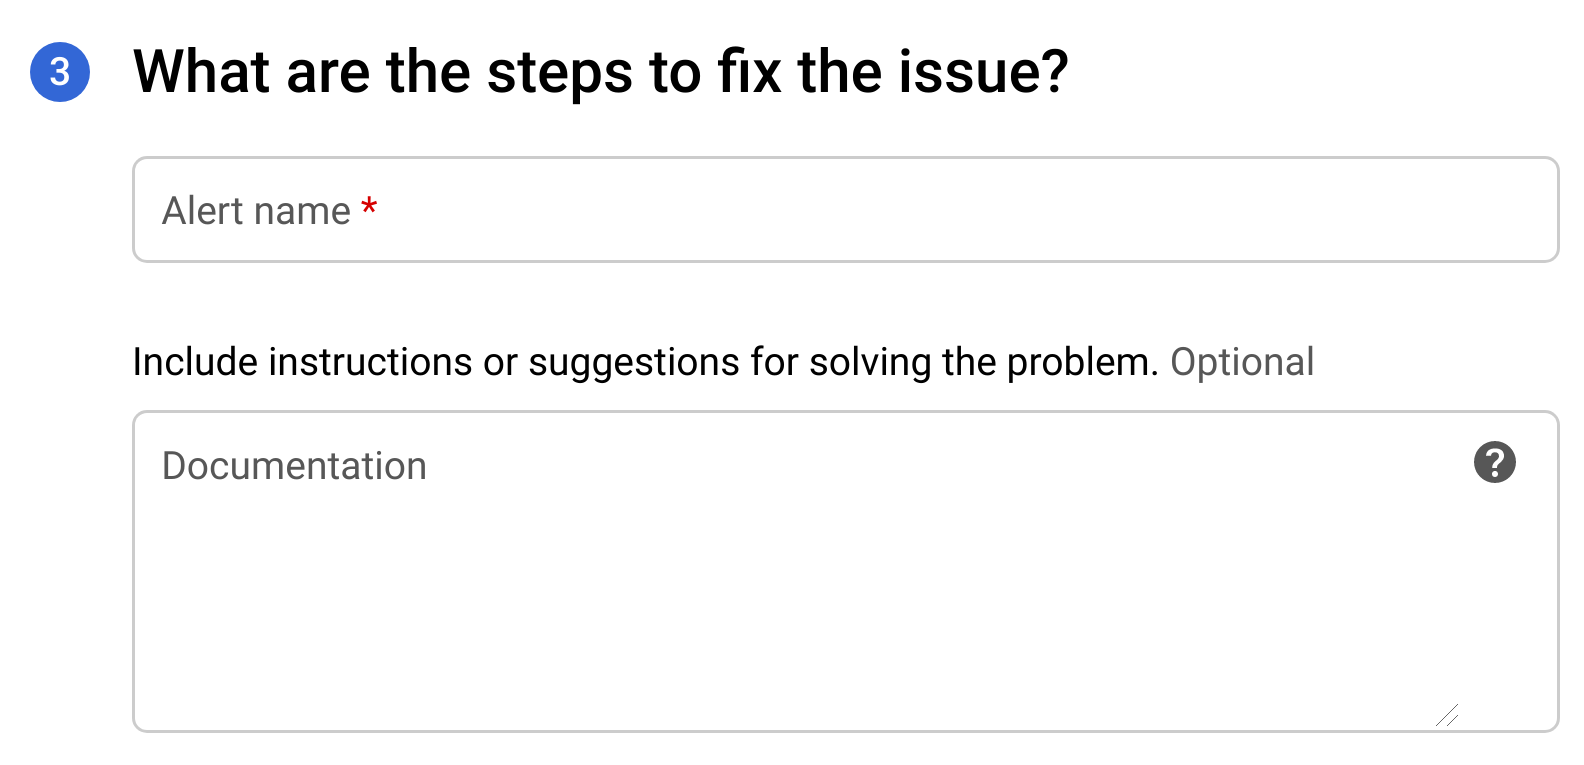
Geben Sie im Feld Name der Benachrichtigung einen Namen ein.
Geben Sie im Feld Dokumentation die URL für eine Webseite ein, die Informationen darüber enthält, wie das zu behebende Problem behoben werden kann. Die URL wird in die Benachrichtigung eingefügt.
Klicken Sie auf Speichern, um die Benachrichtigung zu erstellen.
Wenn eine Warnung ausgelöst wird, erhalten Sie eine Benachrichtigung mit einer Zusammenfassung des Vorfalls und der Zeit des Auftretens. Die Benachrichtigung enthält außerdem zwei Links, mit denen Sie den Vorfalls prüfen können:
Vorfall ansehen: Sehen Sie sich den Vorfall in der Cloud Console an.
In Apigee ansehen: Zeigen Sie eine Zeitachse des API-Traffics und die zugehörigen Datentabellen im API Monitoring-Prüfungs-Dashboard an.
[[["Leicht verständlich","easyToUnderstand","thumb-up"],["Mein Problem wurde gelöst","solvedMyProblem","thumb-up"],["Sonstiges","otherUp","thumb-up"]],[["Schwer verständlich","hardToUnderstand","thumb-down"],["Informationen oder Beispielcode falsch","incorrectInformationOrSampleCode","thumb-down"],["Benötigte Informationen/Beispiele nicht gefunden","missingTheInformationSamplesINeed","thumb-down"],["Problem mit der Übersetzung","translationIssue","thumb-down"],["Sonstiges","otherDown","thumb-down"]],["Zuletzt aktualisiert: 2025-09-03 (UTC)."],[[["\u003cp\u003eApigee offers anomaly alerts that automatically detect unusual API traffic patterns without requiring users to manually define specific anomaly conditions.\u003c/p\u003e\n"],["\u003cp\u003eAnomaly detection events are displayed on the Anomaly Events dashboard, and users can choose to set up anomaly alerts with notifications for similar future events.\u003c/p\u003e\n"],["\u003cp\u003eTo create an anomaly alert, users must navigate to the "Create alerting policy" dashboard in the Google Cloud console and select "Apigee anomaly event count" as the metric.\u003c/p\u003e\n"],["\u003cp\u003eUsers can configure notifications for anomaly alerts to be sent via email, PagerDuty, Slack, or webhooks when an anomaly is detected.\u003c/p\u003e\n"],["\u003cp\u003eWhen an anomaly alert is triggered, notifications include links to view the incident in the Cloud console and an API traffic timeline graph in the API Monitoring Investigate dashboard.\u003c/p\u003e\n"]]],[],null,["# Creating anomaly alerts\n\n*This page\napplies to **Apigee** and **Apigee hybrid**.*\n\n\n*View [Apigee Edge](https://docs.apigee.com/api-platform/get-started/what-apigee-edge) documentation.*\n\nApigee enables you to create alerts that are triggered by specific API traffic patterns---\nfor example, when an API's\nerror rate reaches a predetermined threshold. AAPI Ops extends this capability with\n*anomaly alerts*, which are triggered whenever Apigee detects unusual API traffic\ndata. The advantage of anomaly alerts is that you don't have to define the exact conditions\nfor each anomaly yourself. AAPI Ops determines the right anomaly conditions using statistical methods,\nand constantly updates them based on recent traffic data.\nUsing anomaly detection, you let Apigee detect traffic and performance issues, rather than\npredetermining the alert conditions yourself.\n| **Important:** \"Anomaly Detection\" describes the Advanced API Operations Anomaly Detection functionality, which is available in the Classic Apigee UI. This functionality is comparable to the \"Operations Anomalies\" functionality in [Apigee UI in Cloud console](https://console.cloud.google.com/apigee). Both are available at this time. See [Operations Anomalies overview](/apigee/docs/api-platform/analytics/operations-anomalies-overview) for information on the Operations Anomalies functionality.\n\nWhen AAPI-Ops detects an anomaly, it displays the event in the Anomaly Events\ndashboard. However, it doesn't automatically raise an alert for\nthe anomaly. If you examine an anomaly in the dashboard and decide you want to be alerted about\nsimilar event in future, you can create an anomaly alert\nand set up a notification, which sends you a message whenever the anomaly is detected.\n\nBefore creating an anomaly alert, make sure you have been assigned the\n[required roles](/apigee/docs/aapi-ops#required-roles-for-aapi-ops)\nfor AAPI Ops.\n\nTo create an anomaly alert in the Alerting policy dashboard, do the following:\n\n1. Open the\n [Create alerting policy](https://console.cloud.google.com/monitoring/alerting/policies/create?) dashboard in the Google Cloud console.\n\n **Note:** Open the Create alerting policy dashboard in a new tab if you want to follow\n the steps below.\n2. Click **ADD CONDITION** . This opens a new window where you can add the alert condition.\n\n\n3. Optional: Add a title for the condition in the **Untitled Condition** field. We'll leave it blank for this example, in which case the condition is given a default title.\n4. In the **Find resource type and metric** field, type\n\n ```\n anomaly\n ```\n\n and then select **Apigee anomaly event count**.\n5. Click **SHOW ADVANCED SETTINGS** and in the **Advanced Aggregation** pane,\n select **delta** in the **Aligner** field. This specifies how the data is\n aggregated over each time period, which you can set in the **Period** field.\n With the **delta** setting, the aggregated value equals the\n final data value in the time period minus the initial data value.\n\n6. In the **Configuration** pane, set the **Threshold** to **0.5**.\n (Any number between 0 and 1 will work for the threshold.)\n With this value, a single anomaly exceeds the threshold and triggers the alert.\n\n7. Click **Add** . This takes you back to the **Create alerting policy** page\n where you can see the condition you just created.\n\nAt this point you can choose to either:\n\n- Click **ADD Condition** to create another condition for the alert, or\n- Click **NEXT** to go to the next step, where you will have the option to [create a notification for the\n alert](#creating-a-notification-for-an-alert), as described in the next section.\n\nIf you don't want to create a notification, click **NEXT** twice\nwithout entering anything to bypass Steps 2 and 3.\n\nClick **SAVE** to save the alert.\n\nCreating a notification for an alert\n------------------------------------\n\nIf you want to be notified immediately when an incident occurs, you can create\na notification for the alert. When the alert is triggered, Apigee sends you\na notification. You can choose any of the following channels to receive\nthe notification:\n\n- Email\n- PagerDuty\n- Slack\n- Webhooks\n\n| **Note:** Currently, to receive a notification, you must add **org** to the **Group by** field in the alert. This requirement will be removed in a future release.\n\nTo create a notification for an alert:\n\n1. If you just created the alert (as shown in the\n preceding example) and are currently viewing the\n **Create alerting policy** dashboard, skip to the next step.\n\n Otherwise, open the\n [**Policies** pane](https://console.cloud.google.com/monitoring/alerting/policies) in the Cloud console Alerting dashboard, and in\n the row for the alert you created, click the three dots icon at the end\n of the row and select **Edit**.\n\n This opens the **Edit alerting policy** dashboard:\n2. In the **What do you want to track?** section, click **NEXT**.\n\n3. In the **Who should be notified** section, select\n **Notification Channels**, where you can choose from existing channels for receiving\n notifications.\n\n If you want to create a new\n notification channel, select **MANAGE NOTIFICATION CHANNELS** . This\n opens the Notification channels dashboard in the Cloud console, where you can\n add channels. See\n [Create and manage notification channels](https://cloud.google.com/monitoring/support/notification-options) for more details.\n4. Click **NEXT**. This displays the options shown below.\n\n5. In the **Alert name** field, enter a name for the alert.\n6. In the **Documentation** field, enter the URL for a web page that provides information on how to fix the issue that caused the alert. The URL will be included in the notification.\n7. Click **Save** to create the alert.\n\nWhen an alert is triggered, you will receive a notification\nproviding a summary of the incident and when it occurred. The notification\nalso contains two links to help you investigate the incident:\n\n- **VIEW INCIDENT**: View the incident in the Cloud console.\n- **VIEW IN APIGEE** : View a timeline graph of API traffic and related data tables in the [API Monitoring Investigate dashboard](/apigee/docs/api-monitoring/investigate)."]]