Diese Seite gilt für Apigee und Apigee Hybrid.
Apigee Edge-Dokumentation aufrufen

Lerninhalte
In dieser Anleitung lernen Sie Folgendes:
- Header und den Inhalt der Antwortnachricht anzeigen lassen
- Fehlermeldungen anzeigen lassen
Voraussetzungen
Führen Sie vor Beginn dieser Anleitung die folgenden Schritte aus:
- Achten Sie darauf, dass
curlauf Ihrem Computer installiert ist, um API-Aufrufe über die Befehlszeile auszuführen. - Führen Sie die Schritte unter Vorbereitung aus.
- Fügen Sie Ihrem Proxy eine SpikeArrest-Richtlinie hinzu. Die SpikeArrest-Richtlinie ist eine Richtlinie, die die Anzahl der Anfragen begrenzt, die an Ihren API-Proxy gesendet werden können. Ihr Proxy muss mindestens eine Richtlinie haben.
Nachrichtendaten anzeigen
In der Debugging-Ansicht im Apigee-Proxy-Editor können Sie Header, Variablen, Objekte und andere Details wie die Antwortzeit in der API-Proxy-Anforderung und dem Antwortablauf einsehen. Die Debugging-Ansicht zeigt auch an, wie sich eine Anfrage oder Antwort ändert, während sie von einem API-Proxy verarbeitet wird. Eine ausführlichere Beschreibung der Debugging-Ansicht finden Sie unter Debugging verwenden.
Auf dieser Seite wird beschrieben, wie Sie mit der Debugging-Ansicht feststellen, was passiert, wenn die Rate der SpikeArrest-Richtlinie überschritten wird.
Apigee Cloud Console
Debug v2 (neu)
So verwenden Sie die Debugging-Ansicht in der Cloud Console-Benutzeroberfläche, um zu sehen, was passiert, wenn die Ratenbegrenzung der SpikeArrest-Richtlinie überschritten wird:
-
Rufen Sie in der Google Cloud Console die Seite Proxy-Entwicklung > API-Proxys auf.
- Achten Sie darauf, dass der Name Ihrer Organisation in der Projektauswahl im Google Cloud Console-Bereich ausgewählt ist. Der Name der Organisation entspricht dem Namen Ihres Google Cloud-Projekts.
- Klicken Sie auf den Namen des API-Proxys, den Sie debuggen möchten.
- Klicken Sie auf den Tab Entwickeln.
- Klicken Sie auf die Richtlinie Richtlinien > SpikeArrest.
- Ändern Sie im Bearbeitungsbereich Rate in 1pm.
- Klicken Sie auf Speichern.Dadurch können Sie erfolgreiche und fehlgeschlagene API-Aufrufe über das Limit hinaus erkennen.
- Stellen Sie den aktualisierten Proxy bereit.
- Klicken Sie auf den Tab Debugging.
- Klicken Sie auf Debugging-Sitzung starten.
Über das Dialogfeld:
- Wählen Sie die Umgebung aus, in der Sie die Debugging-Sitzung ausführen möchten.
-
(Optional) Wählen Sie in der Liste Filter einen Filter aus, der auf alle Transaktionen in der von Ihnen erstellten Fehlerbehebungssitzung angewendet werden soll. Der Standardwert ist
None (All
                  transactions)
, der alle Transaktionen in den Debugging-Daten einschließt.Weitere Informationen zur Verwendung von Filtern finden Sie unter Filter in einer Fehlerbehebungssitzung verwenden. Informationen zu den integrierten Filtern finden Sie unter Vordefinierte Filter verwenden.
- Klicken Sie auf Start.
-
API-Proxy aufrufen mit
curl(oder mit der URL in einem Webbrowser) mehrmals aufrufen, bis mindestens eine200-Antwort und eine429-Antwort im Bereich Transaktionen angezeigt wird.
-
Klicken Sie auf eine
429-Transaktion. Im Bereich Transaktionskarte wird ein Flussdiagramm mit einer SpikeArrest-Richtlinie mit einem Fehlersymbol angezeigt.
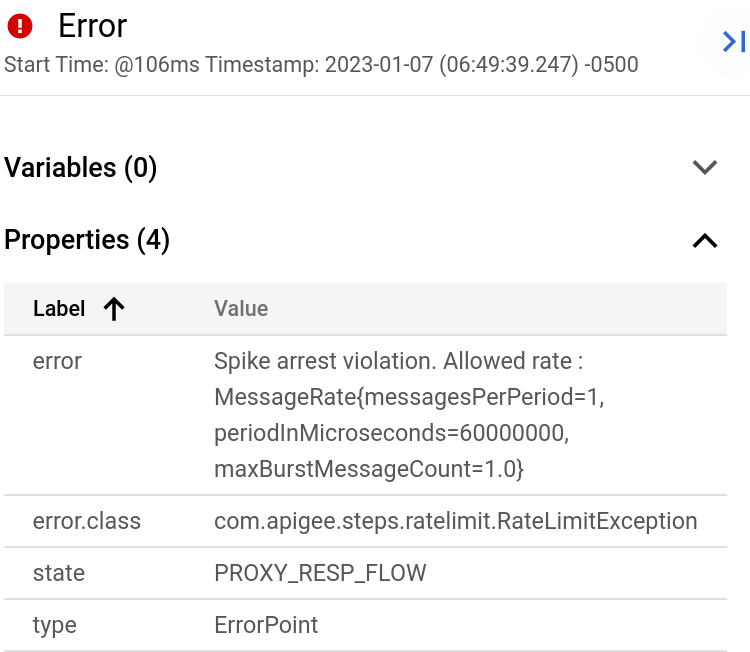
-
Klicken Sie auf das Symbol Fehler. Der Bereich Fehlerattribute wird angezeigt.

Sie können auf die Schaltflächen Zurück und Weiter klicken, um zwischen den Schritten im Ablauf zu wechseln und die Details der einzelnen Schritte anzusehen.
Wenn Sie die gesamte Debugging-Sitzung als einzelnes Dokument herunterladen möchten, klicken Sie auf Sitzung herunterladen. Eine Debugging-Sitzung wird innerhalb von 24 Stunden nach Abschluss beendet. Wenn Sie die Sitzung nach diesem Zeitpunkt aufrufen möchten, müssen Sie sie früher herunterladen.
Debug v1
- Ändern Sie auf dem Tab Develop des API-Proxys die
<Rate>der Spike Arrest-Richtlinie wieder auf 13 Uhr und klicken Sie dann auf Speichern. Dadurch können Sie erfolgreiche und fehlgeschlagene API-Aufrufe über das Limit hinaus erkennen. - Klicken Sie im Proxy-Editor auf den Tab Debugging.
- Klicken Sie auf Fehlerbehebungssitzung starten.
- Wählen Sie die Umgebung aus, in der Sie die Debugging-Sitzung ausführen möchten.
- (Optional) Wählen Sie in der Drop-down-Liste Filter einen Filter aus, der auf alle Transaktionen in der von Ihnen erstellten Fehlerbehebungssitzung angewendet werden soll.
Der Standardwert ist
None (All transactions), der alle Transaktionen in den Debugging-Daten einschließt.Weitere Informationen zur Verwendung von Filtern finden Sie unter Filter in einer Fehlerbehebungssitzung verwenden. Informationen zu den integrierten Filtern finden Sie unter Vordefinierte Filter verwenden.
- Klicken Sie auf Start.
-
Rufen Sie den API-Proxy mehrmals mit
curl(oder mit der URL in einem Webbrowser) auf, bis mindestens eine200-Antwort und eine429-Antwort im linken Bereich angezeigt wird.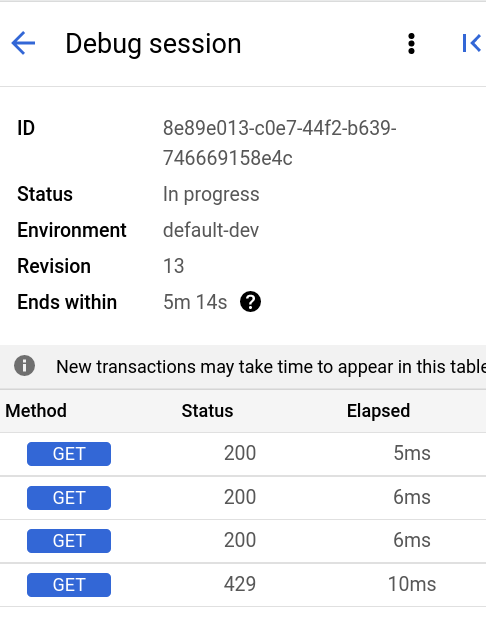
- Klicken Sie im linken Bereich auf die Transaktion
429. Im rechten Bereich wird dann ein Gantt-Diagramm für die Transaktion angezeigt.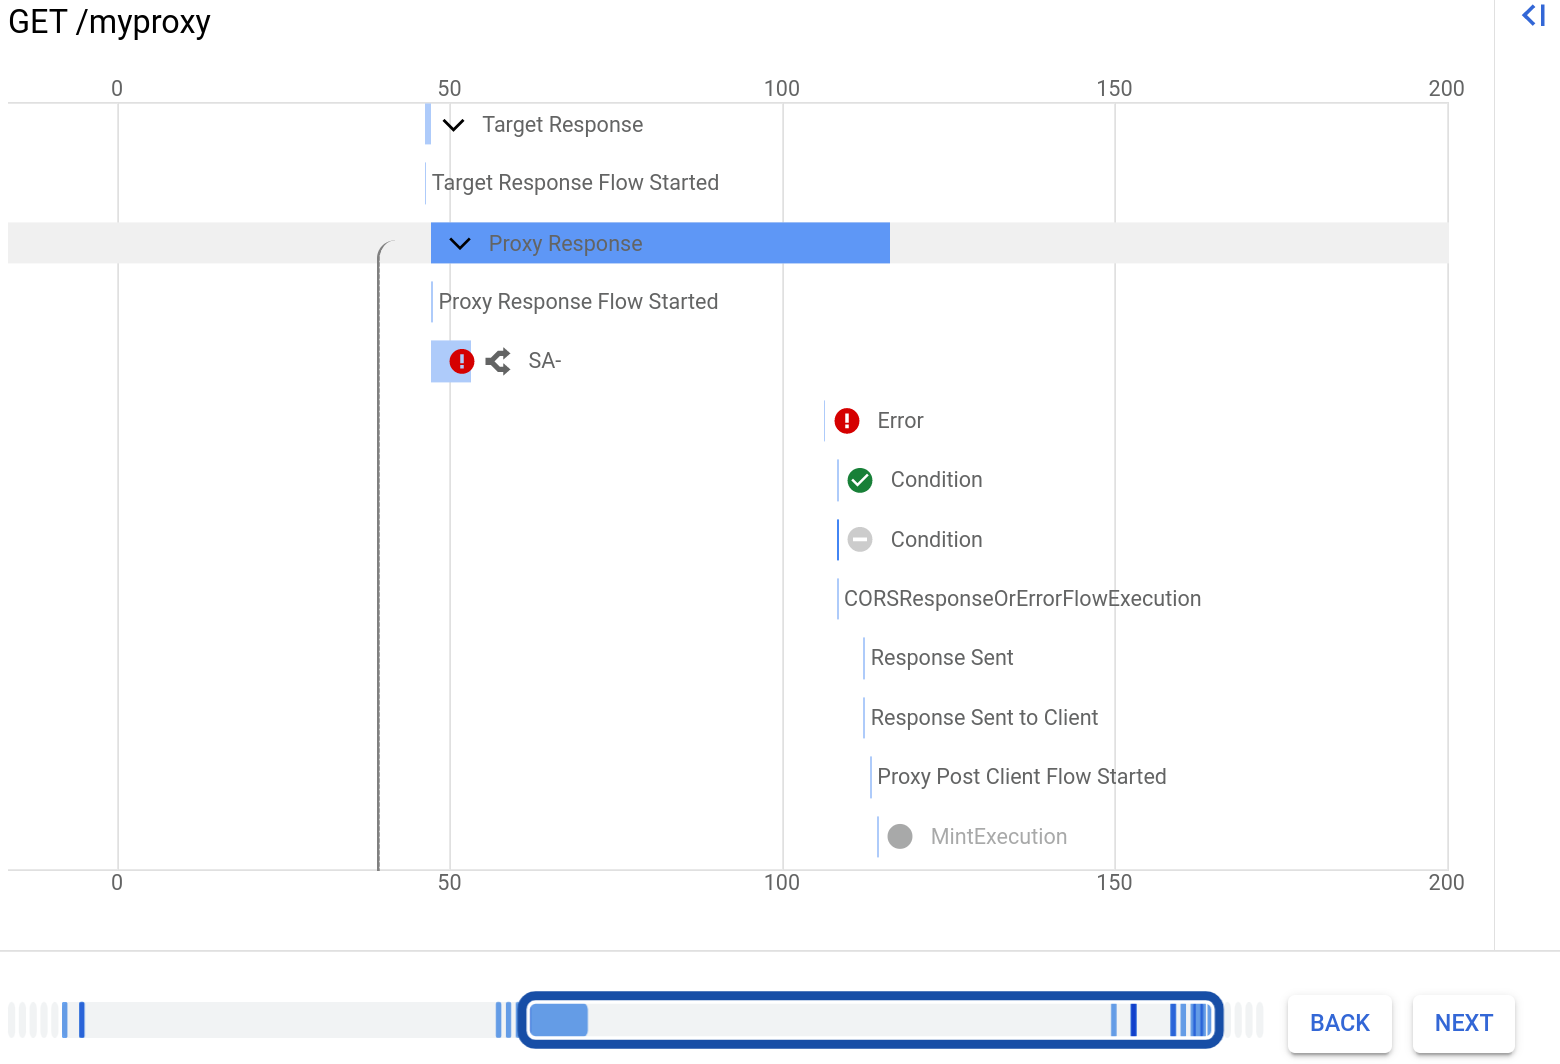
Beachten Sie, dass eine Zeile für die Spike Arrest-Richtlinie mit einem Fehlersymbol angezeigt wird.
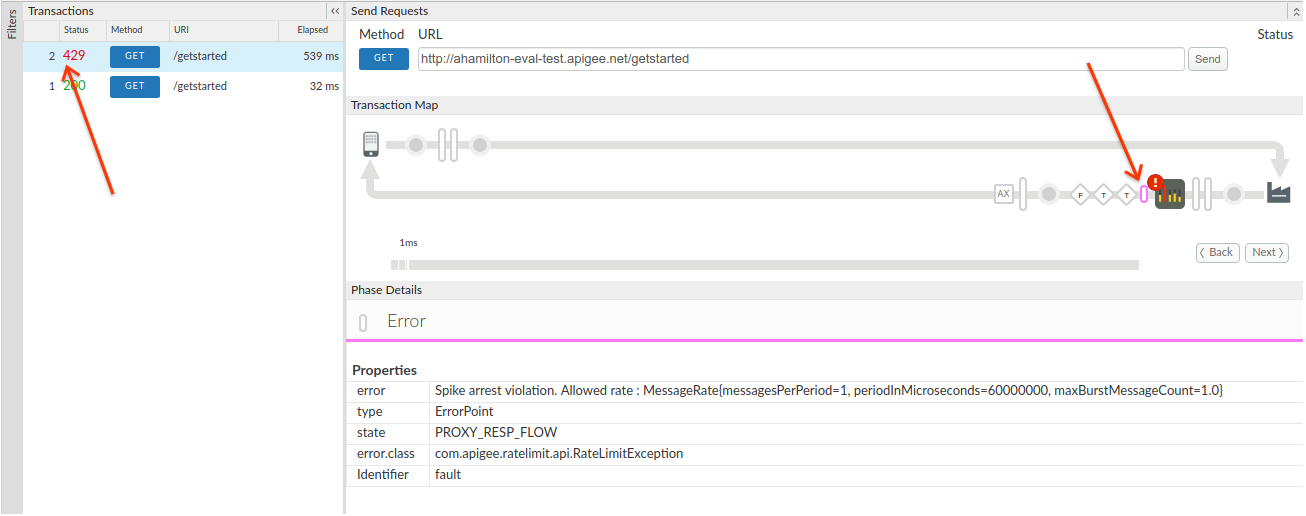
Klicken Sie auf die Zeile Fehler. Daraufhin werden rechts neben dem Diagramm die Fehlerdetails angezeigt. Die folgende Abbildung zeigt den Abschnitt Eigenschaften der Fehlerdetails:
Über das Dialogfeld:
Sie können unter dem Gannt-Diagramm auf die Schaltflächen Zurück und Weiter klicken, um zwischen den Schritten im Ablauf zu wechseln und die Details der einzelnen Schritte anzusehen.
Wenn Sie die gesamte Debugging-Sitzung als einzelnes Dokument herunterladen möchten, klicken Sie auf Sitzung herunterladen. Eine Debugging-Sitzung wird innerhalb von 24 Stunden nach Abschluss beendet. Wenn Sie die Sitzung nach diesem Zeitpunkt aufrufen möchten, müssen Sie sie früher herunterladen.
Klassische UI
- Ändern Sie auf dem Tab Entwickeln des API-Proxy die
<Rate>der Spike Arrest-Richtlinie wieder auf 1pm und klicken Sie dann auf Speichern. Dadurch können Sie erfolgreiche und fehlgeschlagene API-Aufrufe über das Limit hinaus erkennen. - Klicken Sie im Proxy-Editor auf den Tab Debugging.
- Wählen Sie unter Debugging-Sitzung starten die Umgebung aus, in der der Proxy bereitgestellt wird.
- Klicken Sie auf Fehlerbehebungssitzung starten.
-
Rufen Sie den API-Proxy noch einmal mit
curl(oder mit der URL in einem Webbrowser) auf, bis Sie mindestens eine200-Antwort und eine429-Antwort im Bereich Transaktionen debuggen sehen.curl -v https://YOUR_ENV_GROUP_HOSTNAME/my-proxy
Dabei ist
YOUR ENV_GROUP_HOSTNAMEder Hostname der Umgebungsgruppe. Weitere Informationen finden Sie unter Hostname der Umgebungsgruppe finden.Im Folgenden werden die Antworten
200und429angezeigt.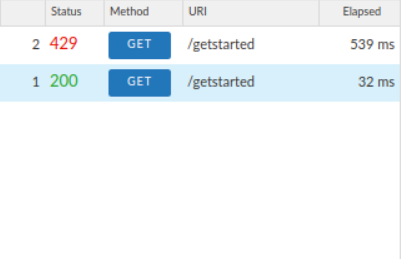
- Klicken Sie im linken Bereich Transaktionen auf die Transaktion
200. Die Debugging-Details werden im Hauptfenster unter Transaktionskarte geladen, in dem ein Anfrage-/Antwort-Diagramm angezeigt wird. Das Symbol "Spike Arrest" befindet sich im Anfrageverlauf. - Klicken Sie im Flussdiagramm auf das Kreissymbol in der Antwort, wobei die älteste Seite rechts angezeigt wird (im folgenden Diagramm dargestellt).
Im Bereich Phasendetails werden die an diesem Punkt im Ablauf verfügbaren Daten angezeigt. Wenn Sie durch diesen Bereich scrollen, werden die HTTP-Antwortheader und der Textinhalt angezeigt.
- Sehen Sie sich nun einen Fehler in Debugging an.
Klicken Sie im Bereich "Transaktionen" auf die Transaktion
429. Im Haupteditorfenster wird nur ein Flussdiagramm mit Elementen in der Anfrage angezeigt, einschließlich eines Spike Arrest-Symbols mit einem roten Ausrufezeichen, das einen Fehler anzeigt.Klicken Sie auf das kleine Fehlersymbol rechts neben dem Spike Arrest-Symbol und sehen Sie sich die Details des Spike Arrests im Bereich Phasendetails an.
Sie können im Flussdiagramm auf die Schaltflächen Zurück und Weiter klicken, um zwischen Punkten im Ablauf zu wechseln und die Debugging-Details aufzurufen.
Wenn Sie die gesamte Debugging-Sitzung als einzelnes Dokument sehen möchten, laden Sie sie herunter, indem Sie auf Debugging-Sitzung herunterladen klicken.
Weitere Informationen finden Sie unter Debugging verwenden.