This page applies to Apigee and Apigee hybrid.
View
Apigee Edge documentation.
![]()
Apigee enables you to create alerts that are triggered by specific API traffic patterns— for example, when an API's error rate reaches a predetermined threshold. AAPI Ops extends this capability with anomaly alerts, which are triggered whenever Apigee detects unusual API traffic data. The advantage of anomaly alerts is that you don't have to define the exact conditions for each anomaly yourself. AAPI Ops determines the right anomaly conditions using statistical methods, and constantly updates them based on recent traffic data. Using anomaly detection, you let Apigee detect traffic and performance issues, rather than predetermining the alert conditions yourself.
When AAPI-Ops detects an anomaly, it displays the event in the Anomaly Events dashboard. However, it doesn't automatically raise an alert for the anomaly. If you examine an anomaly in the dashboard and decide you want to be alerted about similar event in future, you can create an anomaly alert and set up a notification, which sends you a message whenever the anomaly is detected.
Before creating an anomaly alert, make sure you have been assigned the required roles for AAPI Ops.
To create an anomaly alert in the Alerting policy dashboard, do the following:
Open the Create alerting policy dashboard in the Google Cloud console.
Note: Open the Create alerting policy dashboard in a new tab if you want to follow the steps below.
- Click ADD CONDITION. This opens a new window where you can add the alert condition.
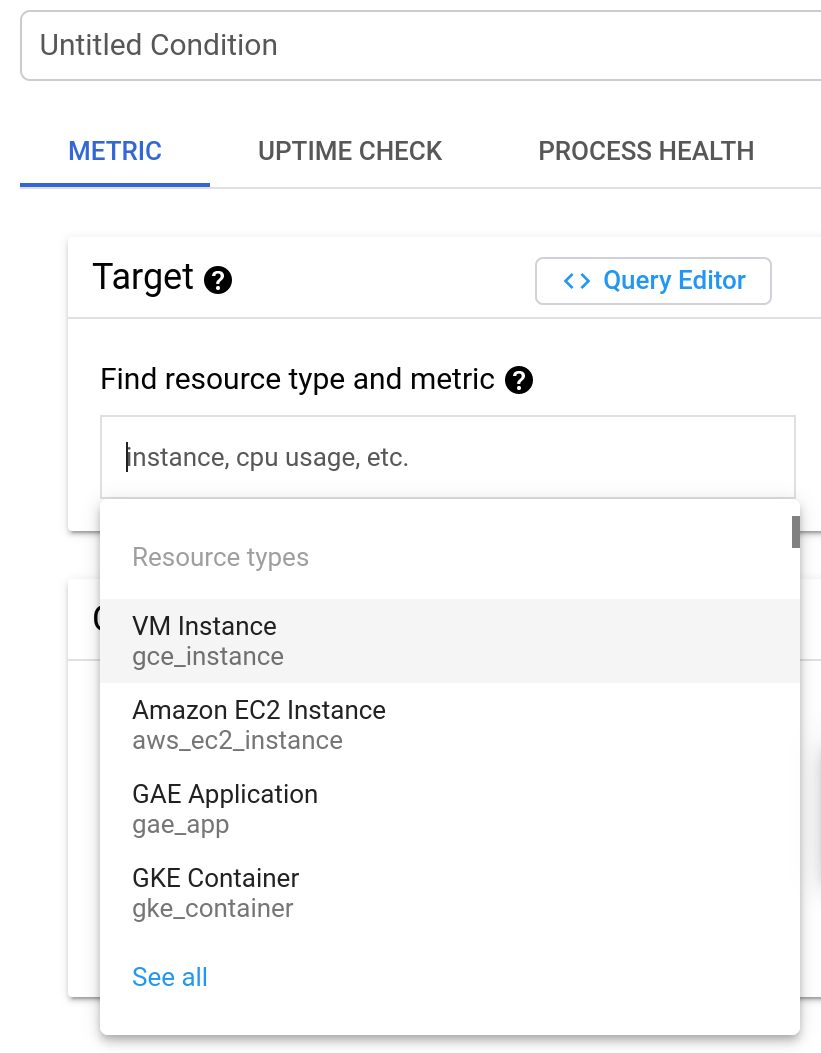
- Optional: Add a title for the condition in the Untitled Condition field. We'll leave it blank for this example, in which case the condition is given a default title.
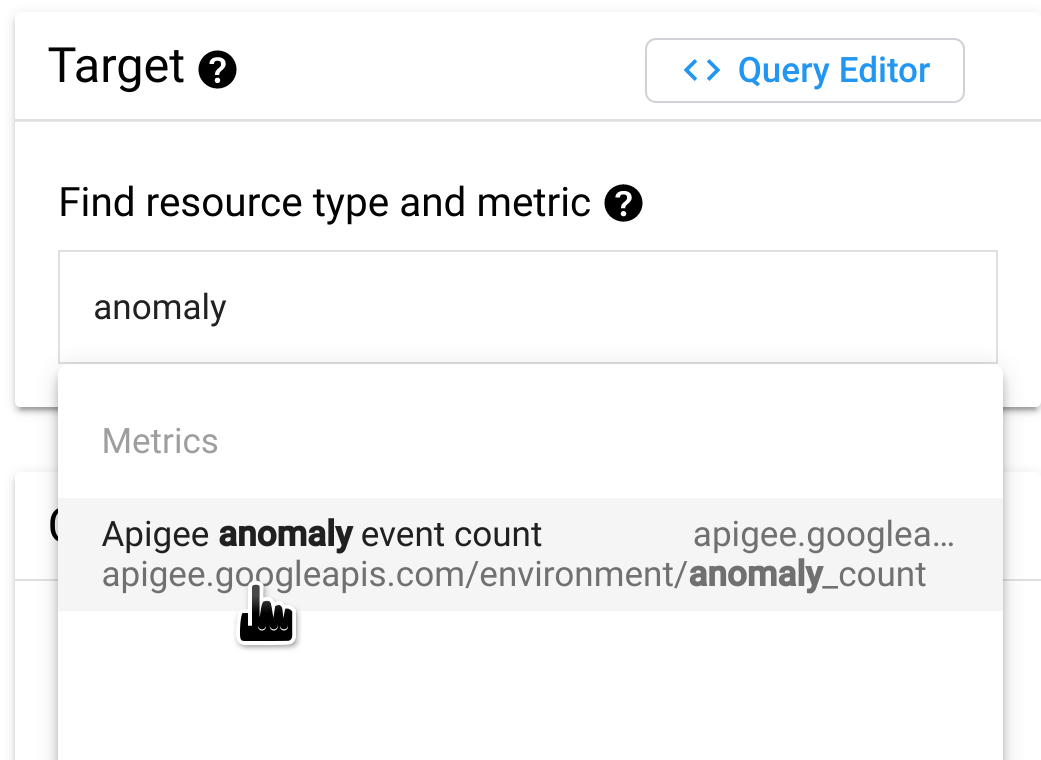
In the Find resource type and metric field, type
anomaly
and then select Apigee anomaly event count.
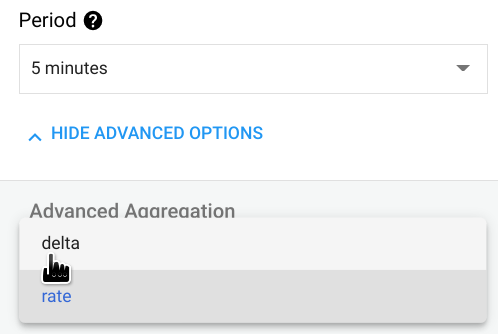
Click SHOW ADVANCED SETTINGS and in the Advanced Aggregation pane, select delta in the Aligner field. This specifies how the data is aggregated over each time period, which you can set in the Period field. With the delta setting, the aggregated value equals the final data value in the time period minus the initial data value.
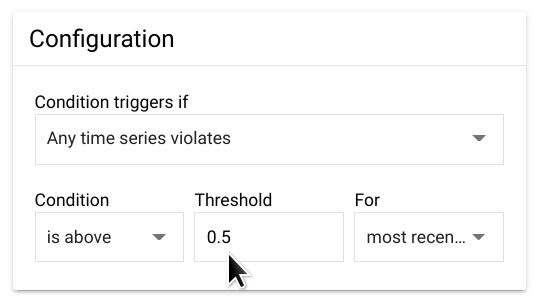
In the Configuration pane, set the Threshold to 0.5. (Any number between 0 and 1 will work for the threshold.) With this value, a single anomaly exceeds the threshold and triggers the alert.
Click Add. This takes you back to the Create alerting policy page where you can see the condition you just created.
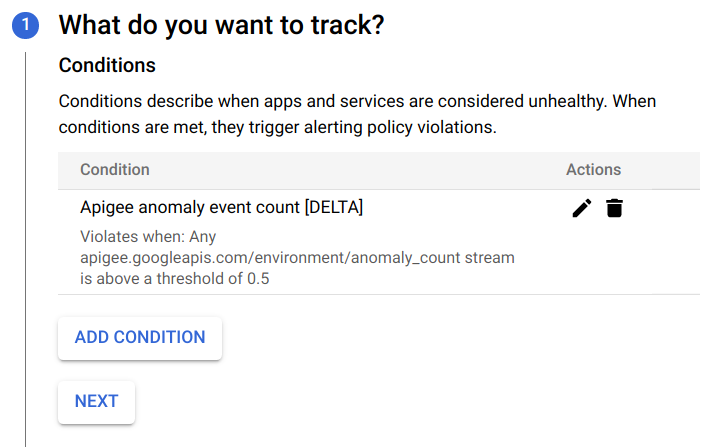
At this point you can choose to either:
- Click ADD Condition to create another condition for the alert, or
- Click NEXT to go to the next step, where you will have the option to create a notification for the alert, as described in the next section.
If you don't want to create a notification, click NEXT twice without entering anything to bypass Steps 2 and 3.
Click SAVE to save the alert.
Creating a notification for an alert
If you want to be notified immediately when an incident occurs, you can create a notification for the alert. When the alert is triggered, Apigee sends you a notification. You can choose any of the following channels to receive the notification:
- PagerDuty
- Slack
- Webhooks
To create a notification for an alert:
If you just created the alert (as shown in the preceding example) and are currently viewing the Create alerting policy dashboard, skip to the next step.
Otherwise, open the Policies pane in the Cloud console Alerting dashboard, and in the row for the alert you created, click the three dots icon at the end of the row and select Edit.
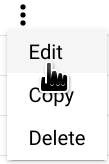
This opens the Edit alerting policy dashboard:
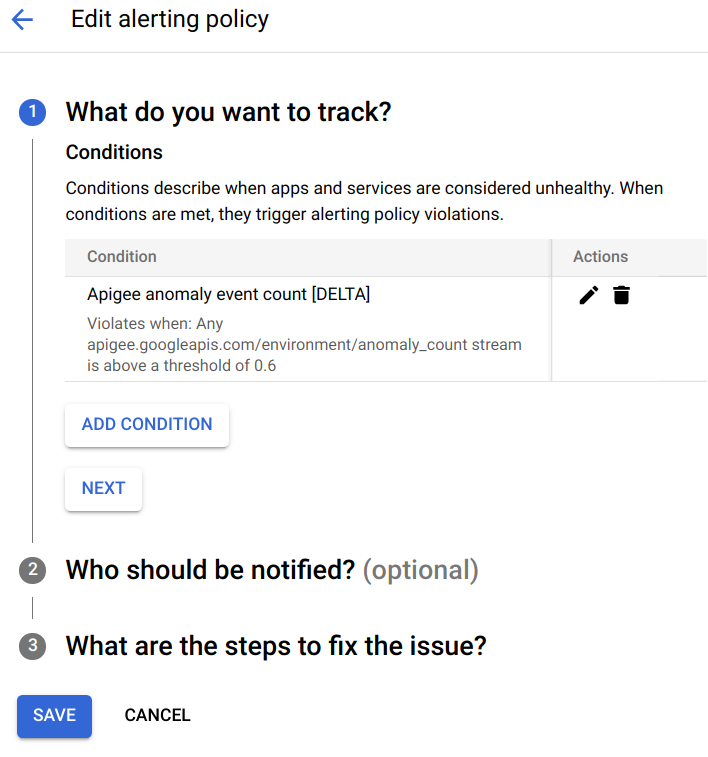
In the What do you want to track? section, click NEXT.
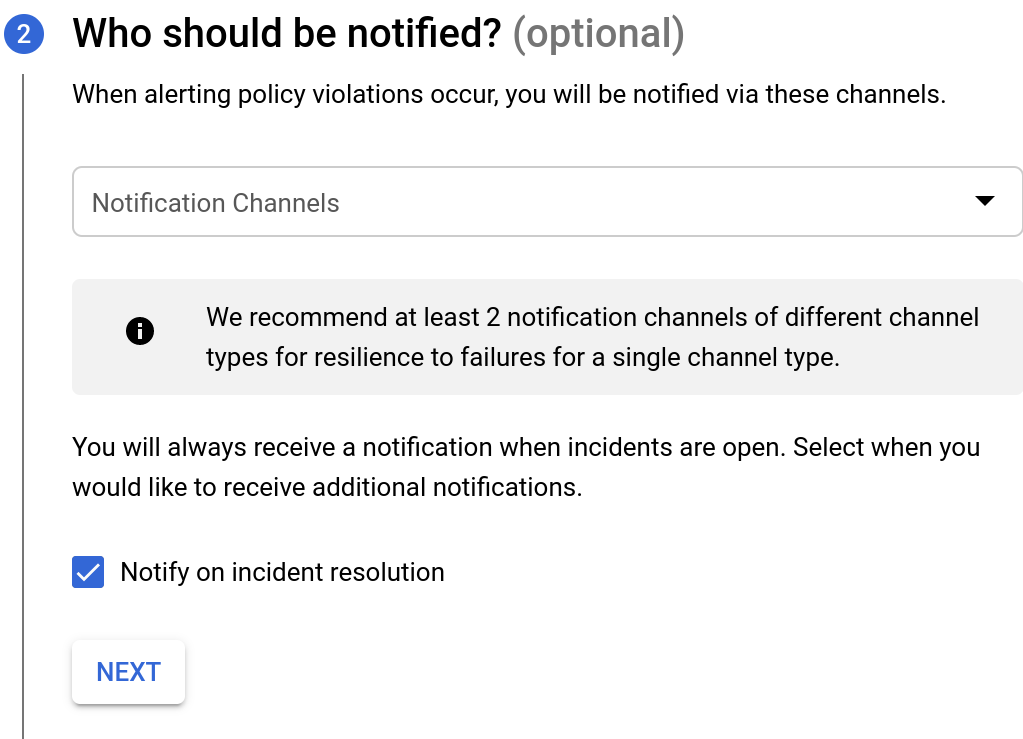
In the Who should be notified section, select Notification Channels, where you can choose from existing channels for receiving notifications.
If you want to create a new notification channel, select MANAGE NOTIFICATION CHANNELS. This opens the Notification channels dashboard in the Cloud console, where you can add channels. See Create and manage notification channels for more details.
Click NEXT. This displays the options shown below.
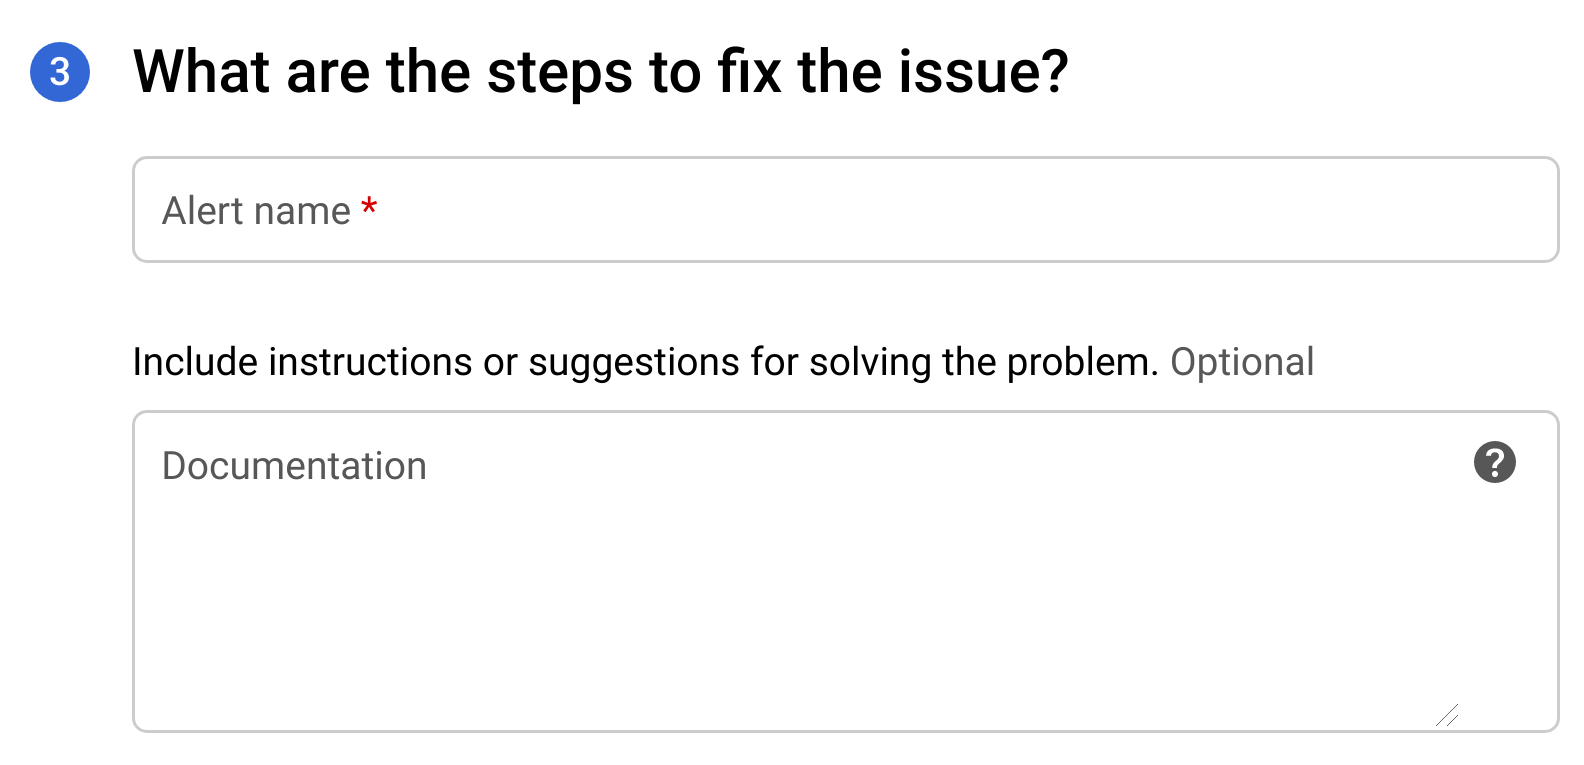
- In the Alert name field, enter a name for the alert.
- In the Documentation field, enter the URL for a web page that provides information on how to fix the issue that caused the alert. The URL will be included in the notification.
- Click Save to create the alert.
When an alert is triggered, you will receive a notification providing a summary of the incident and when it occurred. The notification also contains two links to help you investigate the incident:
- VIEW INCIDENT: View the incident in the Cloud console.
- VIEW IN APIGEE: View a timeline graph of API traffic and related data tables in the API Monitoring Investigate dashboard.
