This tutorial describes how to create a web-performance-monitoring app using Google Cloud serverless technologies.
Performance plays a major role in the success of any web app. If your site performs poorly, you might experience fewer sign-ups and lower user retention, which will probably impact your business goals. Performance should be a key success criterion when designing, building, and testing your web app.
However, page performance can also change over time as your app evolves. Developers can add or update images and scripts, or the underlying app serving infrastructure itself can change. Therefore, it's important to regularly monitor page performance. Typically, you store the performance metrics to enable historical analysis. It's also common practice to generate alerts if page performance falls below some defined thresholds.
Objectives
- Create a Cloud Function that uses headless Chrome to collect web page performance metrics.
- Store the metrics in Cloud Storage.
- Create another Cloud Function, triggered by the Cloud Storage creation event, to analyze the page metrics.
- Store the analysis results in Firestore.
- Create another Cloud Function, triggered by the Firestore creation event, to publish an alert to Pub/Sub if page performance is poor.
- Create a Cloud Scheduler job to periodically trigger the first Cloud Function.
- Verify the outputs for success and for failure scenarios.
Costs
This tutorial uses billable components of Google Cloud, including:
- Cloud Functions
- Cloud Scheduler
- Cloud Storage
- Firestore
- Pub/Sub
- Container Registry
- Cloud Build
Use the pricing calculator to generate a cost estimate based on your projected usage.
Before you begin
- Sign in to your Google Cloud account. If you're new to Google Cloud, create an account to evaluate how our products perform in real-world scenarios. New customers also get $300 in free credits to run, test, and deploy workloads.
-
In the Google Cloud console, on the project selector page, select or create a Google Cloud project.
-
Make sure that billing is enabled for your Google Cloud project.
-
Enable the Cloud Functions, Cloud Scheduler, Pub/Sub, and Cloud Build APIs.
-
In the Google Cloud console, on the project selector page, select or create a Google Cloud project.
-
Make sure that billing is enabled for your Google Cloud project.
-
Enable the Cloud Functions, Cloud Scheduler, Pub/Sub, and Cloud Build APIs.
Architecture
Web performance monitoring operations are typically stateless and short-lived. They are also often event-driven, occurring either on a schedule or triggered as part of some other process, such as an automated testing pipeline. These characteristics make serverless architectures an appealing choice for implementing web analysis apps.
In this tutorial, you use various parts of the Google Cloud serverless stack, including Cloud Functions, Firestore, Cloud Scheduler, and Pub/Sub. You don't have to manage the infrastructure for any of these services, and you pay only for what you use. The core of the app is implemented using Cloud Functions, which provides an event-driven and scalable serverless execution environment. Using Cloud Functions, you can create and connect apps using independent, loosely coupled pieces of logic.
The following diagram shows the architecture of the serverless solution that you create in this tutorial.

Preparing the environment
Before you create the serverless environment, you get the code from GitHub, set variables, and prepare resources you need later for analyzing and storing.
Get the code and set environment variables
In the Google Cloud console, open Cloud Shell.
Clone the repository that contains the code for the Cloud Functions used in this tutorial:
git clone https://github.com/GoogleCloudPlatform/solutions-serverless-web-monitoring.gitChange to the functions directory:
cd solutions-serverless-web-monitoring/functionsSet the current project ID and project number as shell variables:
export PROJECT=$DEVSHELL_PROJECT_ID
export PROJECT_NUM=$(gcloud projects list \
    --filter="$PROJECT" \
    --format="value(PROJECT_NUMBER)")
Set the default deployment region for Cloud Functions. The following example sets the region to
us-east1, but you can change this to any region where Cloud Functions is available.export REGION=us-east1 gcloud config set functions/region $REGION
Create Cloud Storage buckets
In this section, you create a Cloud Storage bucket to store the collected page performance data. You can choose any location or storage class, but it's a good practice to create buckets in the same location as the Cloud Functions that will use the buckets.
In Cloud Shell, export a shell variable for the names of the Cloud Storage buckets that will store the metrics. Bucket names must be globally unique, so the following command uses your Google Cloud project number as a suffix on the bucket name.
export METRICS_BUCKET=page-metrics-$PROJECT_NUMUse the
gsutiltool to create the buckets:gsutil mb -l $REGION gs://$METRICS_BUCKETUpdate the
env-vars.yamlfile with the bucket names. This file contains environment variables that you will pass to the Cloud Functions later.sed -i "s/\[YOUR_METRICS_BUCKET\]/$METRICS_BUCKET/" env-vars.yaml
Create a Firestore collection
In a later section, you analyze the page performance metrics. In this section, you create a Firestore collection to store the results of each analysis.
In the Google Cloud console, go to the Firestore page.
If you've never created a Firestore database before, perform the following steps:
- Click Select Native mode to activate Firestore.
- Select a regional location close to the region where your Cloud Functions will run.
- Click Create Database.
It takes a few moments to complete the configuration.
Click Start Collection and set the collection ID to
page-metrics.Click Save.
Create a Pub/Sub topic and subscription
Typically you want to notify interested systems and parties if the analysis indicates that a page is performing poorly. In this section, you create Pub/Sub topics that will contain messages that describe any poor performance.
In Cloud Shell, create a Pub/Sub topic named
performance-alerts:gcloud pubsub topics create performance-alertsCreate a subscription to the topic. You use the subscription to verify that alert messages are being published to the topic.
gcloud pubsub subscriptions create performance-alerts-sub \
    --topic performance-alerts
Collecting page performance metrics
Many websites use JavaScript to dynamically render page content. This makes performance analysis more complicated, because the client needs to emulate a browser in order to fully load the web page. The Node.js runtime for Cloud Functions has support for headless Chrome, which provides the functionality of a full web browser in a serverless environment.
Puppeteer is a Node.js library built by the Chrome DevTools team that provides a high-level API to control headless Chrome. By default, Puppeteer installs a recent version of the browser alongside the library. Therefore, you can add Puppeteer as a dependency to the Cloud Function as an easy way to use headless Chrome within the function.
Measuring and analyzing web page performance is a large and complex field. For simplicity, in this tutorial you use Puppeteer to collect some top-level page performance metrics. However, you can also use Puppeteer and the Chrome DevTools Protocol (CDP) to collect more detailed information, such as timeline traces. You can also better represent your end-user experience by emulating network congestion and performing CPU throttling. For a good introduction to analyzing web page performance, see the Chrome web developers site.
Note that there are many factors that influence web page load times, including the performance characteristics of the client. It's important to establish baselines using the CPU and RAM configurations of the Cloud Function.
The following snippet from the tracer/index.js file shows how to use
Puppeteer to load the web page:
In Cloud Shell, deploy the
traceCloud Function:gcloud functions deploy trace \ --trigger-http \ --runtime nodejs10 \ --memory 1GB \ --source tracer \ --env-vars-file env-vars.yaml \ --quietIt can take several minutes to deploy the Cloud Function.
The deployment parameters specify that the function should have an HTTP trigger, should use the Node.js 10 runtime, and should have 1 GB memory. This amount of memory is required in order to run headless Chrome. Environment variables are supplied to the function by using the
env-vars.yamlfile
By default, HTTP-triggered Cloud Functions allow unauthenticated invocations. Therefore, you must secure the trace function.
Remove the
cloudfunctions.invokerIAM role forallUsers:gcloud beta functions remove-iam-policy-binding trace \ --member allUsers \ --role roles/cloudfunctions.invoker
Analyzing the metrics
A typical goal of web-performance-monitoring exercises is to track performance against some defined benchmarks. If a particular metric exceeds an expected threshold, it can indicate a problem with a recent software release, or a problem with the underlying infrastructure.
In this section, you create a Cloud Function in Python to parse the page metrics
and persist the results to a Firestore collection. The function
evaluates the FirstMeaningfulPaint metric against an expected threshold, and
marks the analysis result as problematic if the threshold is exceeded.
FirstMeaningfulPaint is a
user-centric metric
that broadly describes when a
page becomes useful to the user. You use a Cloud Storage trigger to
execute the analysis function whenever a new file is written to the bucket that
contains the metrics.
The following snippet from the analyzer/main.py file shows the function
logic:
Deploy the
analyzeCloud Function:gcloud functions deploy analyze \ --trigger-resource gs://$METRICS_BUCKET \ --trigger-event google.storage.object.finalize \ --runtime python37 \ --source analyzer \ --env-vars-file env-vars.yamlThe function is triggered by a
finalizeevent in the metrics bucket, which is sent every time an object is created in the bucket. The function uses the Python 3.7 runtime.
Alerting on failures
Typically, you want to take action if the metrics analysis indicates a poorly performing page.
In this section, you create a Cloud Function to send a message to a Pub/Sub topic if page performance is unsatisfactory. The function is triggered every time a document is created in the Firestore collection. Interested parties can subscribe to the Pub/Sub topic and take appropriate action. For example, a support app could subscribe to the Pub/Sub messages and send an email, trigger a support pager, or open a bug.
The following snippet from the alerter/main.py file shows the function
logic:
Notice that the alert is sent only if the status field indicates a failure.
Deploy the
alertCloud Function:gcloud functions deploy alert \ --trigger-event providers/cloud.firestore/eventTypes/document.create \ --trigger-resource "projects/$PROJECT/databases/(default)/documents/page-metrics/{any}" \ --runtime python37 \ --source alerter \ --env-vars-file env-vars.yaml \ --entry-point generate_alertThe function is triggered by a
document.createevent in thepage-metricsFirestore collection. The{any}suffix is a wildcard indicating that the function should be triggered any time a document is created in the collection.
Scheduling the analysis
It's good practice to regularly monitor page performance. For example, you
might want to analyze a certain page every hour, every day, or every week. In
this section, you create a Cloud Scheduler job to periodically run the
the analysis pipeline by triggering the trace function.
The Cloud Scheduler job is executed using a service account that's
been granted the required cloudfunctions.invoker IAM role for the trace
function.
Sometimes web pages don't respond correctly, or requests time out, so retries are unavoidable with web analysis apps. It's therefore important to have retry logic in your app. Cloud Functions supports retries for background functions.
Retries are not available for HTTP-triggered Cloud Functions, so you
can't use Cloud Functions to retry the trace function. However,
Cloud Scheduler supports retries. For more information on configuring
retry parameters, see the
RetryConfig
documentation.
Verify that the three Cloud Functions have been correctly deployed and are showing
ACTIVEstatus:gcloud functions listCreate a new service account that will be used as the identity for executing the Cloud Scheduler job:
gcloud iam service-accounts create tracer-job-saGrant the new service account the
cloudfunctions.invokerIAM role for thetracefunction:gcloud beta functions add-iam-policy-binding trace \ --role roles/cloudfunctions.invoker \ --member "serviceAccount:tracer-job-sa@$PROJECT.iam.gserviceaccount.com"Create a Cloud Scheduler job:
gcloud scheduler jobs create http traceWithRetry \
    --uri="https://$REGION-$PROJECT.cloudfunctions.net/trace" \
    --http-method=POST \
    --message-body="{\"url\":\"http://www.example.com\"}" \
    --headers="Content-Type=application/json" \
    --oidc-service-account-email="tracer-job-sa@$PROJECT.iam.gserviceaccount.com" \
    --schedule="0 3 * * *" \
    --time-zone="UTC" \
    --max-retry-attempts=3 \
    --min-backoff=30s
Because the job will call the HTTP-triggered
tracefunction, the command specifies the job type ashttp, and supplies the function trigger URL as theurivalue. The page to analyze, in this casewww.example.com, is provided in themessage-bodyflag. Theoidc-service-account-emailflag defines the service account to use for authentication. The command indicates the number of retries to attempt using themax-retry-attemptsflag, and the value passed with thescheduleflag sets the run schedule to 3:00 AM UTC every day.
Verifying results
In this section, you verify that you get the expected behavior for both success and failure conditions.
Verify success
The Cloud Scheduler job won't run until the next scheduled time, which in this case is 3:00 AM UTC. To see the results immediately, you can manually trigger a run.
- Wait 90 seconds for the scheduler job to finish initializing.
Run the Cloud Scheduler job manually:
gcloud scheduler jobs run traceWithRetryWait about 30 seconds for the function pipeline to complete.
List the contents of the metrics bucket to show that page metrics have been collected:
gsutil ls -l gs://$METRICS_BUCKETIn the Google Cloud console, open the Cloud Logging viewer page:
You see log messages from each of the three Cloud Functions:
trace,analyze, andalert. It can take a few moments for the logs to flow through, so you might need to refresh to the logs pane.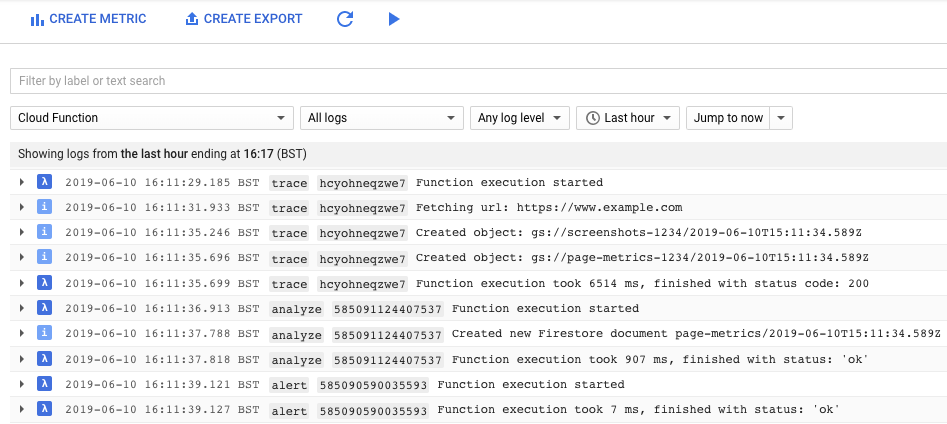
Make a note of the Firestore document ID, which is listed following the text
Created new Firestore document page-metrics/In the Google Cloud console, go to the Firestore page:
Inspect the document that contains results of the analysis. The document values indicate a
PASSstatus and contain the latest page performance metrics.In Cloud Shell, verify that no alert messages have been sent to the Pub/Sub topic by trying to pull a message off the subscription:
gcloud pubsub subscriptions pull \
    projects/$PROJECT/subscriptions/performance-alerts-sub \
    --auto-ack
You see no items listed.
Verify failure
Manually trigger the trace function. This time, you provide the Google Cloud Tutorials page as the URL. This page has a lot of dynamic content that increases the page load time over the expected maximum threshold.
gcloud functions call trace \
    --data='{"url":"https://cloud.google.com/docs/tutorials"}'
Because you have project the
OwnerorEditorIAM role, you have sufficient permissions to invoke the function.Wait about 30 seconds for the function pipeline to complete.
List the contents of the metrics bucket to verify that additional metrics have been collected:
gsutil ls -l gs://$METRICS_BUCKETYou now see two items in each bucket.
In the Google Cloud console, go to the Cloud Logging viewer page and filter for the Cloud Function logs:
You see an error from the
analyzefunction indicating that the page exceeded the maximum allowed load time. Again, you might need to refresh the logs pane to see the latest messages.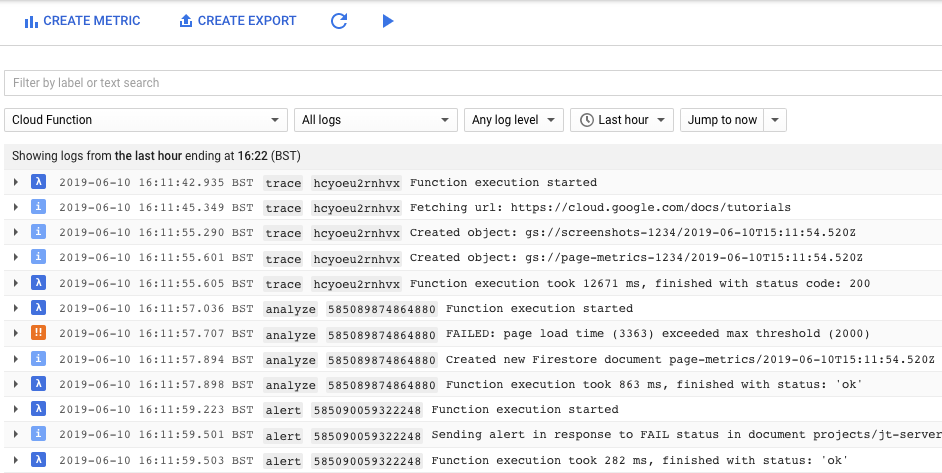
Make a note of the Firestore document ID.
In the Google Cloud console, go to the Firestore page:
Find the document that describes the failed analysis.
The status field is marked as
FAIL.In Cloud Shell, verify that an alert message was sent to the Pub/Sub topic by pulling a message off the subscription.
gcloud pubsub subscriptions pull \
    projects/$PROJECT/subscriptions/performance-alerts-sub \
    --auto-ack
This time, you see the contents of the message.
Clean up
Delete the project
- In the Google Cloud console, go to the Manage resources page.
- In the project list, select the project that you want to delete, and then click Delete.
- In the dialog, type the project ID, and then click Shut down to delete the project.
What's next
- Learn more about Google Cloud serverless technologies.
- Explore other Cloud Functions tutorials.
- Watch the video from Google I/O '18 that describes other uses for Puppeteer and headless Chrome.
- Explore reference architectures, diagrams, and best practices about Google Cloud. Take a look at our Cloud Architecture Center.