本页面适用于 Apigee 和 Apigee Hybrid。
查看 Apigee Edge 文档。

学习内容
通过本教程,您将学会:
- 查看响应消息的标头和正文内容。
- 查看错误消息。
所需条件
在开始本教程之前,请执行以下操作:
- 确保您的机器上安装了
curl,以便通过命令行进行 API 调用。 - 完成准备工作中的步骤。
- 向您的代理添加 SpikeArrest 政策。SpikeArrest 政策是一种用于限制可发送到 API 代理的请求数量的政策。 您的代理必须至少包含一项政策。
查看消息数据
通过 Apigee 代理编辑器中的“调试”视图,您可以查看标头、变量、对象以及其他详细信息,例如 API 代理请求和响应流中的响应时间。您还可以使用调试视图查看请求或响应在 API 代理处理过程中发生的变化。如需详细了解调试视图,请参阅使用调试。
本页面介绍了如何使用“调试”视图来查看超出 SpikeArrest 政策速率时发生的情况。
Apigee Cloud 控制台
调试 v2(新)
如需在 Cloud 控制台界面中使用“调试”视图来查看超出 SpikeArrest 政策速率时发生的情况,请执行以下操作:
-
在 Google Cloud 控制台中,前往代理开发 > API 代理页面。
- 确保在 Google Cloud 控制台窗格的项目选择器中已选择您的组织名称。组织名称与您的 Google Cloud 项目名称相同。
- 点击要调试的 API 代理的名称。
- 点击开发标签页。
- 依次点击政策 > SpikeArrest 政策。
- 在“修改”窗格中,将速率更改为 1pm。
- 点击保存。这样,您就可以查看成功和失败的(超过限制)API 调用。
- 部署更新的代理。
- 点击调试标签页。
- 点击启动调试会话。
在该对话框中:
- 选择要运行调试会话的环境。
-
(可选)从过滤条件列表中,选择一个过滤条件以应用于您要创建的调试会话中的所有交易。默认值为
None (All transactions),其中包含调试数据中的所有事务。如需了解如何使用过滤条件,请参阅在调试会话中使用过滤条件。 如需了解内置过滤条件,请参阅使用预定义的过滤条件。
- 点击开始。
-
使用
curl(或在网络浏览器中输入网址)多次调用 API 代理,直到您在事务窗格中看到至少一个200响应和一个429响应为止。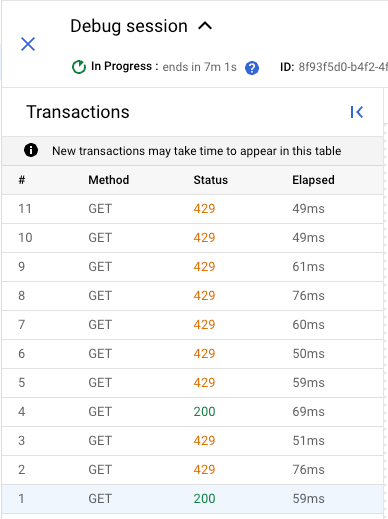
-
点击
429事务。在事务示意图窗格中,系统会显示一个流程图,其中包含带有错误图标的 SpikeArrest 政策。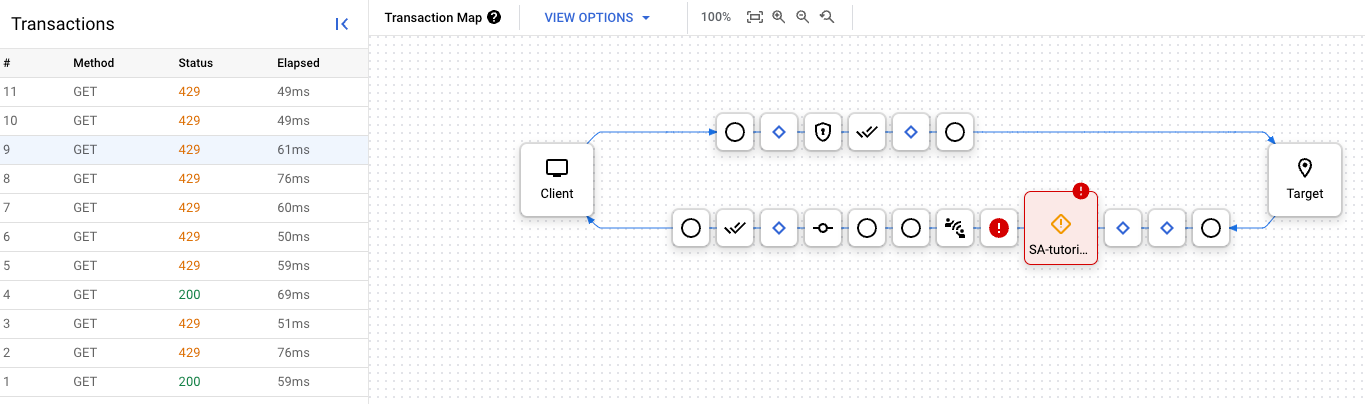
-
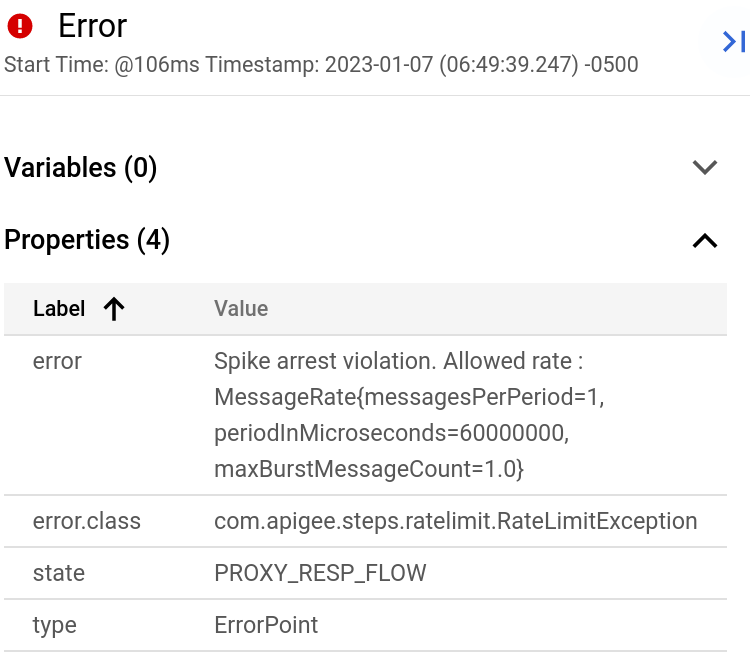
点击 错误图标。系统会显示错误属性窗格。
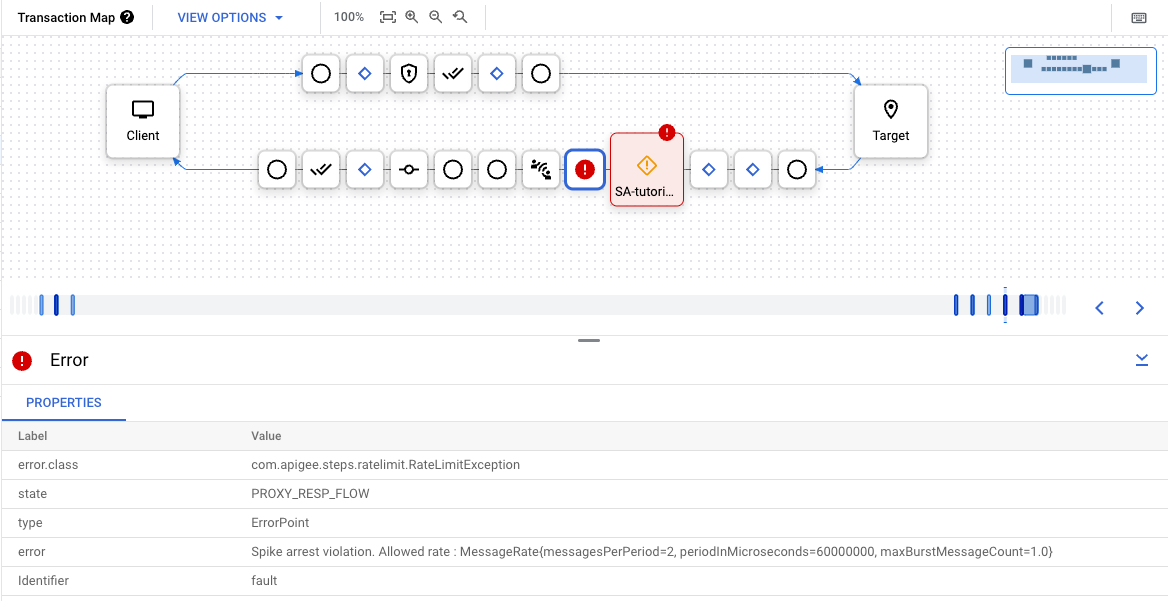
您可以点击 上一步和 下一步按钮,以在流程的各个步骤之间切换,并查看每个步骤的详细信息。
如需将整个调试会话下载为单个文档,请点击下载会话。调试会话在完成后的 24 小时内删除,因此,如果您希望在该时间之后查看该会话,则需要在此之前下载调试会话。
调试 v1
- 在 API 代理的开发标签页上,将 Spkeke Arrest 政策的
<Rate>再次修改为 1pm,然后保存 代理。这样,您就可以查看成功和失败的(超过限制)API 调用。 - 在代理编辑器中,点击调试标签页。
- 点击启动调试会话。
- 选择要运行调试会话的环境。
- (可选)从过滤条件下拉列表中,选择一个过滤条件以应用于您要创建的调试会话中的所有事务。
默认值为
None (All transactions),其中包含调试数据中的所有事务。如需了解如何使用过滤条件,请参阅在调试会话中使用过滤条件。 如需了解内置过滤条件,请参阅使用预定义的过滤条件。
- 点击开始。
-
使用
curl(或在网络浏览器中输入网址)再次调用 API 代理,直到您在左侧窗格中看到至少一个200响应和一个429响应为止。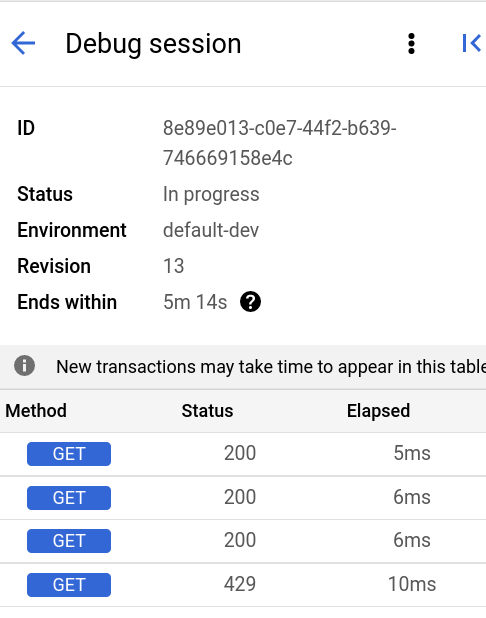
- 点击左侧窗格中的
429事务。这将在右侧窗格中显示事务的甘特图。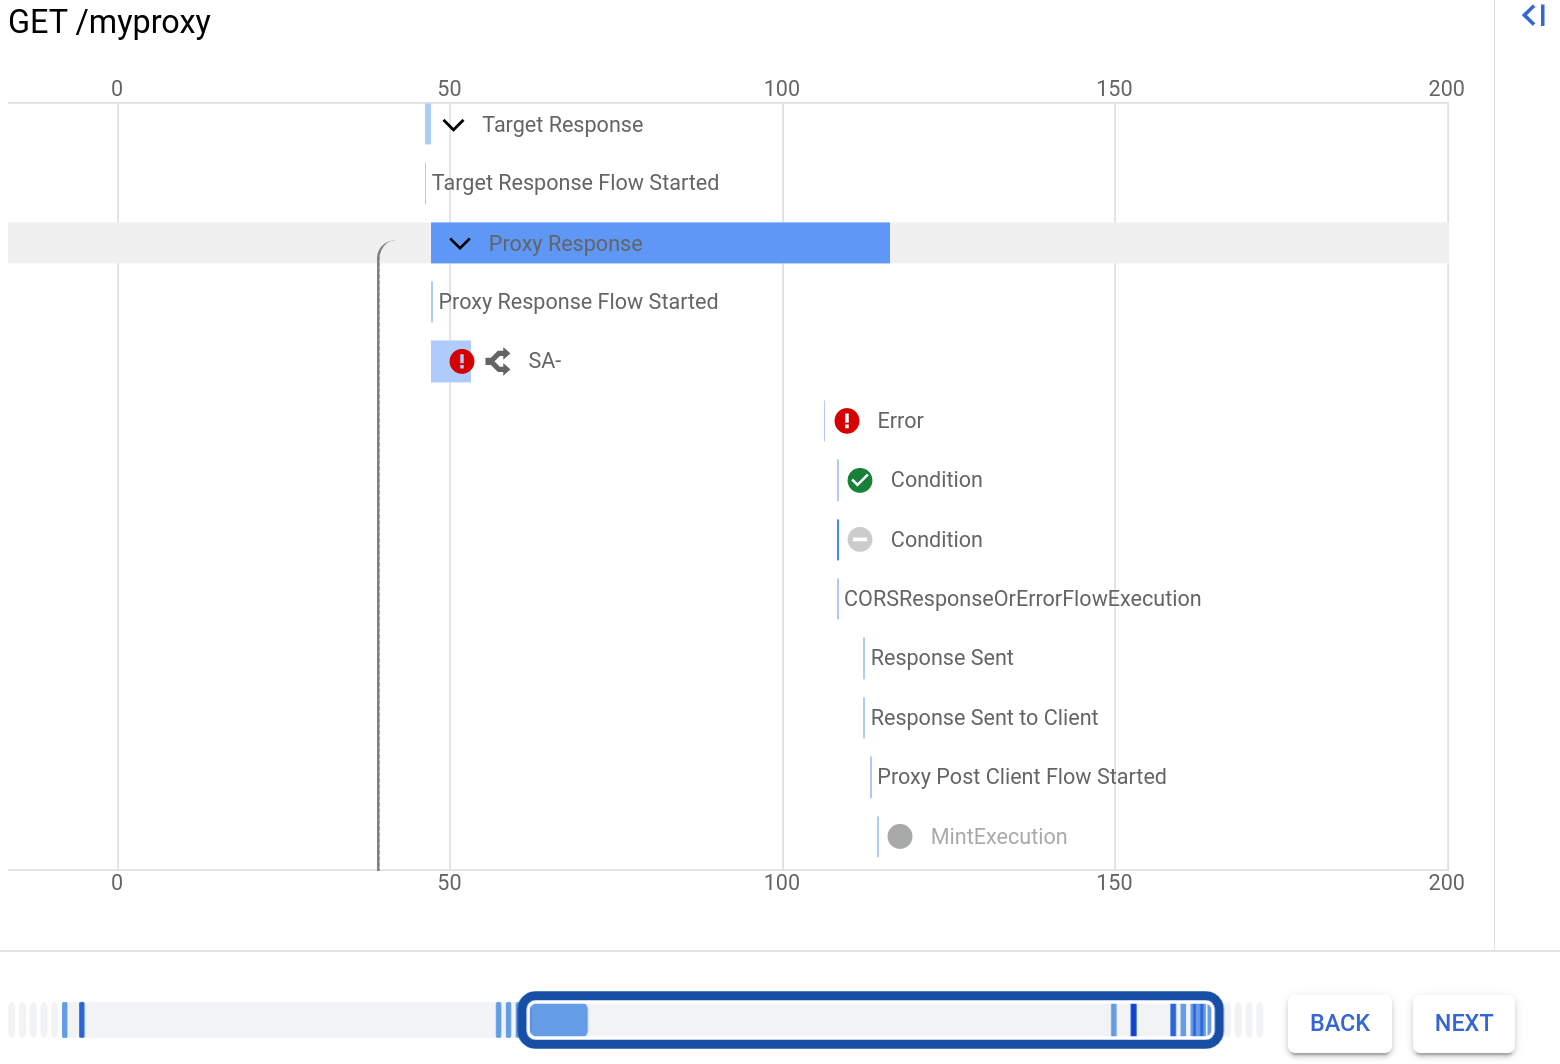
请注意,Splik Arrest 政策有一行,带有错误图标。
点击标有错误的行。系统会在图表右侧显示错误详细信息。下图显示了错误详细信息的属性部分:
在该对话框中:
您可以点击甘特图下方的返回和下一步按钮,以在流的各个步骤之间切换,并查看每个步骤的详细信息。
如需将整个调试会话下载为单个文档,请点击下载会话。 调试会话在完成后的 24 小时内删除,因此,如果您希望在该时间之后查看该会话,则需要在此之前下载调试会话。
经典版界面
- 在 API 代理的开发标签页上,将 Spkeke Arrest 政策的
<Rate>再次修改为 1pm,然后保存 代理。这样,您就可以查看成功和失败的(超过限制)API 调用。 - 在代理编辑器中,点击调试标签页。
- 在启动调试会话下,选择要在其中部署代理的环境。
- 点击启动调试会话。
-
使用
curl(或在网络浏览器中输入网址)再次调用 API 代理,直到您在 Debug Transactions 窗格中看到至少一个200响应和一个429响应。curl -v https://YOUR_ENV_GROUP_HOSTNAME/my-proxy
其中,
YOUR ENV_GROUP_HOSTNAME是环境组主机名。请参阅查找环境组主机名。200响应和429响应如下所示。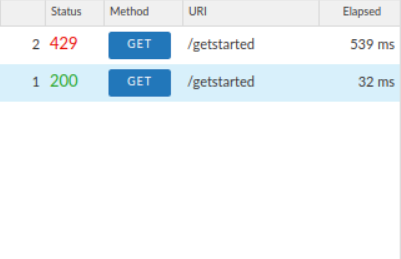
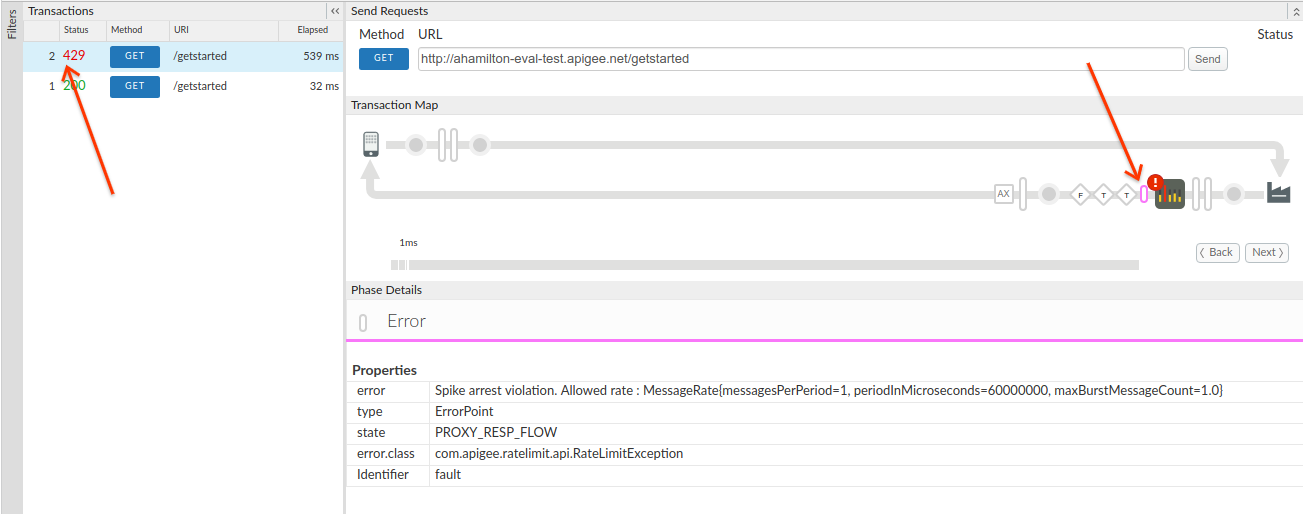
- 点击左侧事务窗格中的
200事务。其调试详细信息会加载到事务示意图 (Transaction Map) 下的主窗口中,其中显示请求/响应图。Syke Arrest 图标位于请求流程中。 - 在流程图中,点击响应中的圆形图标,即最右侧的图标(如下图所示)。
阶段详情窗格将显示流程中此时可用的数据。如果滚动浏览该窗格,您会看到 HTTP 响应标头和正文内容。
- 现在请查看调试中的错误。
点击“事务”窗格中的
429事务。在主编辑器窗口中,您会看到一个流程图,仅显示请求中的项目,其中包括 Skeke Arrest 图标以及一个表示错误的红色感叹号。点击 Sprike Arrest 图标右侧的小管状错误图标,然后查看阶段详情窗格中的 Sprike Arrest 违规详情。
您可以点击流程图中的返回和下一步按钮,在流程中的各个点之间移动并查看调试详细信息。
如果您希望在一个文档中查看整个调试会话,请点击下载调试会话进行下载。
如需了解详情,请参阅使用调试。