本頁內容適用於 Apigee 和 Apigee Hybrid。
查看
Apigee Edge 說明文件。

這個資訊主頁會顯示哪些資訊?
地圖資訊主頁會追蹤不同地理位置的流量模式、錯誤模式和服務品質。您可以查看所有 API 的相關資訊,或深入瞭解特定 API。這個資訊主頁可協助您評估:
- API 成長趨勢 - 使用「流量總和」指標,瞭解流量來源。使用不同時間範圍,即可查看哪些國家/地區在哪些時間產生最多流量。你也可以記錄不同時間範圍的流量比率,藉此查看成長趨勢。
- 錯誤趨勢 - 使用「錯誤計數總和」指標,瞭解 API 錯誤的來源。使用不同時間範圍,即可查看哪些國家/地區在哪些時間產生最多錯誤。您也可以記錄不同時間範圍的錯誤率,藉此查看成長趨勢。
- 服務品質 - 使用「平均總回應時間」和「平均目標回應時間」指標,瞭解後端服務在各國家/地區的成效。
全球訪客分布圖資訊主頁
如要存取地域地圖資訊主頁,請按照下列步驟操作:
在 Google Cloud 控制台中,依序前往「Analytics」>「End user analysis」>「Geomap」頁面。
資訊主頁隨即開啟,如下所示:
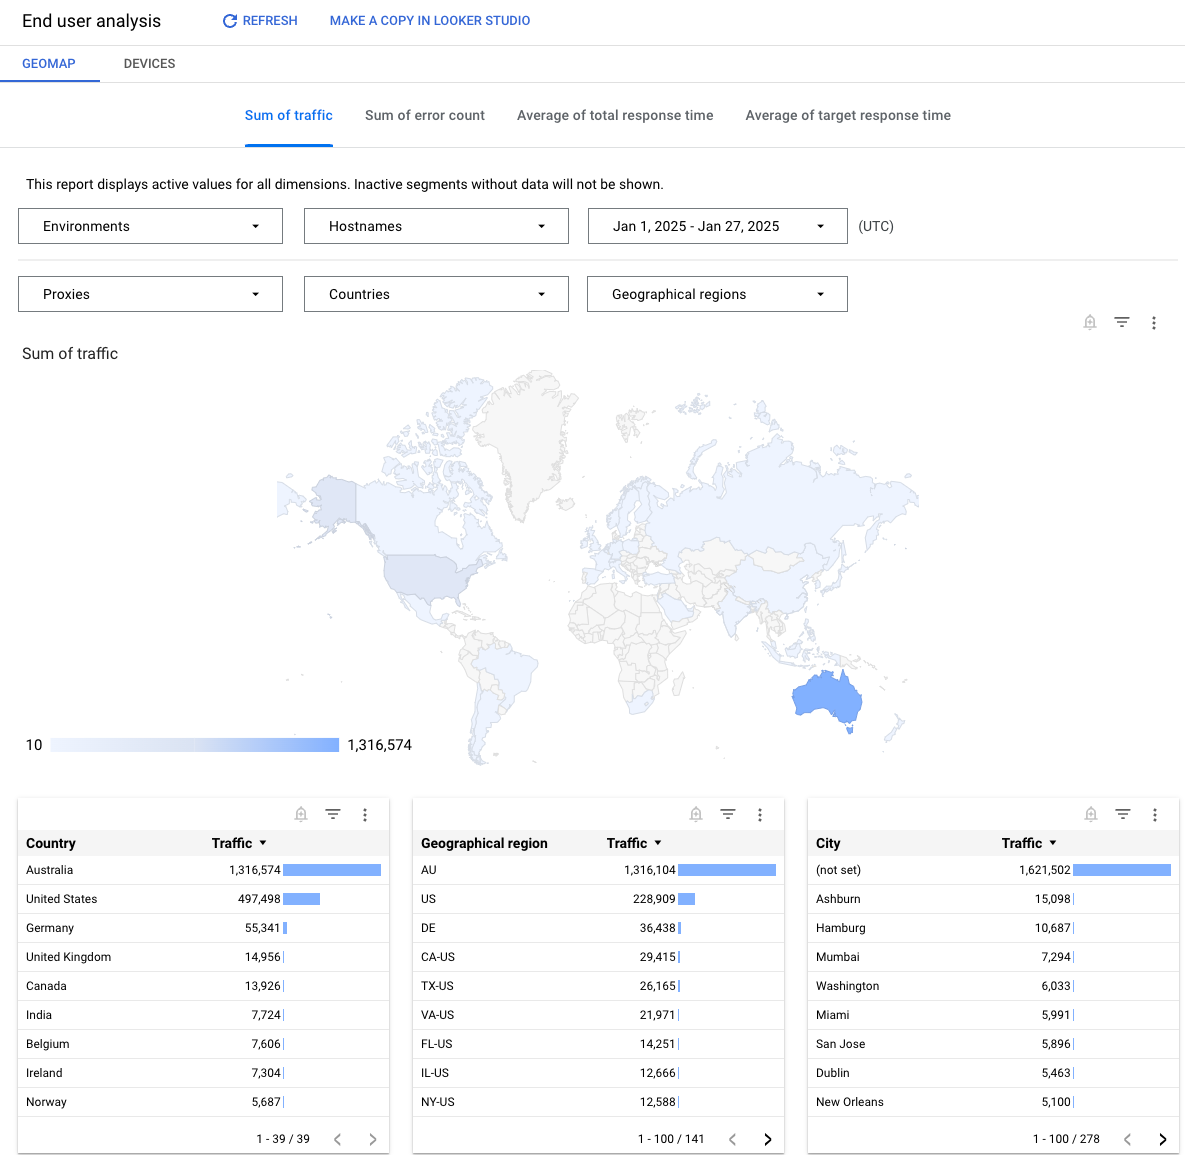
這個資訊主頁會評估哪些資料?
根據預設,資訊主頁會顯示「流量總和」指標。下表說明地域地圖資訊主頁追蹤的各項指標:
| 指標 | 說明 |
|---|---|
| 流量總和 | 也稱為輸送量。機構看到的 API 要求和產生的回應數量。 |
| 錯誤數總和 | 所有不成功的 API 要求總數,也就是要求未傳送使用者所需的回應。 |
| 總回應時間的平均值 | API 回應傳入要求所需的時間。 |
| 目標回覆時間的平均值 | 目標端點在所選時間範圍內,回應傳入要求的平均時間。 |
使用資訊主頁
資訊主頁提供一組下拉式選單,可用於篩選顯示的資訊。篩選器下拉式選單是動態的。 舉例來說,如果您從「環境」下拉式選單中選取環境,系統就會在其他下拉式選單、圖表和表格中,自動選取與該環境相關聯的任何 Proxy、主機名稱、國家/地區和區域。詳情請參閱 Looker Studio 說明文件中的「篩選器屬性簡介」。
使用日期選取器挑選要評估的開始和結束日期。日期選取器只能以天為單位選取日期。時間範圍增量不得小於一天。
地圖是互動式的。按一下國家/地區,即可查看該國家/地區的流量。您可以對資料表按一下滑鼠右鍵,執行排序和匯出資料等動作。
」還有哪些關於這個資訊主頁的注意事項?
根據預設,資訊主頁會顯示所有 API Proxy 的指標。或者,從「Proxies」(Proxy) 下拉式選單中選取要評估的 API Proxy。
在「國家/地區」和「地理區域」清單中選取項目,即可深入瞭解特定國家/地區、州和城市 (視您感興趣的國家/地區而定)。舉例來說,您可以查看美國的資料,然後選取地理區域,並查看產生流量的城市清單。按一下表格中的城市名稱,即可查看該城市的流量。
這個資訊主頁使用標準控制項,例如日期選取器、將滑鼠游標懸停在地圖上可查看更多背景資訊,以及將資料匯出為 CSV 檔案等。詳情請參閱「使用數據分析資訊主頁」一文。
在 Looker Studio 中建立副本
您可以在 Looker Studio 中編輯、儲存及共用資訊主頁副本。使用方式如下:
- 按一下「在 Looker Studio 中建立副本」。
- 在下拉式選單中選取要複製的報表。
- 在 Looker Studio 中,按一下「儲存並共用」。
- 按一下「確認並儲存」。
您現在可以編輯儲存在使用者帳戶中的副本。如要瞭解如何使用 Looker Studio 編輯及建立報表,請參閱 Looker Studio 說明文件。