本頁內容適用於 Apigee 和 Apigee Hybrid。
查看
Apigee Edge 說明文件。

透過 Analytics 資訊主頁,您可以一目瞭然地查看及偵測 API 生態系統的變化。您可以查看一段時間內的變化,有助於找出問題並迅速採取修正措施。
如要快速瞭解 API 數據分析、使用者和使用原因,請參閱 Apigee API 數據分析總覽。
您可以從資訊主頁瞭解哪些資訊?
API 流量是否突然暴增或暴跌?哪些應用程式開發人員最成功?開發人員採用您 API 的比率為何?哪些 API 方法最熱門?Analytics 資訊主頁專門用來回答這類問題。
在背景中,Apigee 會在資料通過 API 時收集資訊。這些資訊主頁提供強大的方式,可立即使用這項資料。如果圖表顯示您感興趣的內容、異常狀況或突然變化,您可以深入瞭解,找出所需的所有詳細資料。如果發現特定開發人員發生大量錯誤或流量突然下降,可以主動與該開發人員聯絡。資訊主頁可提供 API 的深入分析資訊,讓您採取行動。
接收資料的延遲間隔為何?
我可以自訂資訊主頁嗎?
可以。許多資訊主頁都提供選項,讓您選取要分析的指標、日期範圍、資料彙整間隔,以及許多其他變數。如果內建資訊主頁不符合需求,您可以建立自訂報表,也就是選取要分析的分析維度和指標,然後建立的資訊主頁。自訂報表可讓您「深入探究」API 的分析資料,直到達到所需的精細程度為止。
資訊主頁最常見的功能有哪些?
資訊主頁提供一系列常見功能,包括設定時間範圍、在圖表上按一下並拖曳來縮放、將滑鼠游標懸停在圖表和其他區域上查看詳細資料,以及選取器,可選擇要在圖表中顯示的資料。只要瞭解如何使用其中一種資訊主頁,就能輕鬆使用其他資訊主頁。
下圖標示出這些常見功能區域:
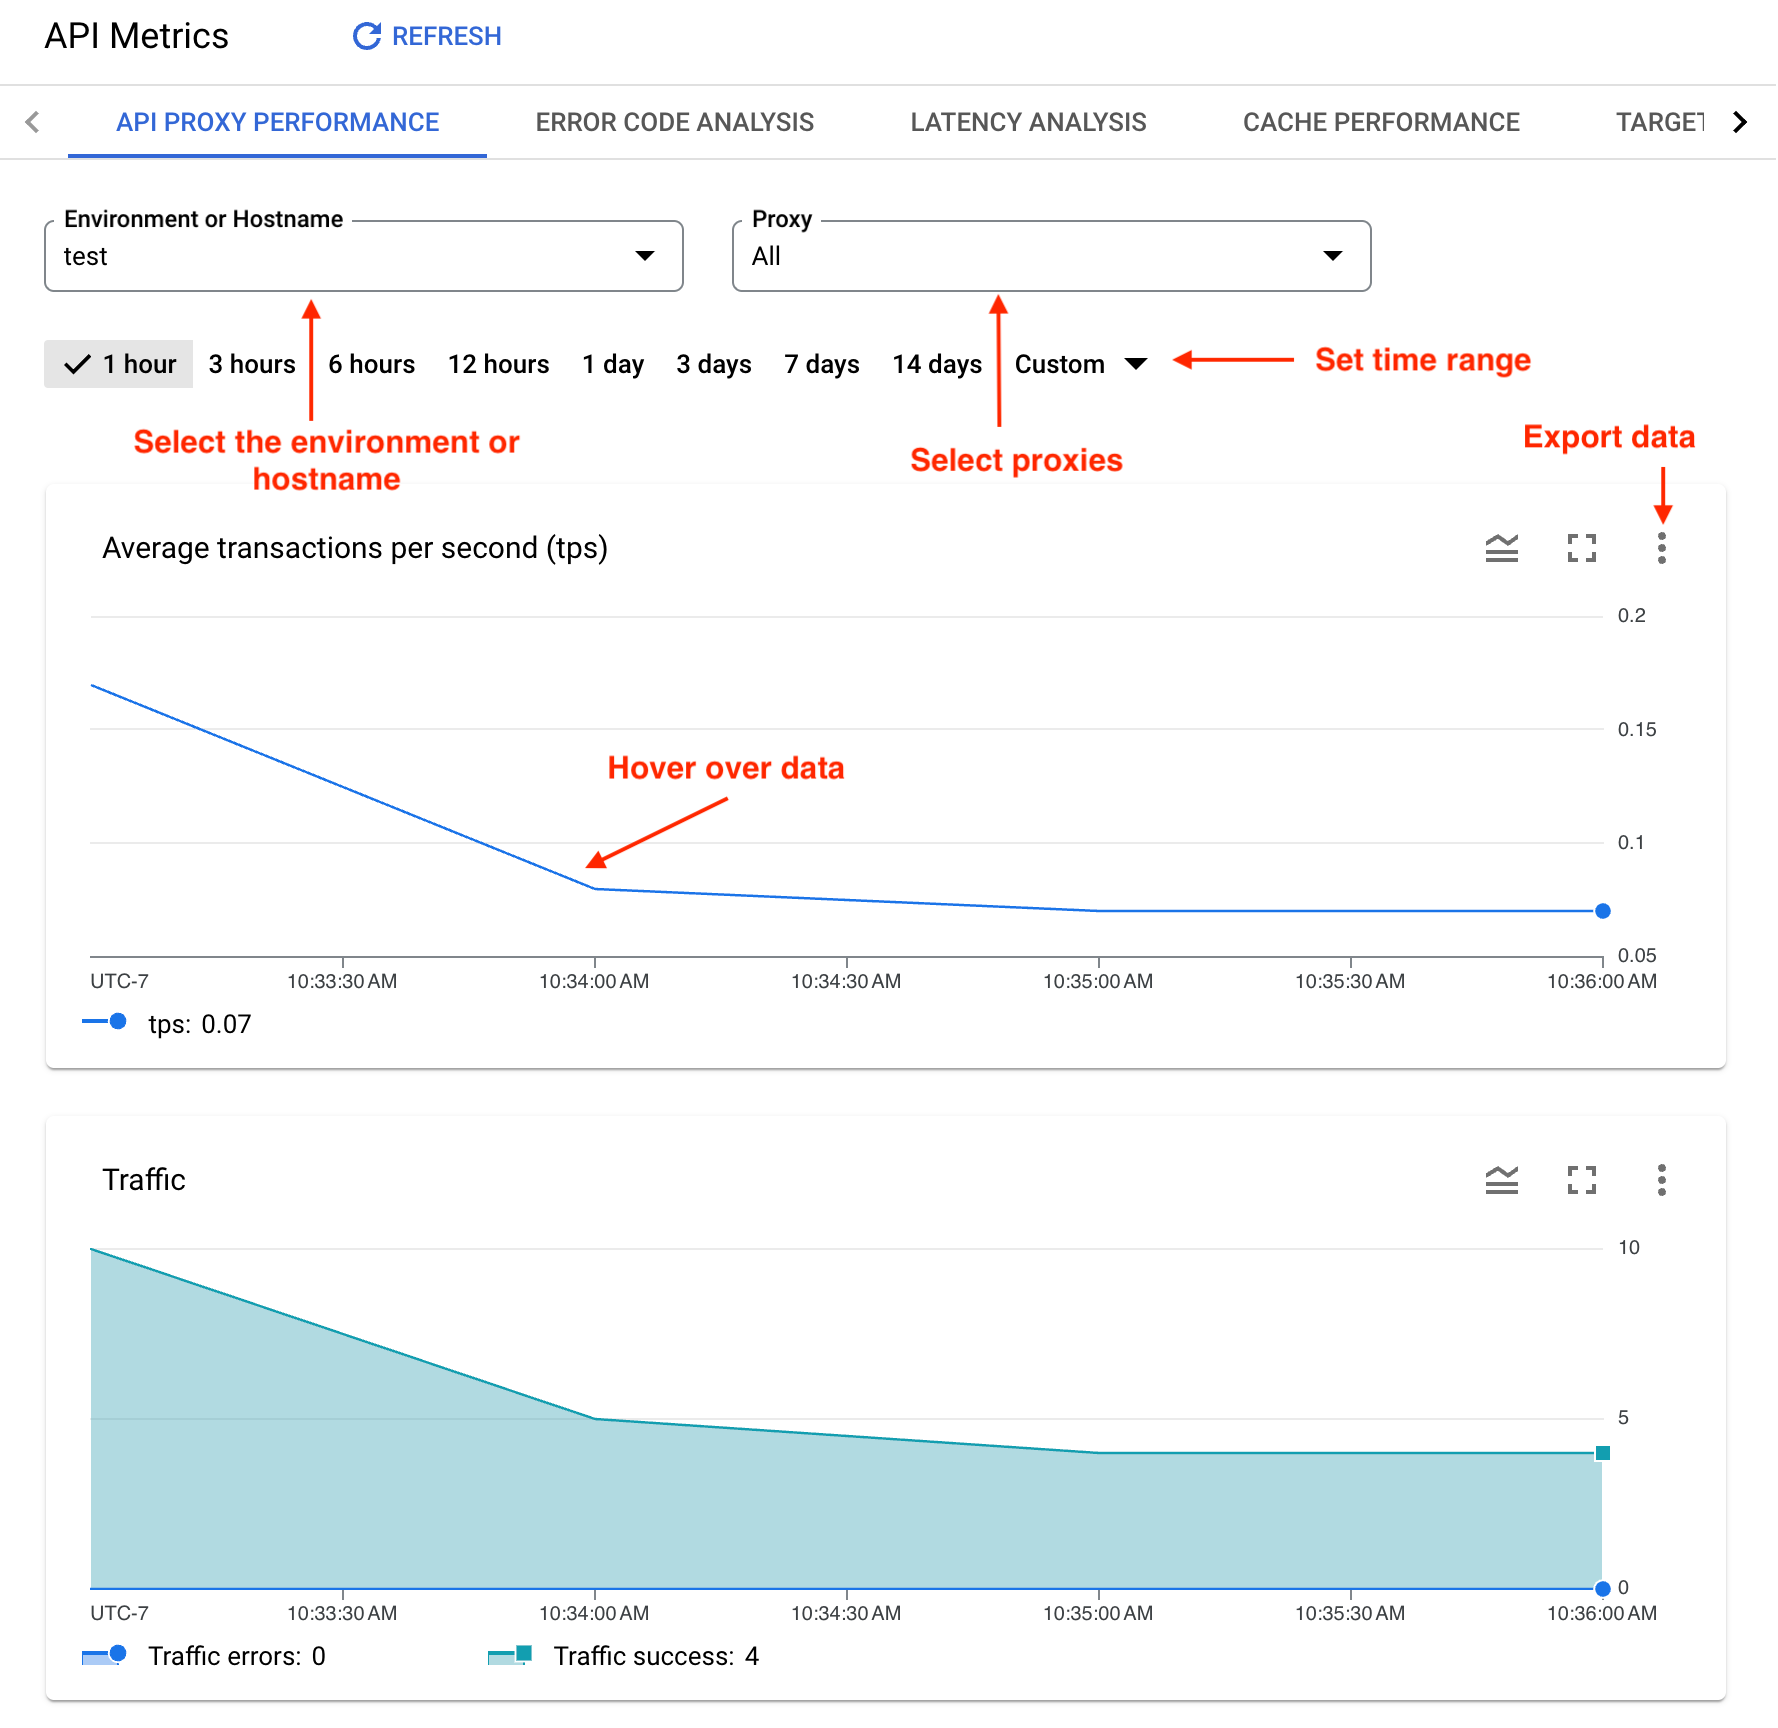
- 環境或主機名稱:選取機構中的環境或主機名稱。
-
設定時間範圍:設定資訊主頁顯示資料的時間範圍。
- 放大:按一下並拖曳圖表區域,即可放大圖表資料。拖曳完成後,圖表會放大顯示所選區域。
- 將資料匯出至檔案:下載內含圖表資料集的單一 CSV 檔案。
- 將滑鼠游標懸停在圖表上:將滑鼠游標懸停在圖表上的任一點,即可查看該點資料的背景資訊。