本页面适用于 Apigee 和 Apigee Hybrid。
查看 Apigee Edge 文档。

此信息中心可以提供什么信息?
“流量构成”信息中心衡量主要 API、应用、开发者和产品对整体 API 项目的相对贡献。
使用此报告来检测业务问题,例如流量趋势或主要应用和开发者所做的贡献。您可以根据这些数据决定采取哪些纠正措施。此外,您还可以提前收到对 API 流量做出贡献的新实体的通知,并采取响应措施 - 例如,您可以确定哪些新开发者贡献大,并他们添加到培养计划中。
流量构成信息中心
如需访问“流量构成”信息中心,请执行以下操作:
在 Google Cloud 控制台中,依次前往分析 > 开发者分析 > 流量构成页面。
信息中心将打开,如下所示:
使用信息中心
信息中心包含一组下拉菜单,您可以使用这些下拉菜单过滤信息中心中显示的信息。过滤条件下拉菜单是动态的。例如,如果您从“开发者”下拉菜单中选择某个开发者,则与该开发者关联的所有代理、应用和 API 产品都会在其他下拉菜单、图表和表格中自动选中。如需了解详情,请参阅 Looker Studio 文档中的过滤条件属性简介。
使用日期选择器选择要衡量的开始日期和结束日期。日期选择器仅允许您以天为单位选择日期。您无法选择小于一天的时间范围增量。
此信息中心衡量的是什么?
此信息中心提供两种衡量模式,您可以使用概览和维度标签页选择这两种模式:
| 模式 | 说明 |
|---|---|
| 概览 | 可让您快速了解代理、开发者应用、产品和开发者的流量模式。例如,使用此视图可查看哪个代理、应用、产品或开发者产生最多的流量。 |
| 维度 | 让我们深入地了解代理、开发者应用、产品和开发者流量的详细信息。 |
“概览”模式可以提供什么信息
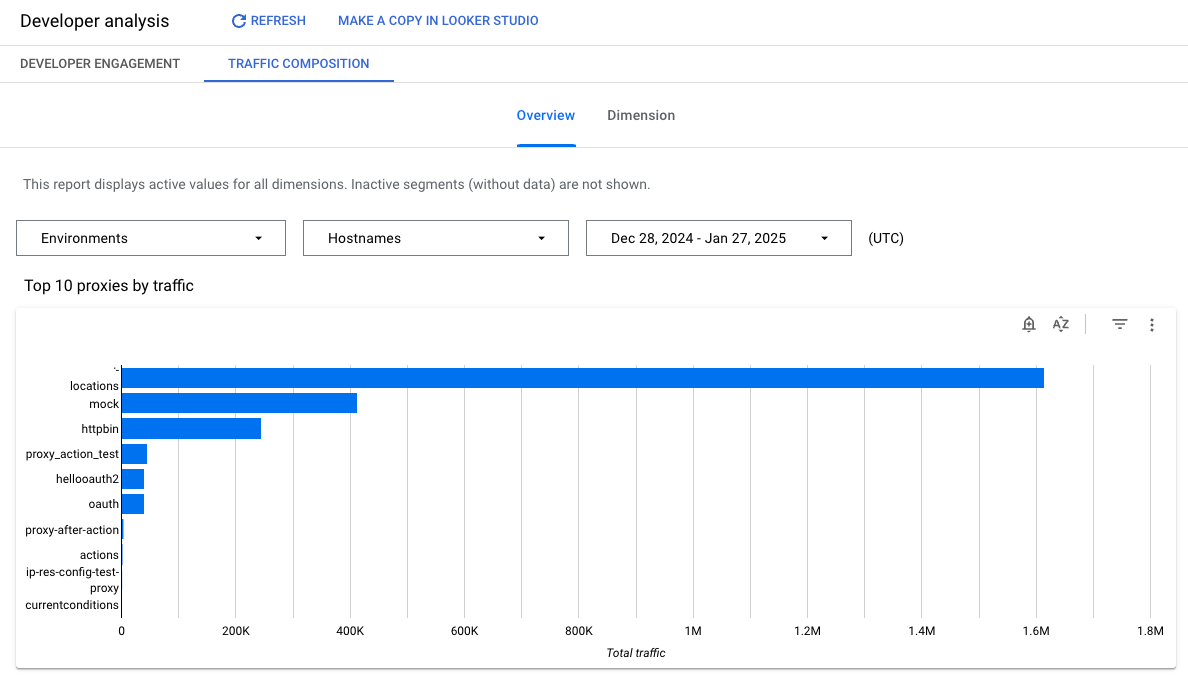
点击概览可显示此模式。此模式会呈现一组直接图表,显示流量模式代理、开发者应用、开发者和产品。
下图显示了流量构成概览页面的一部分内容:
| 模式 | 说明 |
|---|---|
| 按流量排序的前 10 个代理 | 显示按 API 流量衡量的 10 大代理。 |
| 按流量排序的前 10 个开发者 | 显示按 API 流量衡量的 10 大开发者。 |
| 按流量排序的前 10 个产品 | 显示按 API 流量衡量的 10 大产品。 |
| 按流量排序的前 10 个应用 | 显示按 API 流量衡量的 10 大开发者应用。 |
“维度”模式提供的信息
点击维度可显示此模式。通过此模式,您可以深入了解特定代理、开发者应用、开发者和产品的流量模式详细信息。
“维度”模式中显示的详细信息包括:
| 指标 | 说明 |
|---|---|
| 代理的不同时间段的流量 | 让您可以查看每个代理的相对流量贡献。 |
| 不同时间段的开发者流量 | 让您可以查看每个开发者的相对流量贡献。 |
| 不同时间段的产品流量 | 让您可以查看每个 API 产品的相对流量贡献。 |
| 不同时间段的应用流量 | 让您可以查看每个开发者应用的相对流量贡献。 |
在 Looker Studio 中创建副本
您可以在 Looker Studio 中修改、保存和共享信息中心副本。若要开始使用,请执行以下操作:
- 点击在 Looker Studio 中制作副本。
- 从下拉菜单中选择要复制的报告。
- 在 Looker Studio 中,点击保存并共享。
- 点击确认并保存。
现在,您可以修改以您的用户账号保存的副本。如需详细了解如何使用 Looker Studio 修改和创建报告,请参阅 Looker Studio 文档。