이 페이지는 Apigee 및 Apigee Hybrid에 적용됩니다.
Apigee Edge 문서 보기

작업 이상치 개요
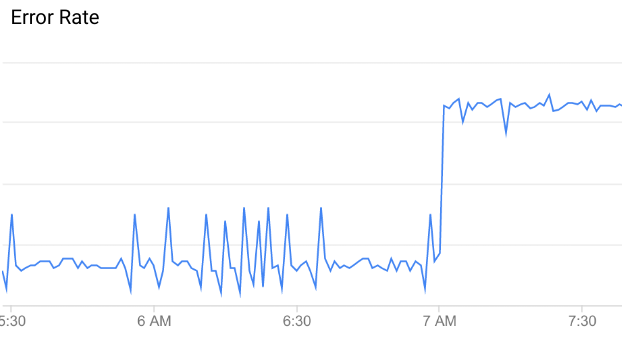
작업 이상치는 최근 데이터 패턴을 기준으로 API에서 비정상적이거나 예기치 않은 API 데이터 패턴을 식별합니다. 예를 들어 이 API 오류율 그래프에서 오류율은 오전 7시에 갑자기 증가합니다. 이 시점까지의 데이터와 비교했을 때 이러한 증가는 이상으로 분류하기에 충분할 정도로 비정상적입니다.
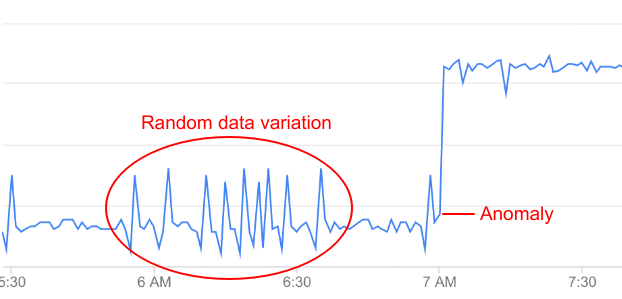
API 데이터의 모든 변동이 이상을 나타내는 것은 아닙니다. 대부분은 무작위 변동입니다. 예를 들어 오류율에서 최대한의 경우 이상으로 여겨질 수 있는 사소한 편차가 나타나더라도 이것만으로는 이상으로 분류하기에 충분하지 않습니다.
작업 이상치에서는 API 데이터를 지속적으로 모니터링하고 통계 분석을 수행하여 실제 이상을 데이터의 무작위 변동과 구분합니다.
작업 이상치는 다음과 같은 이상 유형을 자동으로 감지합니다.
- 조직, 환경, 리전 수준에서 HTTP 503 오류 증가
- 조직, 환경, 리전 수준에서 HTTP 504 오류 증가
- 조직, 환경, 리전 수준에서 모든 HTTP 4xx 또는 5xx 오류 증가
- 조직, 환경, 리전 수준에서 90번째 백분위수(p90)에 대한 총 응답 지연 시간 증가
감지된 이상에는 다음 정보가 포함됩니다.
- 프록시 지연 시간이나 HTTP 오류 코드와 같은 이상을 일으킨 측정항목입니다.
- 이상의 심각도입니다. 심각도는 모델의 신뢰도 수준에 따라 적음, 보통, 심각일 수 있습니다. 신뢰도 수준이 낮으면 심각도가 적음을 나타내고 높은 신뢰도 수준은 심각함을 나타냅니다.
작업 이상치 사용을 위한 기본 요건
작업 이상치를 사용하려면 다음 단계를 따르세요.
- 조직에 AAPI Ops 부가기능이 사용 설정되어 있어야 합니다. 조직에서 AAPI 작업 사용 설정을 참조하세요.
- Operations Anomalies 사용자는 AAPI Ops에 필요한 역할이 있어야 합니다.
- 대시보드에서 이상치를 조사하는 사용자에게도
roles/logging.viewer역할이 필요합니다.
감지된 작업 이상치 보기
작업 이상치가 이상을 감지하면 작업 이상치 대시보드에 이상 세부정보가 표시됩니다. API Monitoring 대시보드의 이상을 조사하고 필요한 경우 적절한 조치를 취할 수 있습니다. 또한 나중에 비슷한 이벤트가 발생하면 이를 알리도록 알림을 만들 수도 있습니다.
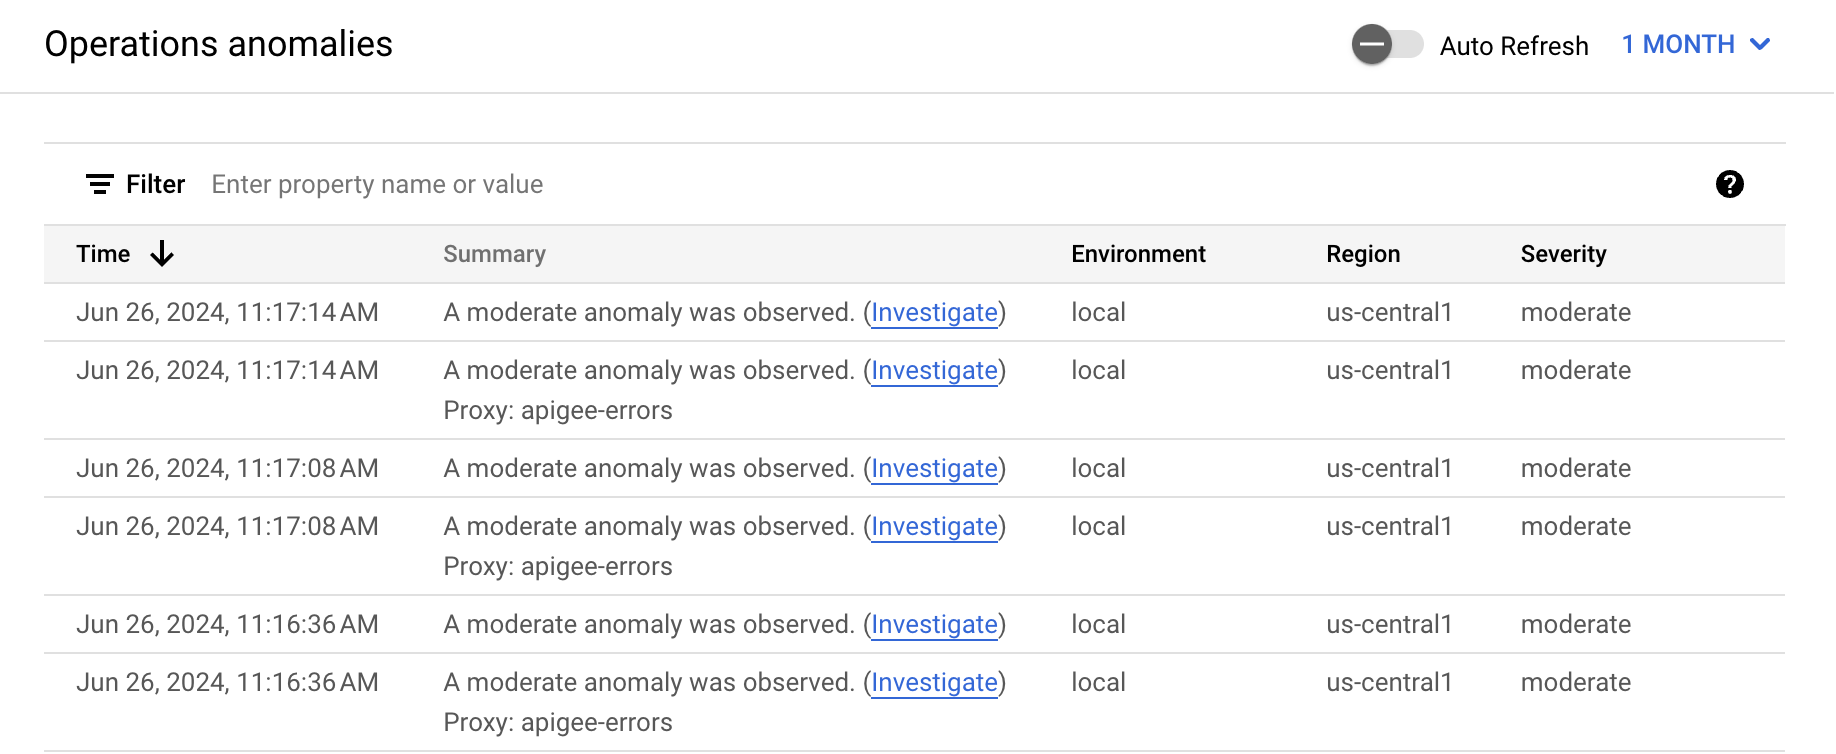
Apigee UI의 작업 이상치 대시보드는 감지된 작업 이상치에 대한 정보의 기본 소스입니다. 최근 이상 목록이 대시보드에 표시됩니다.
작업 이상치 대시보드를 열려면 다음 안내를 따르세요.
Google Cloud 콘솔에서 애널리틱스 > 작업 이상치 페이지로 이동합니다.
- 모니터링하려는 조직으로 전환합니다.
그러면 작업 이상치 대시보드가 표시됩니다.
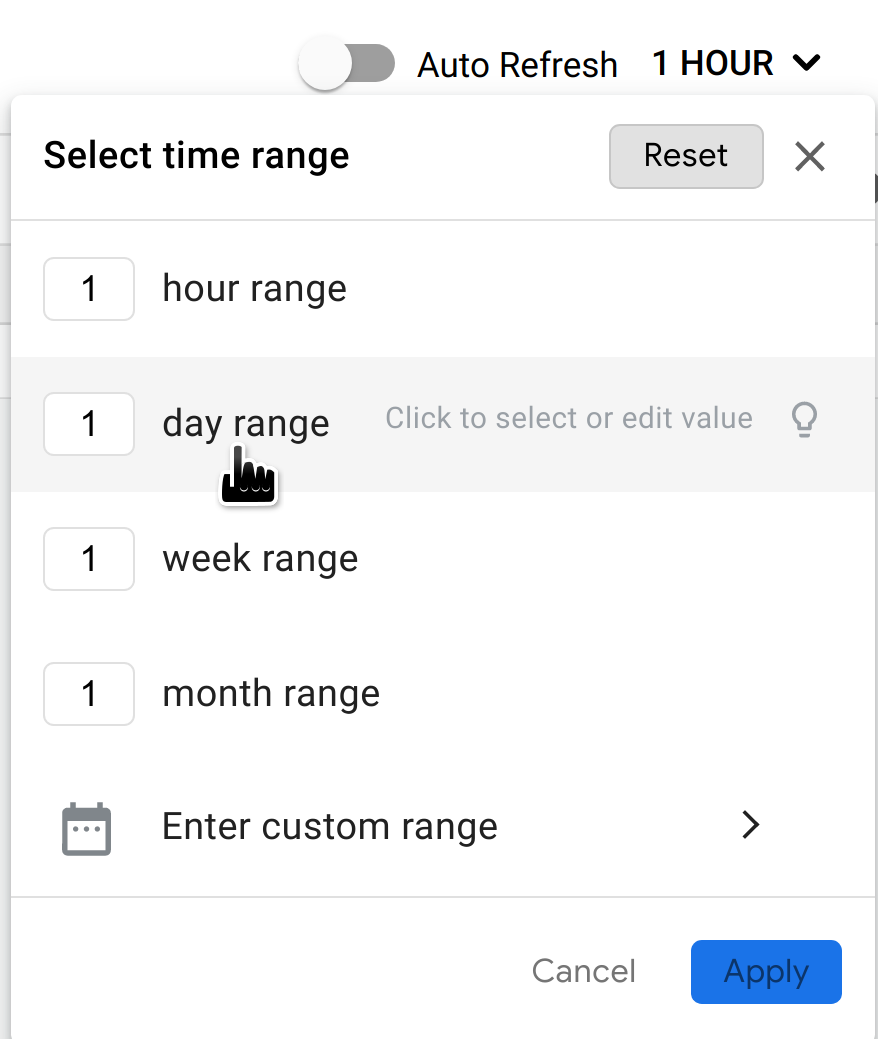
기본적으로 대시보드에는 이전 1시간 동안 발생한 이상이 표시됩니다. 이 기간 동안 이상이 감지되지 않으면 대시보드에 행이 표시되지 않습니다. 대시보드 오른쪽 상단에 있는 기간 메뉴에서 더 큰 기간을 선택할 수 있습니다.
테이블의 각 행은 감지된 이상에 해당하며 다음 정보를 표시합니다.
- 이상 날짜와 시간입니다.
- 발생한 프록시와 이를 트리거한 결함 코드를 포함한 이상에 대한 간단한 요약 설명입니다.
- 이상이 발생한 환경입니다.
- 이상이 발생한 리전입니다.
- 이상의 심각도(경미함, 보통 또는 심각)입니다. 심각도는 이벤트가 우연히 발생할 가능성이 얼마나 낮은지에 대한 통계 척도(p값)를 기반으로 합니다. 이벤트가 발생할 가능성이 낮을수록 심각도가 커집니다.
최근 API 트래픽 데이터의 다양한 그래프를 보여주는 API Monitoring 대시보드에서 이상을 조사할 수도 있습니다.
이상 감지 작동 방식
이상 감지 단계는 다음과 같습니다.
모델 학습
작업 이상치는 이전 시계열 데이터에서 API 프록시 동작의 모델을 학습하는 방식으로 작동합니다. 모델 학습을 위해 개발자가 별도로 취해야 할 조치는 없습니다. Apigee는 지난 6시간 동안의 API 데이터에서 자동으로 모델을 만들고 학습합니다. 따라서 Apigee는 이상치를 로깅하기 전에 모델을 학습하기 위해 API 프록시에 대한 최소 6시간의 데이터가 필요합니다.
학습의 목표는 모델의 정확성을 개선하는 것이며 그런 다음 과거 데이터에서 테스트할 수 있습니다. 모델의 정확성을 테스트하는 가장 간단한 방법은 오류율(거짓양성 및 거짓음성의 합계를 총 예측 이벤트 수로 나눈 값)을 계산하는 것입니다.
이상 이벤트 로깅
런타임에 작업 이상치는 API 프록시의 현재 동작을 모델에서 예측한 동작과 비교합니다. 그런 다음 작업 이상치는 특정 신뢰도 수준을 사용하여 운영 측정항목이 예측 값을 초과하는 시기를 확인할 수 있습니다. 예를 들어 5xx 오류 비율이 모델이 예측하는 비율을 초과할 때입니다.
Apigee는 이상을 감지하면 작업 이상치 대시보드에 이벤트를 자동으로 로깅합니다. 대시보드에 표시되는 이벤트 목록에는 감지된 모든 이상과 트리거된 알림이 포함됩니다.