Esta página se aplica a Apigee y Apigee Hybrid.
Consulta la documentación de
Apigee Edge.

La herramienta Depuración sin conexión te permite ver y analizar las sesiones de depuración "sin conexión" que se descargaron antes en la vista Depuración en el editor de proxy. Una sesión de depuración guardada es en esencia una “grabación” de una sesión de depuración y puede ser útil en los casos en que se requieren soluciones de problemas y análisis adicionales. La IU para la herramienta de depuración sin conexión es similar a la vista de depuración en el editor de proxy.
Para obtener más información sobre la IU de la herramienta de depuración y cómo descargar sesiones de depuración, consulta Usa la depuración.
Consola de Apigee Cloud
Depuración v2 (nuevo)
Para ver los datos de depuración descargados con la depuración sin conexión, sigue estos pasos:
-
En la consola de Google Cloud , ve a la página Proxy development > Offline Debug.
-
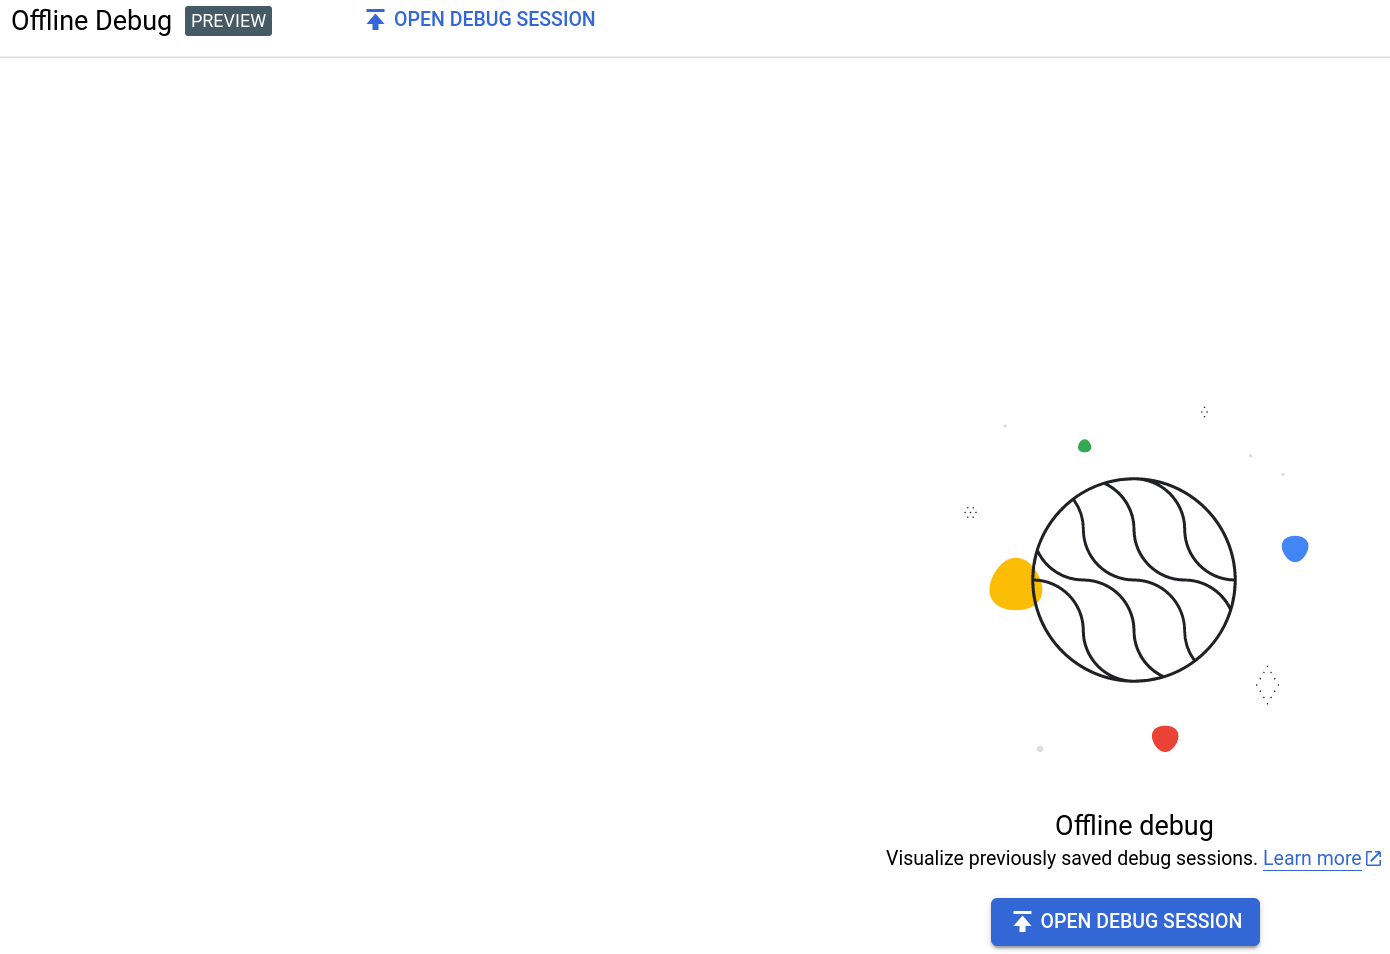
Aparecerá la vista Depuración sin conexión:

Para cargar datos en la vista Depuración sin conexión, haz clic en Abrir sesión de depuración, selecciona un archivo de sesión de depuración sin conexión en formato JSON descargado previamente y, luego, haz clic en Abrir.
Nota: Cuando descargas una sesión de depuración en la vista de Depuración del Editor de proxy, el nombre del archivo de descarga tiene el formato
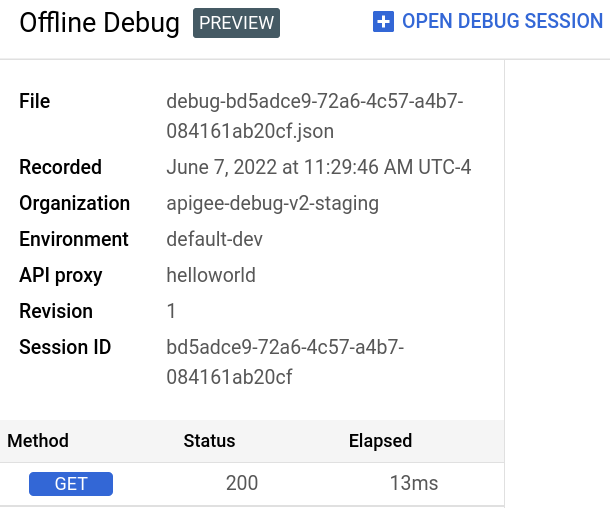
debug-{session ID}.json, en el que{session id}es el ID de la sesión de depuración. Sin embargo, puedes cambiarle el nombre al archivo si lo deseas.La IU de Apigee carga los datos del archivo de depuración y muestra todas las transacciones en la lista del panel Transactions.

- Haz clic en la fila de la transacción en el panel Transacciones para mostrar la transacción en el Mapa de transacciones.

Desde aquí, puedes explorar la sesión de depuración como lo harías con una sesión de depuración recién creada. Consulta Cómo crear una sesión de depuración para obtener más información.
Depuración v1
Para ver los datos de depuración descargados con la depuración sin conexión, sigue estos pasos:
- Accede a la consola deGoogle Cloud .
- En el menú principal, seleccione API Proxies:
Selecciona Develop > Offline Debug.
Aparecerá la vista Depuración sin conexión:
Para cargar datos en la vista Depuración sin conexión, haz clic en el botón Abrir sesión de depuración y selecciona un archivo de sesión de depuración sin conexión en formato JSON descargado previamente.
Nota: Cuando descargas una sesión de depuración en la vista de Depuración del Editor de proxy, el nombre del archivo de descarga tiene el formato "debug-{session ID}.json", en el que {session id} es el ID de la sesión de depuración. Sin embargo, puedes cambiar el nombre del archivo si lo deseas.
La IU de Apigee carga los datos del archivo de depuración y muestra una fila nueva para la transacción en el panel de la izquierda.
- Haz clic en la fila de la transacción en el panel de la izquierda para mostrar un diagrama de Gantt de
la transacción en un
diagrama de Gantt.
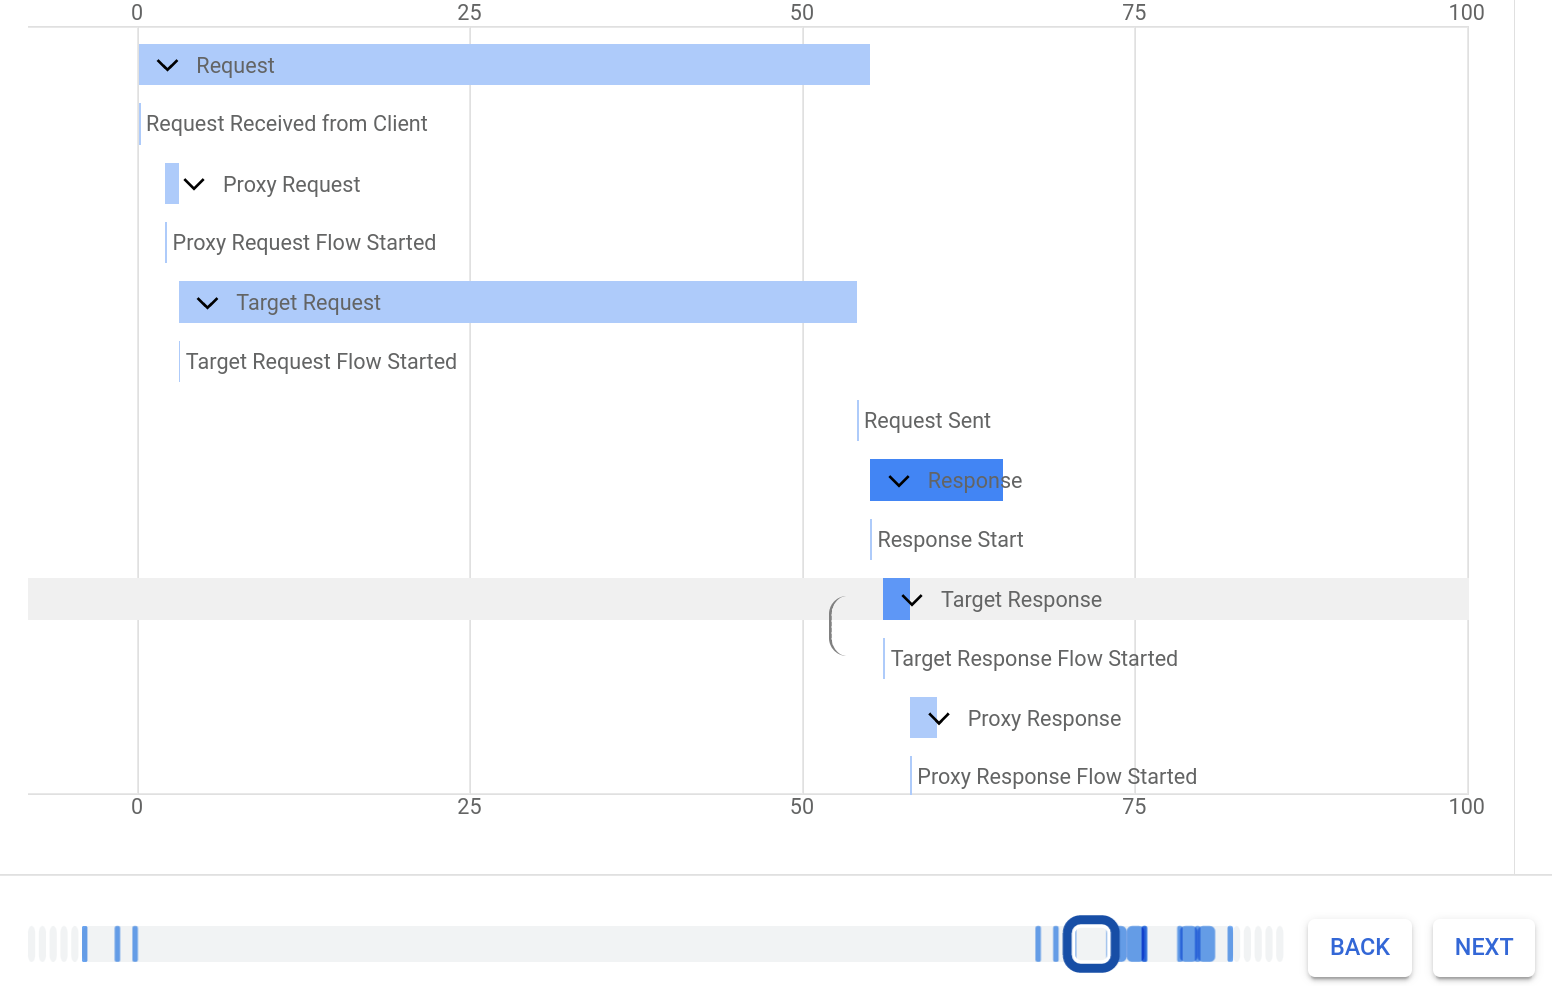
Desde aquí, puedes explorar la sesión de depuración como lo harías en la vista Depuración en el nuevo Editor de proxy. Consulta la sección "Visualiza el diagrama de Gantt para una solicitud y una respuesta".
IU clásica
Para ver los datos de depuración descargados con la depuración sin conexión, sigue estos pasos:
- Accede a la IU de Apigee.
- En el menú principal, seleccione API Proxies:
Selecciona Develop > Offline Debug.
Aparecerá la vista Depuración sin conexión:
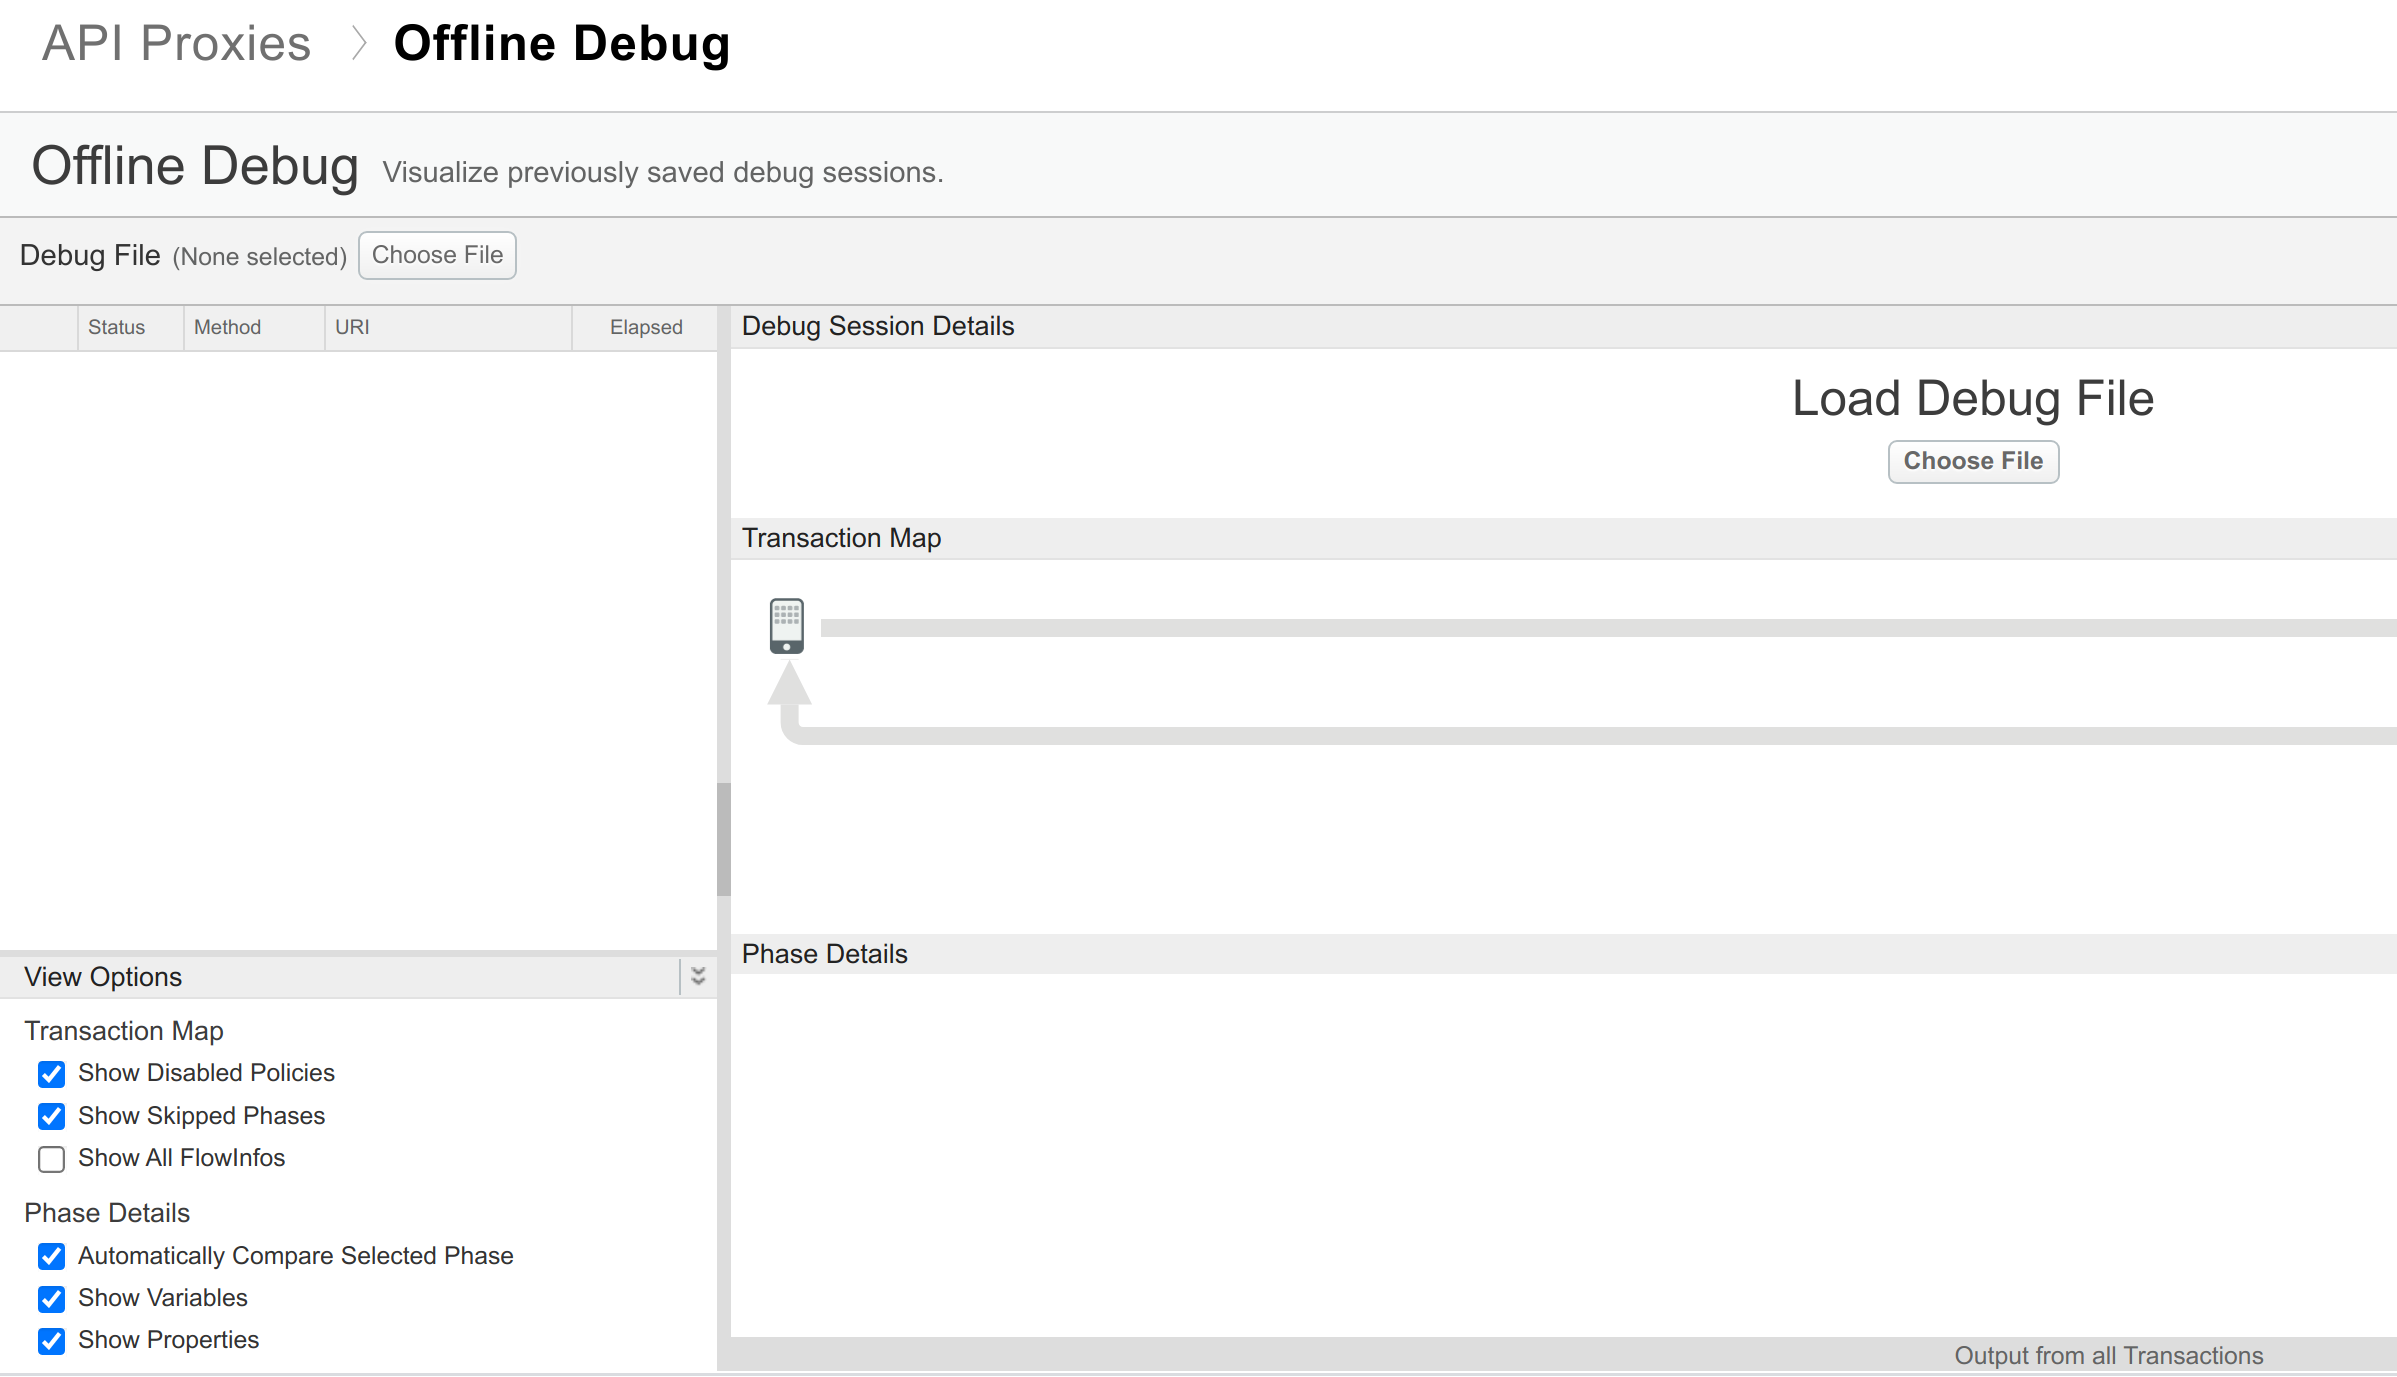
Ten en cuenta las siguientes regiones de la vista Depuración sin conexión:
- Debug file: Muestra el tipo de solicitud. Usa esta área para navegar entre las solicitudes.
- View Options: Muestra las opciones de configuración, como se describe en Usa la depuración.
- Debug Session Details: Muestra detalles sobre la sesión de depuración.
- Transactions Map: Muestra la ruta de la solicitud a través del proxy de API. Esta ruta se conoce como mapa de transacciones. Muestra qué políticas se encontraron y si se produjeron errores durante su ejecución.
- Phase Details: Muestra los encabezados de la solicitud seleccionada actualmente.
Cuando visualizas datos de depuración en la IU de Apigee, puedes activar o desactivar varias opciones, por ejemplo, para ver políticas inhabilitadas o variables y propiedades. Para obtener más información, consulta Depura con la herramienta de depuración.
Para cargar datos en la vista Depuración sin conexión, haz clic en el botón Elegir archivo en el panel izquierdo de la herramienta Depuración sin conexión y selecciona un archivo de sesión de seguimiento sin conexión en formato JSON descargado previamente.
Nota: No uses el botón Elegir archivo en el panel derecho, ya que no acepta archivos JSON.
La IU de Apigee carga los datos del archivo de depuración y los muestra.