API 트래픽이 갑자기 증가하거나 저하되었나요? 가장 성공한 앱 개발자는 누구인가요? 개발자들 간의 API 채택 비율은 얼마인가요? 가장 인기 있는 API 메서드는 무엇인가요? 애널리틱스 대시보드는 이러한 질문에 답변을 제시할 수 있도록 디자인되었습니다.
Apigee는 데이터가 API를 통과할 때 백그라운드에서 정보를 수집합니다. 대시보드는 이 데이터를 즉시 사용할 수 있는 강력한 방법을 제공합니다. 그래프 또는 차트에서 관심 항목이나 이상값 또는 급격한 변화가 발견된 경우 필요한 만큼 이를 세부적으로 확인할 수 있습니다. 특정 개발자에게 많은 오류가 발생하거나 트래픽이 갑자기 저하되는 것이 확인된 경우 해당 개발자에게 미리 연락할 수 있습니다. 대시보드에서 API에 대한 정보를 확인하여 적절한 조치를 취할 수 있습니다.
데이터 수신 지연 시간은 얼마나 걸리나요?
대시보드를 맞춤설정할 수 있나요?
예, 많은 대시보드에서 분석할 측정항목, 날짜 범위, 데이터 수집 간격, 기타 여러 변수를 선택할 수 있습니다. 기본 제공되는 대시보드가 사용자 요구에 맞지 않으면 분석 측정기준 및 분석하려는 측정항목을 선택하여 만드는 대시보드인 커스텀 보고서를 만들 수 있습니다. 커스텀 보고서를 사용하면 필요한 세분성을 얻을 때까지 API의 분석 데이터로 '드릴다운'할 수 있습니다.
대시보드에서 가장 일반적인 기능은 무엇인가요?
대시보드에는 기간 설정, 클릭 및 드래그로 차트 확대, 차트 및 기타 리전에서 마우스 커서를 위로 가져가서 표시되는 세부정보, 차트에 표시할 데이터 선택 등 여러 일반 기능이 포함되어 있습니다. 한 종류의 대시보드 사용법에 익숙해지면 다른 대시보드도 쉽게 사용할 수 있습니다.
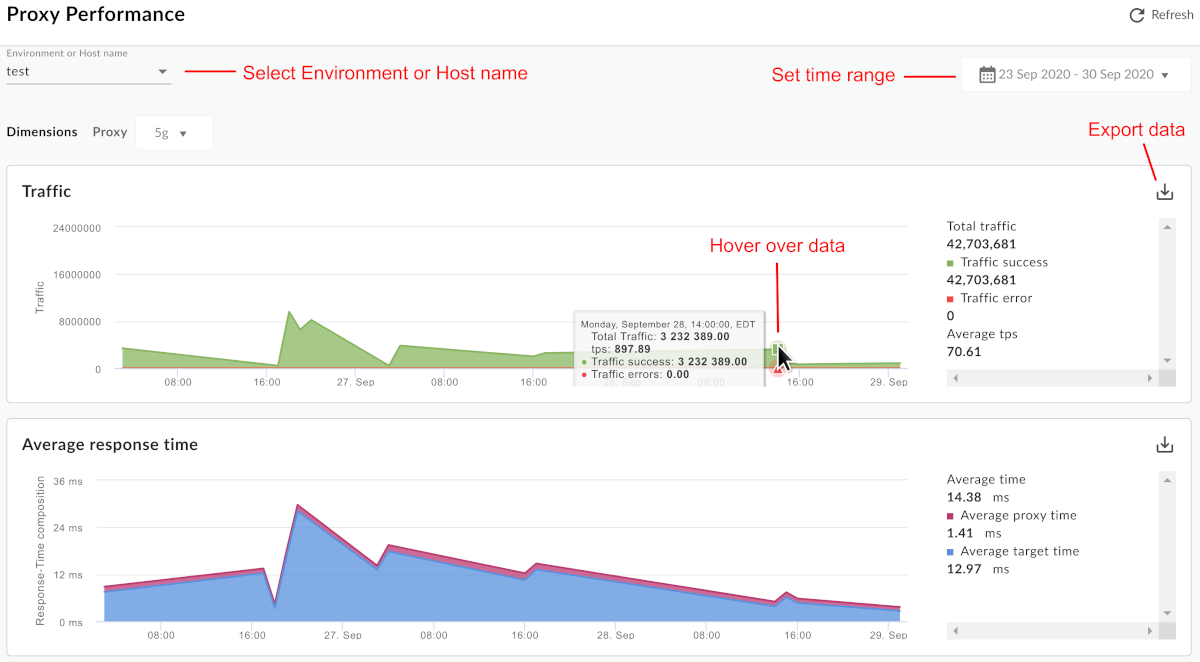
다음 그림은 몇 가지 일반적인 기능 영역을 보여줍니다.
환경 또는 호스트 이름 - 조직의 환경 또는 호스트 이름을 선택합니다.
기간 설정 - 대시보드에 데이터가 표시되는 기간을 설정합니다.
확대 - 차트의 한 리전을 클릭하고 드래그하여 차트 데이터를 확대할 수 있습니다. 드래그를 완료하면 차트가 선택된 리전으로 확대됩니다.
파일로 데이터 내보내기 - 차트 데이터 집합이 포함된 단일 CSV 파일을 다운로드합니다.
그래프 위로 마우스 가져가기 - 그래프 위의 한 지점으로 마우스를 가져가서 해당 지점의 데이터에 대한 추가 정보를 확인할 수 있습니다.
[[["이해하기 쉬움","easyToUnderstand","thumb-up"],["문제가 해결됨","solvedMyProblem","thumb-up"],["기타","otherUp","thumb-up"]],[["이해하기 어려움","hardToUnderstand","thumb-down"],["잘못된 정보 또는 샘플 코드","incorrectInformationOrSampleCode","thumb-down"],["필요한 정보/샘플이 없음","missingTheInformationSamplesINeed","thumb-down"],["번역 문제","translationIssue","thumb-down"],["기타","otherDown","thumb-down"]],["최종 업데이트: 2025-08-18(UTC)"],[[["\u003cp\u003eApigee Analytics dashboards provide a quick overview of API ecosystem changes, helping users identify issues and take swift corrective actions.\u003c/p\u003e\n"],["\u003cp\u003eThe dashboards enable users to analyze API traffic patterns, developer success rates, and API method popularity, offering insights to answer key questions about API usage.\u003c/p\u003e\n"],["\u003cp\u003eWhile data is collected in real-time, it may take up to 10 minutes for API call data to appear in dashboards, custom reports, and management API calls.\u003c/p\u003e\n"],["\u003cp\u003eUsers can customize dashboards by selecting metrics, date ranges, and data aggregation intervals, and create custom reports for in-depth analysis.\u003c/p\u003e\n"],["\u003cp\u003eDashboards include common features like time range selection, zoom, data export, and mouse-over details, ensuring consistency across different dashboard types.\u003c/p\u003e\n"]]],[],null,["# Using the analytics dashboards\n\n*This page\napplies to **Apigee** and **Apigee hybrid**.*\n\n\n*View [Apigee Edge](https://docs.apigee.com/api-platform/get-started/what-apigee-edge) documentation.*\n\nAnalytics dashboards help you see and detect changes in your API ecosystem at a glance. The\nability to see what has changed over time helps you identify problems and take corrective action\nquickly.\n\nFor a quick overview of API Analytics, who uses them, and why, see\n[Apigee API Analytics overview](/apigee/docs/api-platform/analytics/analytics-services-overview).\n| **Note:** There is a limit to the amount of data that can be reported in\n| the Analytics dashboards. If the amount of analytics data returned by the query exceeds this\n| limit, then the dashboard will display the results for a partial set of data and a warning will\n| be displayed on the dashboard (Public Cloud only).\n|\n| As an alternative, you can export analytics data from Apigee Analytics to your own data repository,\n| such as Google Cloud Storage or BigQuery. You can then take advantage of the powerful query and machine\n| learning capabilities offered by Google Cloud BigQuery and TensorFlow to perform your own data analysis.\n| See [Export data from Analytics](/apigee/docs/api-platform/analytics/export-data) for more.\n\nWhat can you learn from the dashboards?\n---------------------------------------\n\nHas there been a sudden spike or drop off in API traffic? Which app developers are most\nsuccessful? What is the adoption rate of your API among developers? Which API methods are most\npopular? The Analytics dashboards are designed specifically to answer questions like\nthese.\n\nIn the background, Apigee collects information as data passes through your APIs. The\ndashboards provide a powerful way to use this data immediately. If you see something of interest\nin a graph or chart, an anomaly or sudden change, you can then drill deeper to uncover as much\ndetail as you require. If you notice that a particular developer is experiencing a lot of errors\nor a sudden drop in traffic, you can contact that developer proactively. Dashboards give you\ninsight into your APIs that allows you to take action.\n\nWhat's the delay interval for receiving data?\n---------------------------------------------\n\n\n| **Note:** **Data delay interval** \n| After API calls are made to proxies, it may take up to **10 minutes** for the data to appear in dashboards, custom reports, and management API calls.\n\n\u003cbr /\u003e\n\nCan I customize the dashboards?\n-------------------------------\n\nYes, many dashboards let you select which metrics to analyze, date ranges, data aggregation\nintervals, and many other variables. If the built-in dashboards do not suit your needs, you can\ncreate [custom reports](/apigee/docs/api-platform/analytics/create-custom-reports), which are dashboards you create by\nselecting the analytic dimensions and metrics that you wish to analyze. Custom reports let you\n\"drill down\" into your API's analytic data until you achieve the granularity you require.\n\nWhat are the most common features in the dashboards?\n----------------------------------------------------\n\nDashboards have a set of common features, including setting time range, click and drag zooming on charts,\nmouse-over hover for more details on charts and other regions, and selectors for choosing the data\nto display in a chart. If you understand how to use one kind of dashboard, you'll be comfortable using the others.\n| **Note:**For the specific features of each dashboard, view the documentation for that dashboard.\n\nThe following figure highlights these common feature areas:\n\n- **Environment or Host name** - Select the environment or host name in the organization.\n- **Set the time range** - Set the time range over which the dashboard\n displays its data.\n\n | **Note:** For Cloud-based installations, data older than six months from the current date is not accessible by default. If you want to access data older than six months, contact [Google Cloud Customer Care](https://cloud.google.com/support-hub/).\n- **Zoom in** - You can zoom in on chart data by clicking and dragging a region of the chart. When you complete the drag, the chart zooms in to the selected region.\n- **Export data to file** - Download a single CSV file that contains the set of data for the chart.\n- **Hover mouse over graphs** - You can mouse over any point on a graph for more context about the data at that point."]]