Apigee UI에서 Apigee 애널리틱스 및 수익 창출 데이터를 보는 것 외에도, Google Looker Studio에 Apigee 데이터를 연결하는 Looker Studio 통합을 사용해도 이들을 볼 수 있습니다. Looker Studio는 Apigee 데이터를 완전 맞춤형 대시보드 및 보고서에 표시하는 데 사용할 수 있는 강력하고 유연한 도구입니다.
다음 섹션에서는 Looker Studio에서 분석 데이터 보고서를 만드는 방법을 설명합니다.
필요한 역할
Looker Studio를 사용하려면 먼저 데이터 소스(이 경우 Apigee)에 연결해야 합니다. 연결하려면 roles/apigee.analyticsEditor 역할이 있어야 합니다.
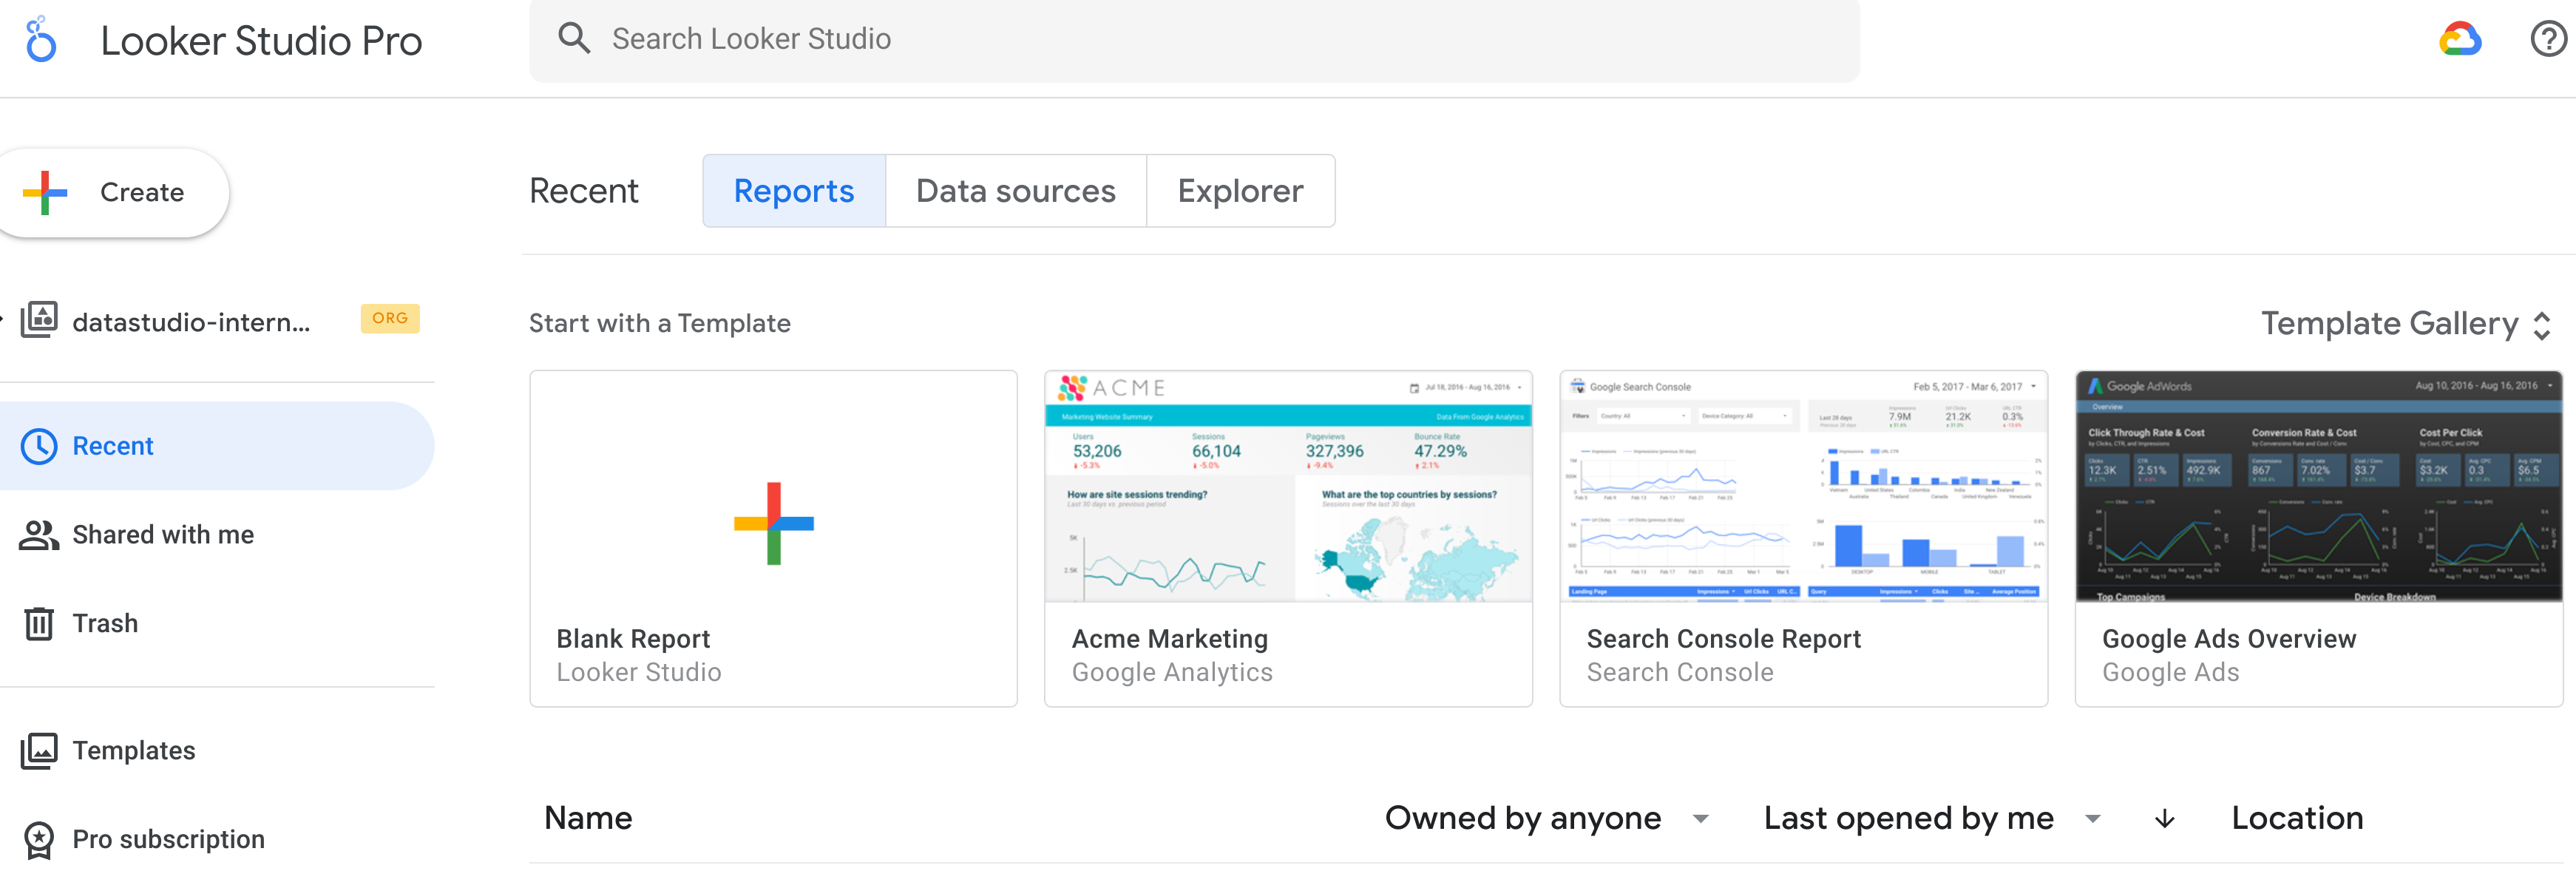
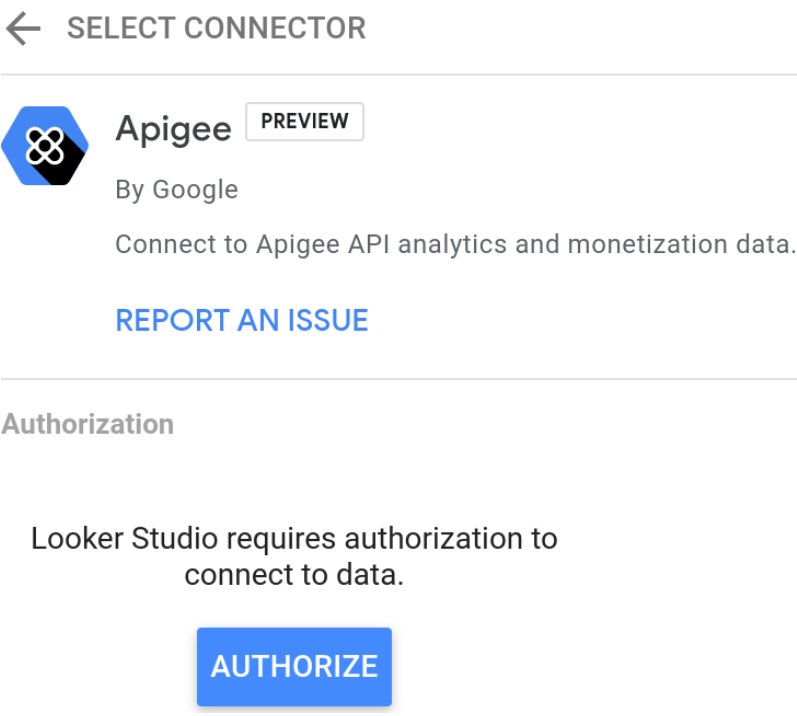
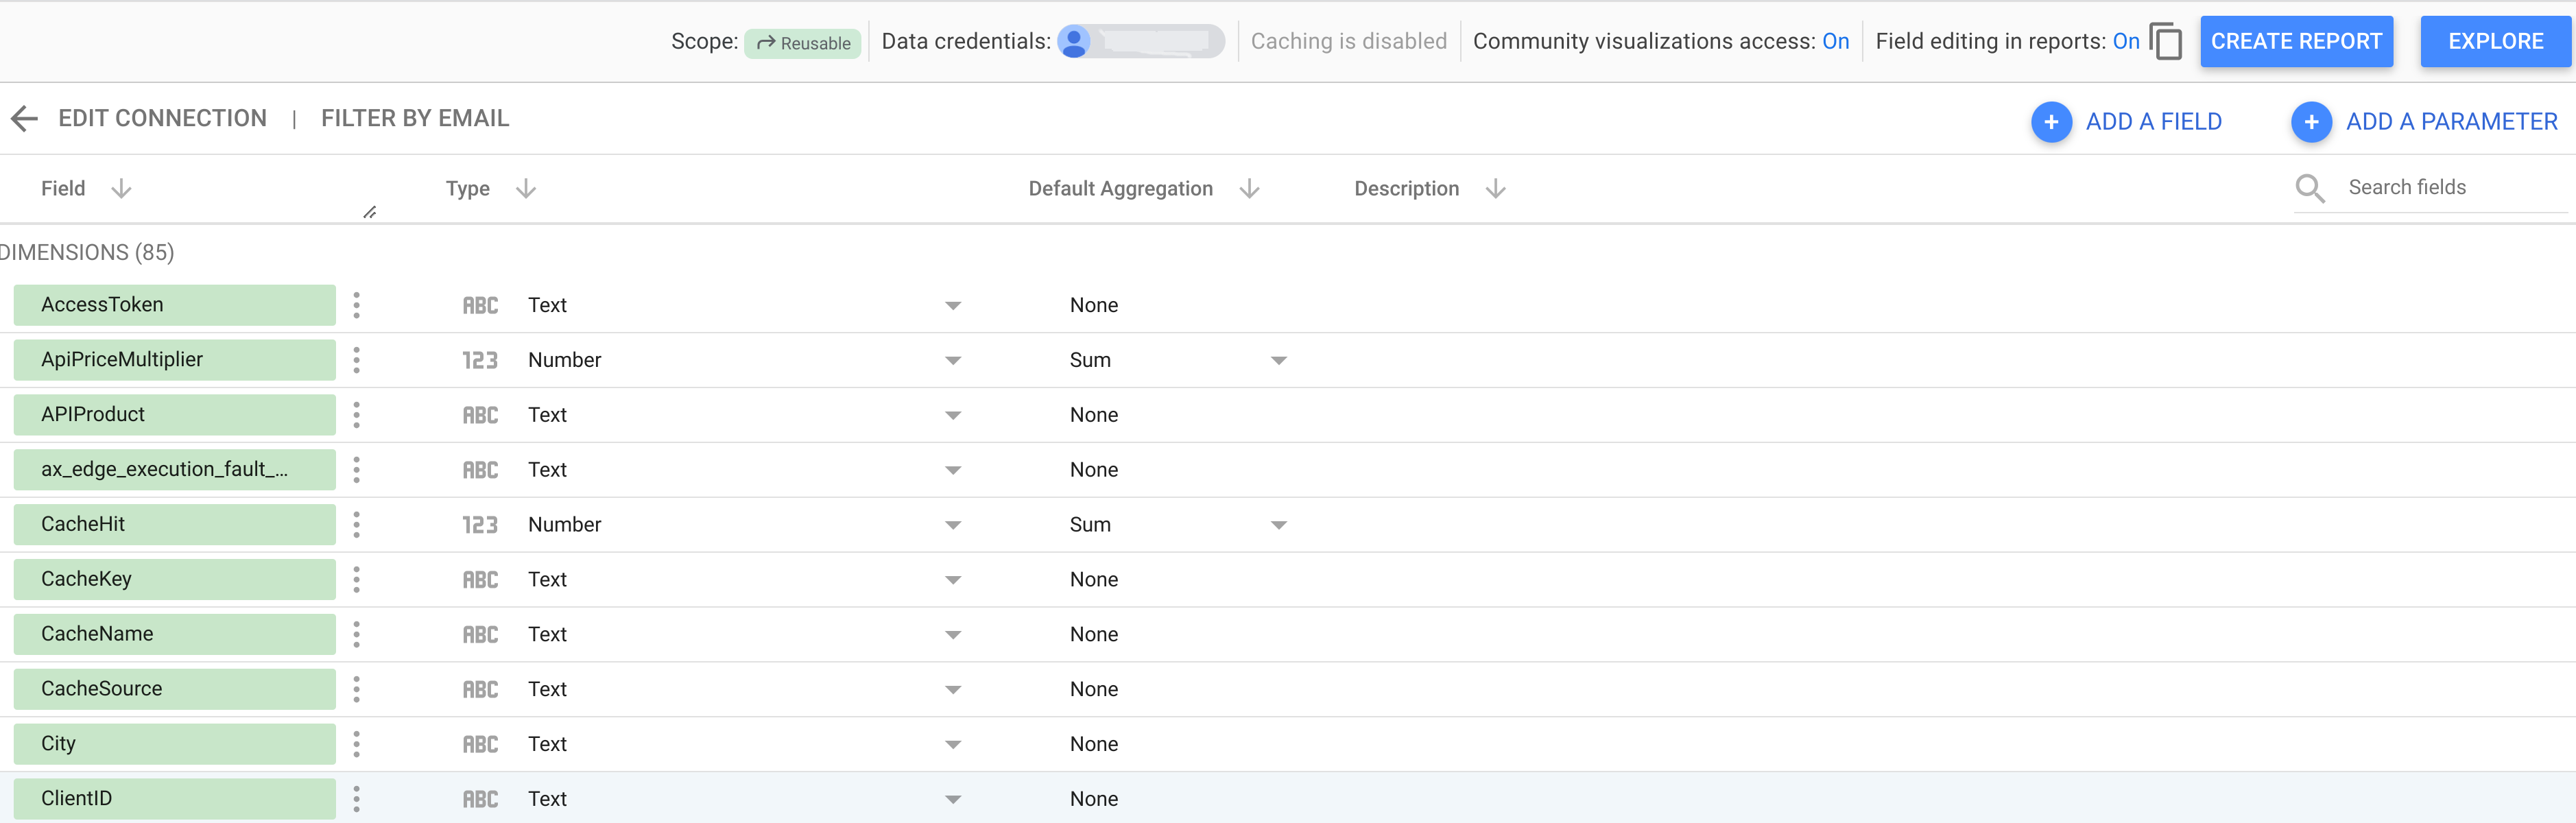
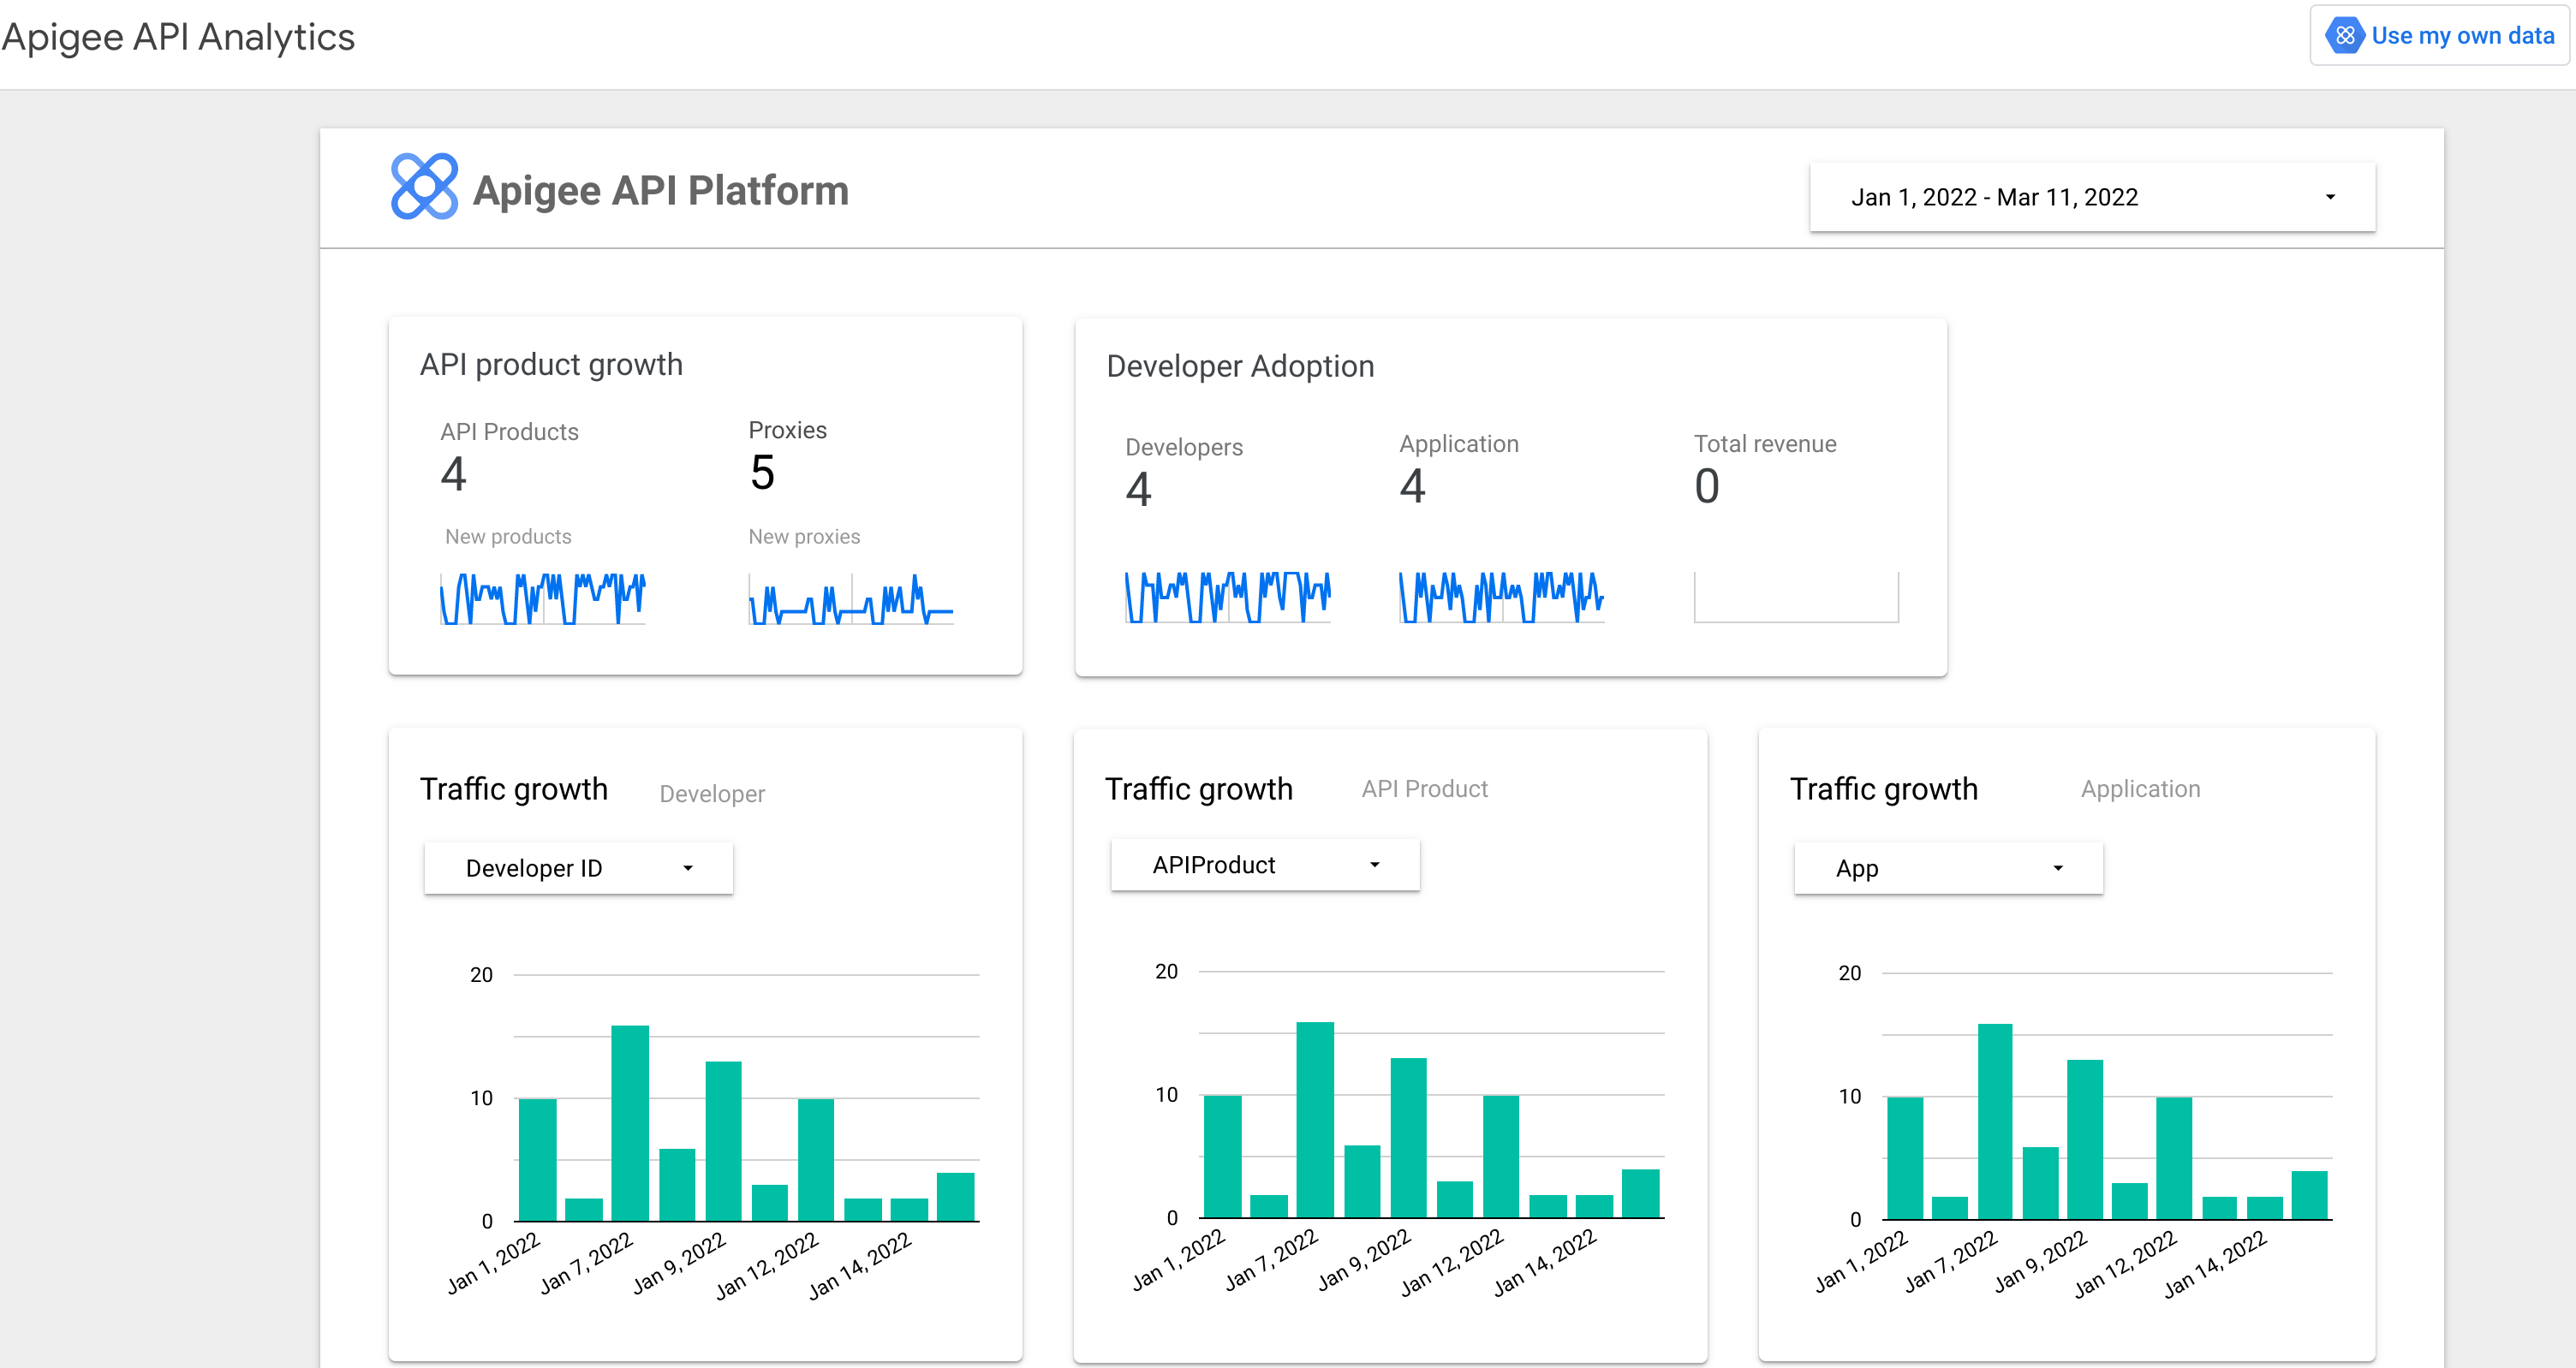
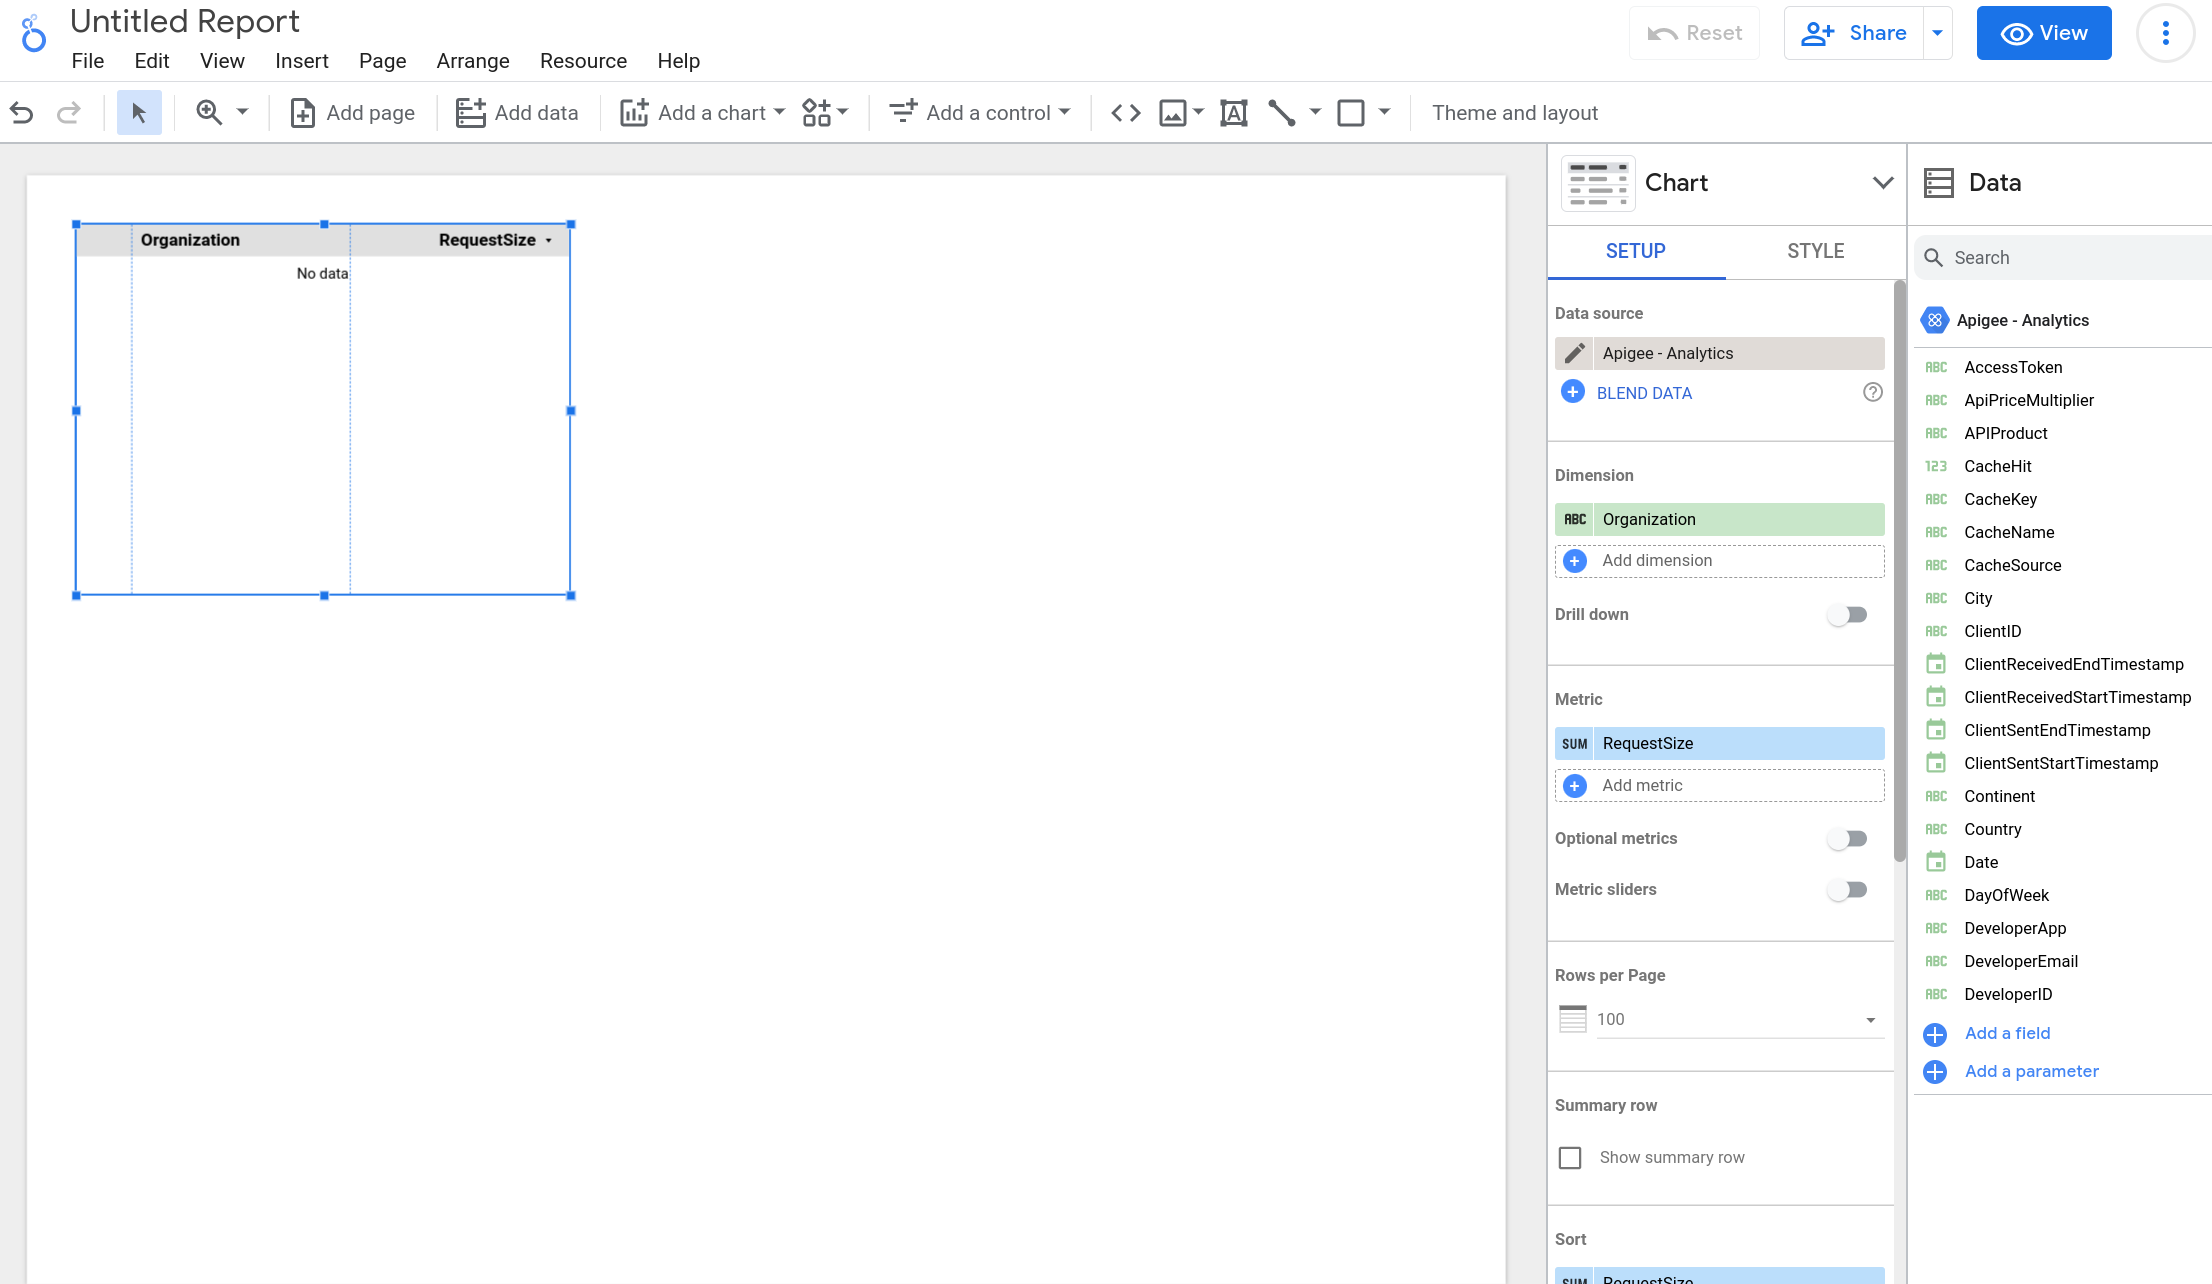
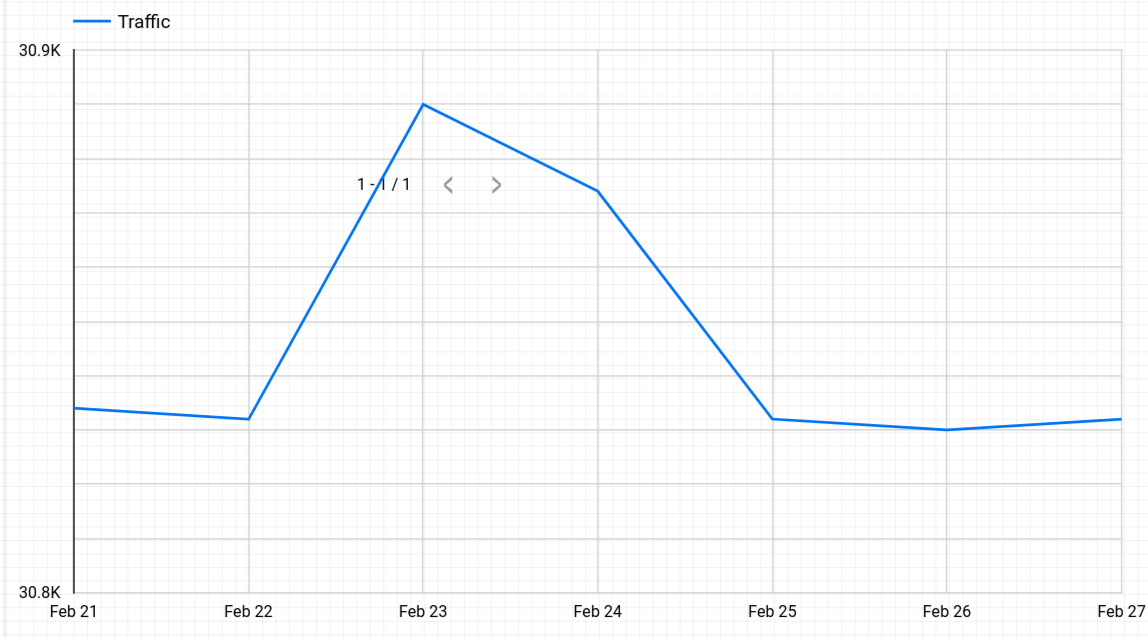
[[["이해하기 쉬움","easyToUnderstand","thumb-up"],["문제가 해결됨","solvedMyProblem","thumb-up"],["기타","otherUp","thumb-up"]],[["이해하기 어려움","hardToUnderstand","thumb-down"],["잘못된 정보 또는 샘플 코드","incorrectInformationOrSampleCode","thumb-down"],["필요한 정보/샘플이 없음","missingTheInformationSamplesINeed","thumb-down"],["번역 문제","translationIssue","thumb-down"],["기타","otherDown","thumb-down"]],["최종 업데이트: 2025-08-30(UTC)"],[[["\u003cp\u003eLooker Studio Integration allows users to view Apigee Analytics and monetization data in fully customizable dashboards and reports.\u003c/p\u003e\n"],["\u003cp\u003eTo connect Apigee data to Looker Studio, users must have the \u003ccode\u003eroles/apigee.analyticsEditor\u003c/code\u003e role and authorize the connection in Looker Studio.\u003c/p\u003e\n"],["\u003cp\u003eUsers can utilize the pre-built Apigee API Platform template, accessible through either the Looker Studio interface or the Apigee UI in the Cloud console.\u003c/p\u003e\n"],["\u003cp\u003eOrganizations using VPC service controls must add specific egress and ingress rules for Looker Studio service accounts to access \u003ccode\u003ebigquery.googleapis.com\u003c/code\u003e and \u003ccode\u003ebigquerydatatransfer.googleapis.com\u003c/code\u003e APIs.\u003c/p\u003e\n"],["\u003cp\u003eUsers can also create an analytics report directly within Looker Studio by manually adding Apigee as a data source and selecting metrics.\u003c/p\u003e\n"]]],[],null,["# Looker Studio Integration\n\n| **Preview --- Looker Studio Integration**\n|\n| This feature is covered by the [Pre-GA Offerings Terms](https://cloud.google.com/terms/service-terms#1)\n| of the Google Cloud Terms of Service. Pre-GA features may have limited support, and changes to pre-GA features\n| may not be compatible with other pre-GA versions. For more information, see the [launch stage descriptions](https://cloud.google.com/products#product-launch-stages).\n|\n| Support for the Preview launch of Advanced API Security Abuse Detection is available through\n| the [Apigee - Google Cloud Community](https://www.googlecloudcommunity.com/gc/Apigee/bd-p/cloud-apigee) forum.\n\nIn addition to viewing Apigee Analytics and monetization data in the Apigee UI,\nyou can also view them using Looker Studio Integration, which connects Apigee data to Google's\n[Looker Studio](https://cloud.google.com/looker-studio). Looker Studio is a powerful and flexible tool that you can use to\ndisplay Apigee data in fully customizable dashboards and reports.\n| **Note:** If your organization uses [VPC service controls](/apigee/docs/api-platform/security/vpc-sc), you must add [egress and ingress rules](https://cloud.google.com/vpc-service-controls/docs/ingress-egress-rules) for the Looker Studio service account to allow services for the following APIs:\n|\n| - `bigquery.googleapis.com`\n| - `bigquerydatatransfer.googleapis.com`\n\nThe following sections explain how to create an Analytics data report in Looker Studio.\n\nRequired role\n-------------\n\nTo use Looker Studio, you first need to connect it to a data source---in this case,\nApigee. To make the connection, you need to have the role\n`roles/apigee.analyticsEditor`.\n\nSee [Apigee roles](https://cloud.google.com/iam/docs/understanding-roles#apigee-roles)\nfor more information.\n\nConnect to the Apigee data source\n---------------------------------\n\nTo connect to the Apigee data source, do the following steps:\n\n1. Open [Looker Studio](https://lookerstudio.google.com). The main Looker Studio page is shown below:\n\n\n2. Click the **+ Create** button at the top of the page.\n3. Select **Data source** to display an untitled **Data Source** page.\n4. Scroll down and click the **Apigee** button:\n\n\n5. Click the **Authorize** button to allow Looker Studio to connect to the Apigee data.\n6. In the **Apigee Organization Name** field, enter the organization ID. **Note:** The organization ID is the same as the Google Cloud project ID for the organization.\n7. Click **Connect** at the top-right of the window.\n\n **Note:** You must have the\n role `roles/apigee.analyticsEditor` to perform this step.\n\n When the connection to Apigee is made, Looker Studio displays the\n page shown below, where you can create a report:\n\n\nThe next section explains how to view an Analytics data report in Looker Studio using the\nApigee API Platform template.\n\nUse the Apigee API Platform template\n------------------------------------\n\nThe following sections describe how to view a predefined report using the Apigee API\nPlatform template.\n\n- [Open the Apigee API Platform template\n from Looker Studio](#open-the-apigee-api-platform-template-from-looker-studio)\n- [Open the Apigee API Platform template\n from the Apigee UI](#open-the-apigee-api-platform-template-from-the-apigee-ui)\n\n### Open the Apigee API Platform template from Looker Studio\n\nTo open the Apigee API Platform template from Looker Studio:\n\n1. In the Looker Studio page, select **Templates** in the navigation pane.\n2. In the **Category** menu in **Template Gallery** , select **Apigee**.\n3. Under **Apigee** , select **Apigee API Analytics** . This displays the **Apigee API\n Platform** template:\n\n4. Click **Use my own data** at the top-right of the page to open the the **Add data to report** dialog.\n5. In the **Apigee Organization Name** field, enter the organization ID. **Note:** The organization ID is the same as the Google Cloud project ID for the organization.\n6. Click **Add** at the lower right.\n\n### Open the Apigee API Platform template from the Apigee UI in Cloud console\n\nTo open the Apigee API Platform template from the Apigee UI in Cloud console:\n\n1. Open the [Apigee UI in Cloud console](https://console.cloud.google.com/apigee) in a browser.\n2. Select **Analytics \\\u003e Custom reports**.\n3. Click **Create More Reports Using Looker Studio** at the top-right. This displays the **Apigee API Platform** template: and\n\n4. Click **Use my own data** at the top-right of the page to open the the **Add data to report** dialog.\n5. In the **Apigee Organization Name** field, enter the organization ID. **Note:** The organization ID is the same as the Google Cloud project ID for the organization.\n6. Click **Add** at the lower right.\n\n| **Note:** In the **Developer Adoption** chart, the number below **Application** is the number of active applications within the selected date range, shown at the top right of the template. This differs from the total number of applications (shown, for example, in the **Traffic growth** chart above), which includes inactive applications.\n\nYou can view a number of different charts in the report, including:\n\n- API product growth\n- Traffic growth\n- Latency performance\n- Error code improvements\n\nSee the Looker Studio\n[Quick start guide](https://support.google.com/looker-studio/answer/9171315#zippy=%2Cinstructions) to learn more.\n\nCreate an Analytics data report\n-------------------------------\n\nYou can also create an Analytics data report directly in Looker Studio, without using\nthe [Apigee API Platform template](#apigee-api-analytics-template):\n\n1. In the Looker Studio page, click **+ Create**.\n2. Select **Report**.\n3. Under **Add data to report** , select **My data sources**.\n4. Select **Apigee - Analytics**.\n5. Click **Add** at the lower right.\n6. In the confirmation dialog, click **Add to Report** . This displays the Report page with Apigee Analytics data available to add to the report, as shown below:\n\n\nYou can now create an Analytics report. Here's an example that creates a graph of API\ntraffic over time:\n\n1. Select the **Insert** menu at the top of the Report page.\n2. Select **Time series chart**.\n3. In the **Metric** pane on the right side of the Report page, select **+ Add metric**.\n4. Scroll down through the **Available Fields** and select **Traffic**.\n\nThis displays a time series chart of recent traffic. An example is shown below. (Your data will\nvary.)\n\n\nIf you want to view a different time range for the data, return to the **Insert** menu and\nselect **Date range control**. You can then use the control to select\na time range for the data to display.\n\nThe Looker Studio documentation describes how to create many kinds of reports. For more\ninformation, see the following:\n\n- [Looker Studio Quick start guide](https://support.google.com/looker-studio/answer/9171315#zippy=%2Cinstructions)\n- [Explore new ways to visualize your data](https://lookerstudio.google.com/visualization)"]]