El panel de Análisis de latencia puede alertarte sobre cualquier problema de latencia que experimenten tus proxies de API. Muestra las mediciones de latencia hasta la ventana de un minuto, lo que destaca la mediana, el percentil 95 y los valores del percentil 99.
El valor de la mediana indica el punto en el que la mitad de tu tráfico experimenta una latencia inferior a este valor y la otra mitad de tu tráfico experimenta una latencia superior a este valor. Por ejemplo, si la latencia mediana del tiempo de respuesta para el proxy de API seleccionado es de 62 ms, significa que la mitad de las respuestas de este proxy de API toman menos de 62 ms. También significa que la mitad de las respuestas de este proxy de API toman más de 62 ms.
Los valores del percentil 95 y el percentil 99 te indican el punto en el que el 95% y el 99% de tu tráfico tienen una latencia menor que estos valores. O, lo que es más importante, pueden señalar un comportamiento periférico, lo que te indica que el 5% y el 1% de tu tráfico están experimentando valores de latencia que están fuera del rango.
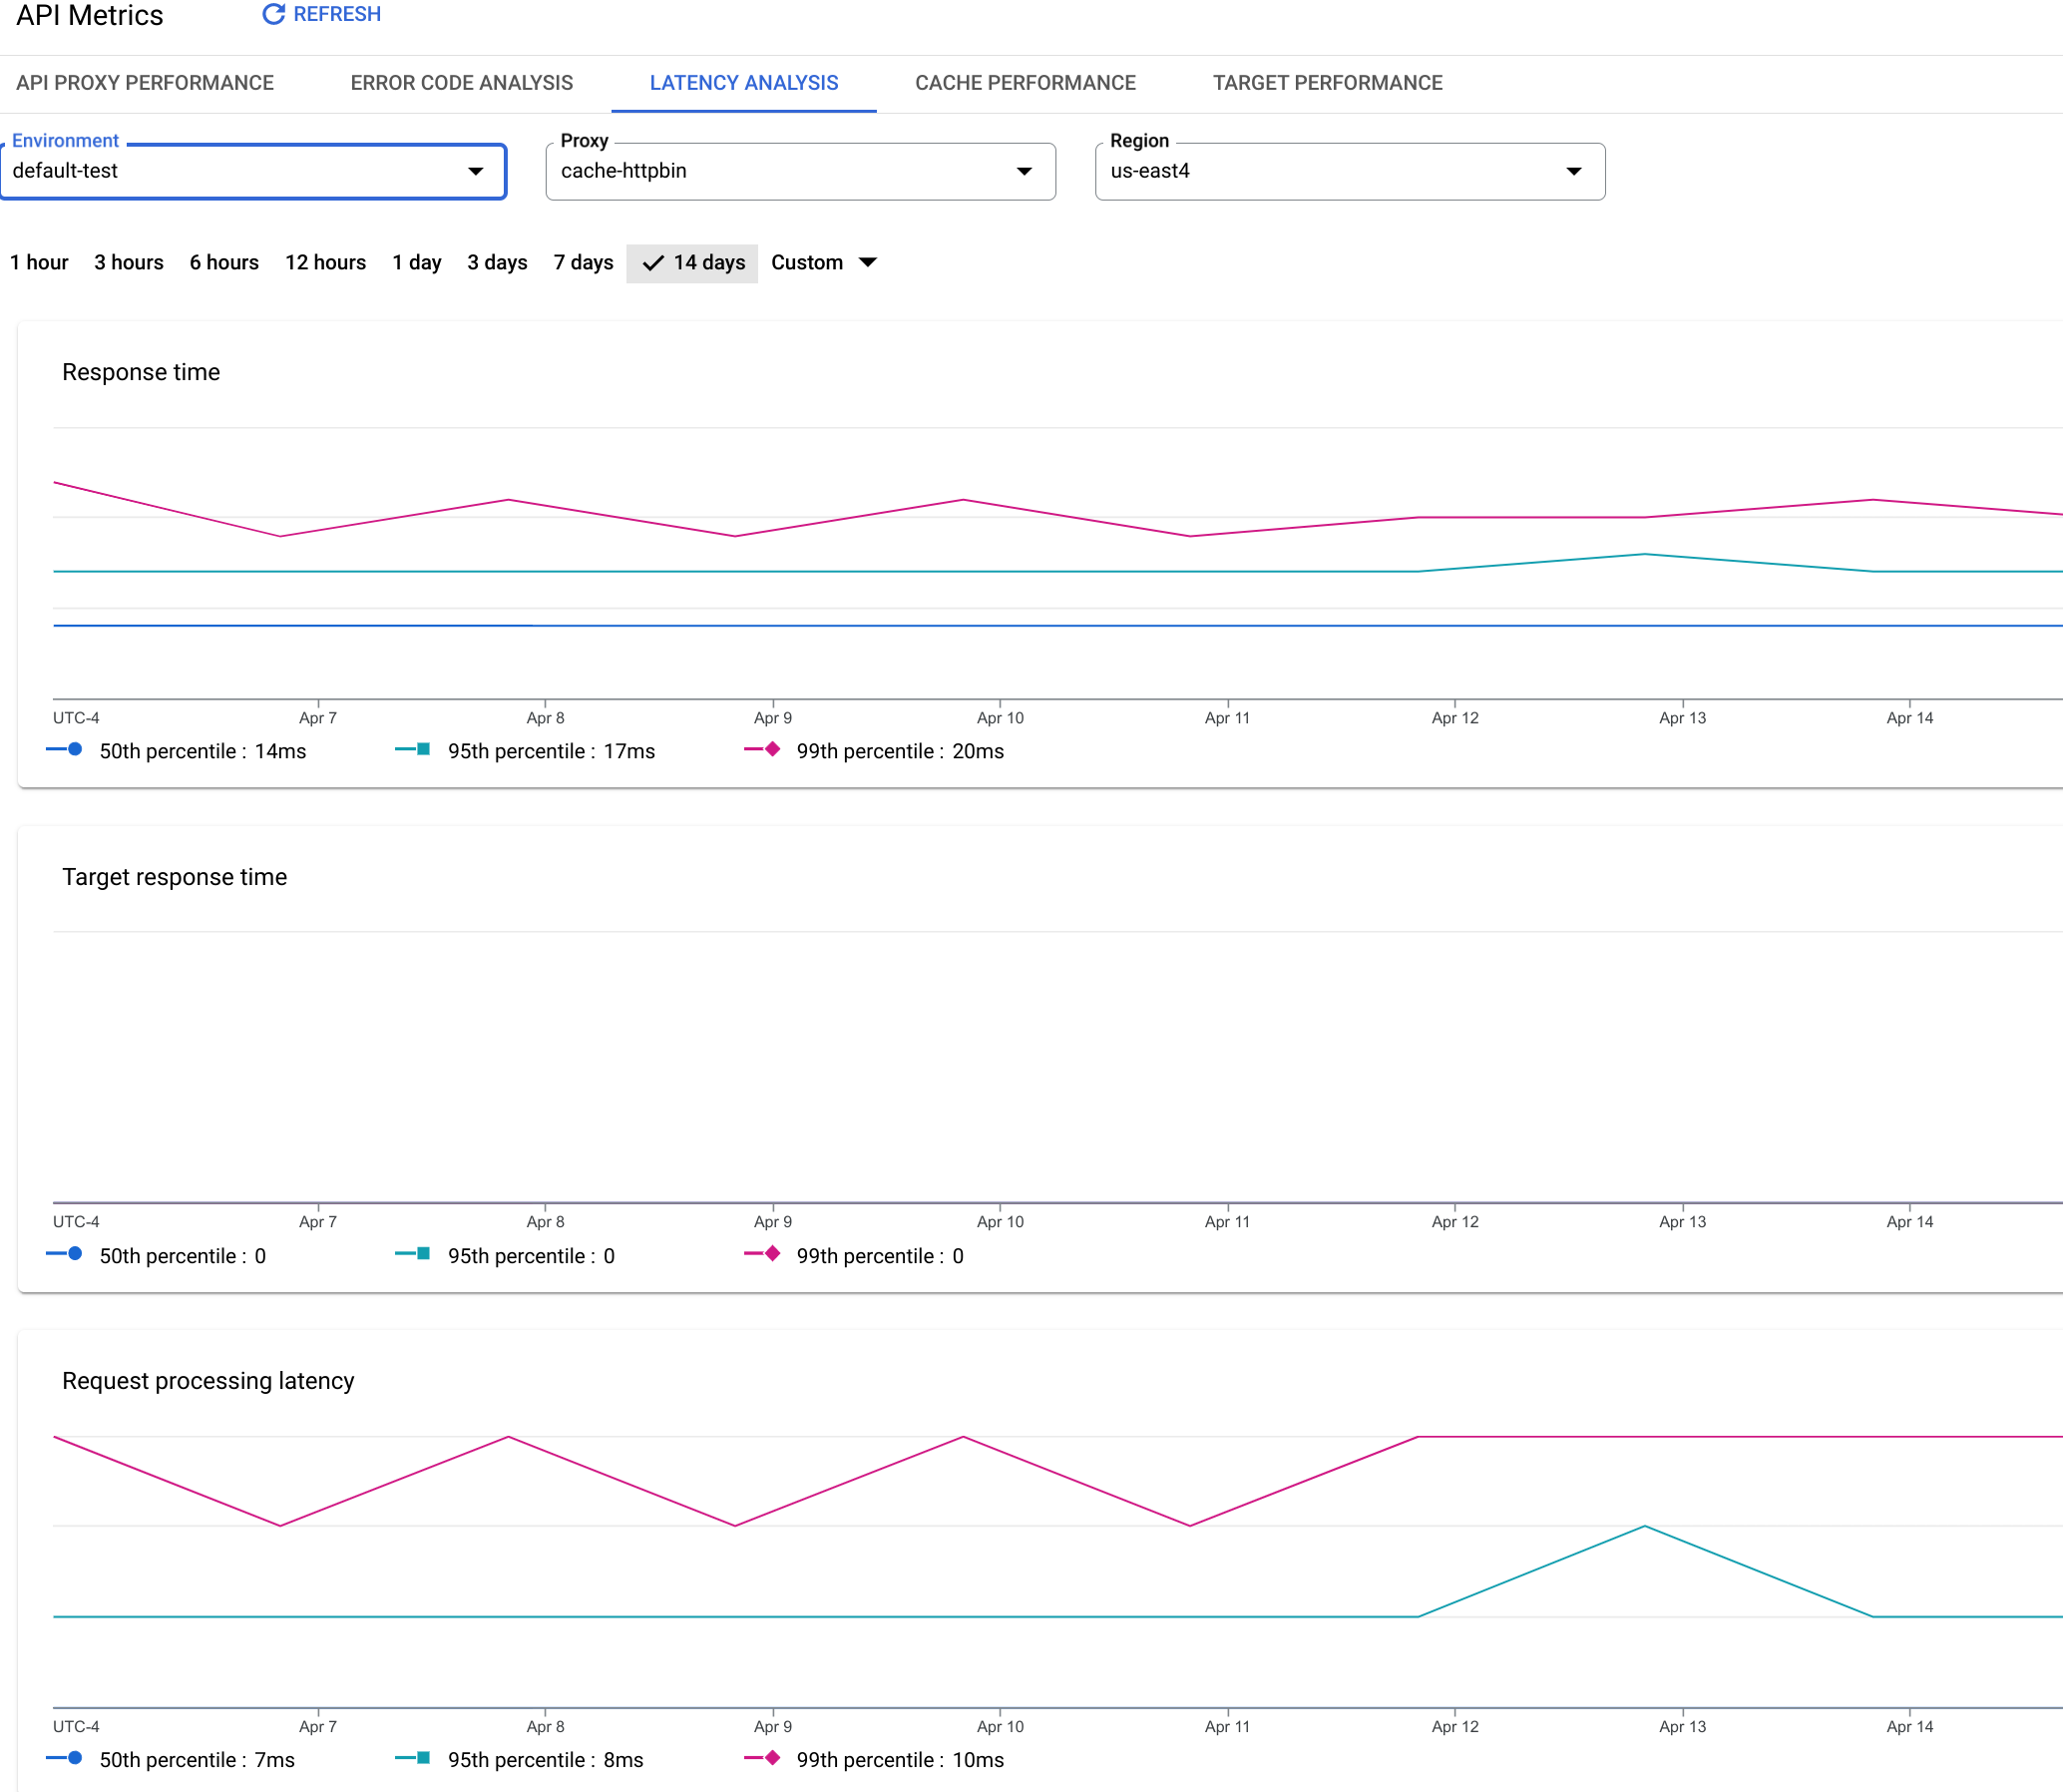
Panel de Análisis de latencia
Para acceder al panel de Análisis de latencia, haz lo siguiente:
Cantidad total de milisegundos que se tardó en responder a una llamada. Esta vez incluye la sobrecarga del proxy de la API de Apigee y el tiempo de servidor objetivo.
Tiempo de respuesta del destino
Cantidad de milisegundos que le llevó a tu servidor de destino responder a una llamada. Este número te indica cómo se comportan tus servidores.
Latencia de procesamiento de solicitudes
Cantidad de milisegundos desde el momento en que una llamada llega al proxy de API seleccionado hasta el momento en que Apigee envía la llamada a tu servidor de destino.
Agrega las latencias de solicitud y respuesta para calcular la sobrecarga final que el proxy de la API agregó a la llamada.
Latencia de procesamiento de respuestas
Cantidad de milisegundos desde el momento en que el proxy de la API recibe la respuesta de tu servidor de destino hasta el momento en que Apigee envía la respuesta al emisor original.
Agrega las latencias de solicitud y respuesta para calcular la sobrecarga final que el proxy de la API agregó a la llamada.
[[["Fácil de comprender","easyToUnderstand","thumb-up"],["Resolvió mi problema","solvedMyProblem","thumb-up"],["Otro","otherUp","thumb-up"]],[["Difícil de entender","hardToUnderstand","thumb-down"],["Información o código de muestra incorrectos","incorrectInformationOrSampleCode","thumb-down"],["Faltan la información o los ejemplos que necesito","missingTheInformationSamplesINeed","thumb-down"],["Problema de traducción","translationIssue","thumb-down"],["Otro","otherDown","thumb-down"]],["Última actualización: 2025-09-04 (UTC)"],[[["\u003cp\u003eThis Latency Analysis dashboard applies to both Apigee and Apigee hybrid platforms, providing insights into API proxy performance.\u003c/p\u003e\n"],["\u003cp\u003eThe dashboard measures and displays latency in milliseconds, broken down into median, 95th percentile, and 99th percentile values to identify potential issues.\u003c/p\u003e\n"],["\u003cp\u003eThe dashboard includes key latency metrics such as Response Time, Target Response Time, Request Processing Latency, and Response Processing Latency, to provide details of how each component of the API proxy is performing.\u003c/p\u003e\n"],["\u003cp\u003eAccess the Latency Analysis dashboard via the Analytics > API metrics section in the Apigee UI in Cloud console, or via Analyze > API Metrics > Latency Analysis in the classic Apigee UI.\u003c/p\u003e\n"],["\u003cp\u003eNote that after API calls are made, there can be a 10 minute delay for the data to appear in the dashboard.\u003c/p\u003e\n"]]],[],null,["# Latency analysis dashboard\n\n*This page\napplies to **Apigee** and **Apigee hybrid**.*\n\n\n*View [Apigee Edge](https://docs.apigee.com/api-platform/get-started/what-apigee-edge) documentation.*\n\n\n| **Note:** This feature may not be available in all Apigee plans. To see which pricing plan includes this feature, see \u003chttps://cloud.google.com/apigee/pricing/\u003e.\n\n\u003cbr /\u003e\n\nWhat does this dashboard tell me?\n---------------------------------\n\nThe Latency Analysis dashboard can alert you to any latency issues your API proxies may be\nexperiencing. It displays latency measurements down to the window of a minute, highlighting the\nmedian, 95th percentile, and 99th percentile values.\n\nThe median value tells you the point at which half of your traffic is experiencing latency\nthat is less than this value and half of your traffic is experiencing latency that is greater\nthan this value. For example, if the median response time latency for your selected API proxy is\n62 ms, it means that half of the responses from this API proxy take less than 62 ms. It also\nmeans that half of the responses from this API proxy take more than 62 ms.\n\nThe 95th percentile and 99th percentile values tell you the point at which 95% and 99% of your\ntraffic is experiencing latency that is less than these values. Or rather more importantly, it\ncan point out outlying behavior, telling you that 5% and 1% of your traffic is experiencing\nlatency values that are out-of-range.\n\n\n| **Note:** **Data delay interval** \n| After API calls are made to proxies, it may take up to **10 minutes** for the data to appear in dashboards, custom reports, and management API calls.\n\n\u003cbr /\u003e\n\nThe Latency Analysis dashboard\n------------------------------\n\nTo access the Latency Analysis dashboard:\n\nIn the Google Cloud console, go to the **Analytics \\\u003e API metrics \\\u003e Latency Analysis** page.\n\n[Go to Latency Analysis](https://console.cloud.google.com/apigee/analytics/latency)\n\nThe **Latency Analysis** view is shown:\n\nWhat does this dashboard\nmeasure?\n---------------------------------\n\nSee also this interesting article on the Apigee Community site:\n[When can the Average Total Response Time be less than the Average Target Response Time?](https://community.apigee.com/articles/2695/when-can-the-average-total-response-time-be-less-t.html)"]]