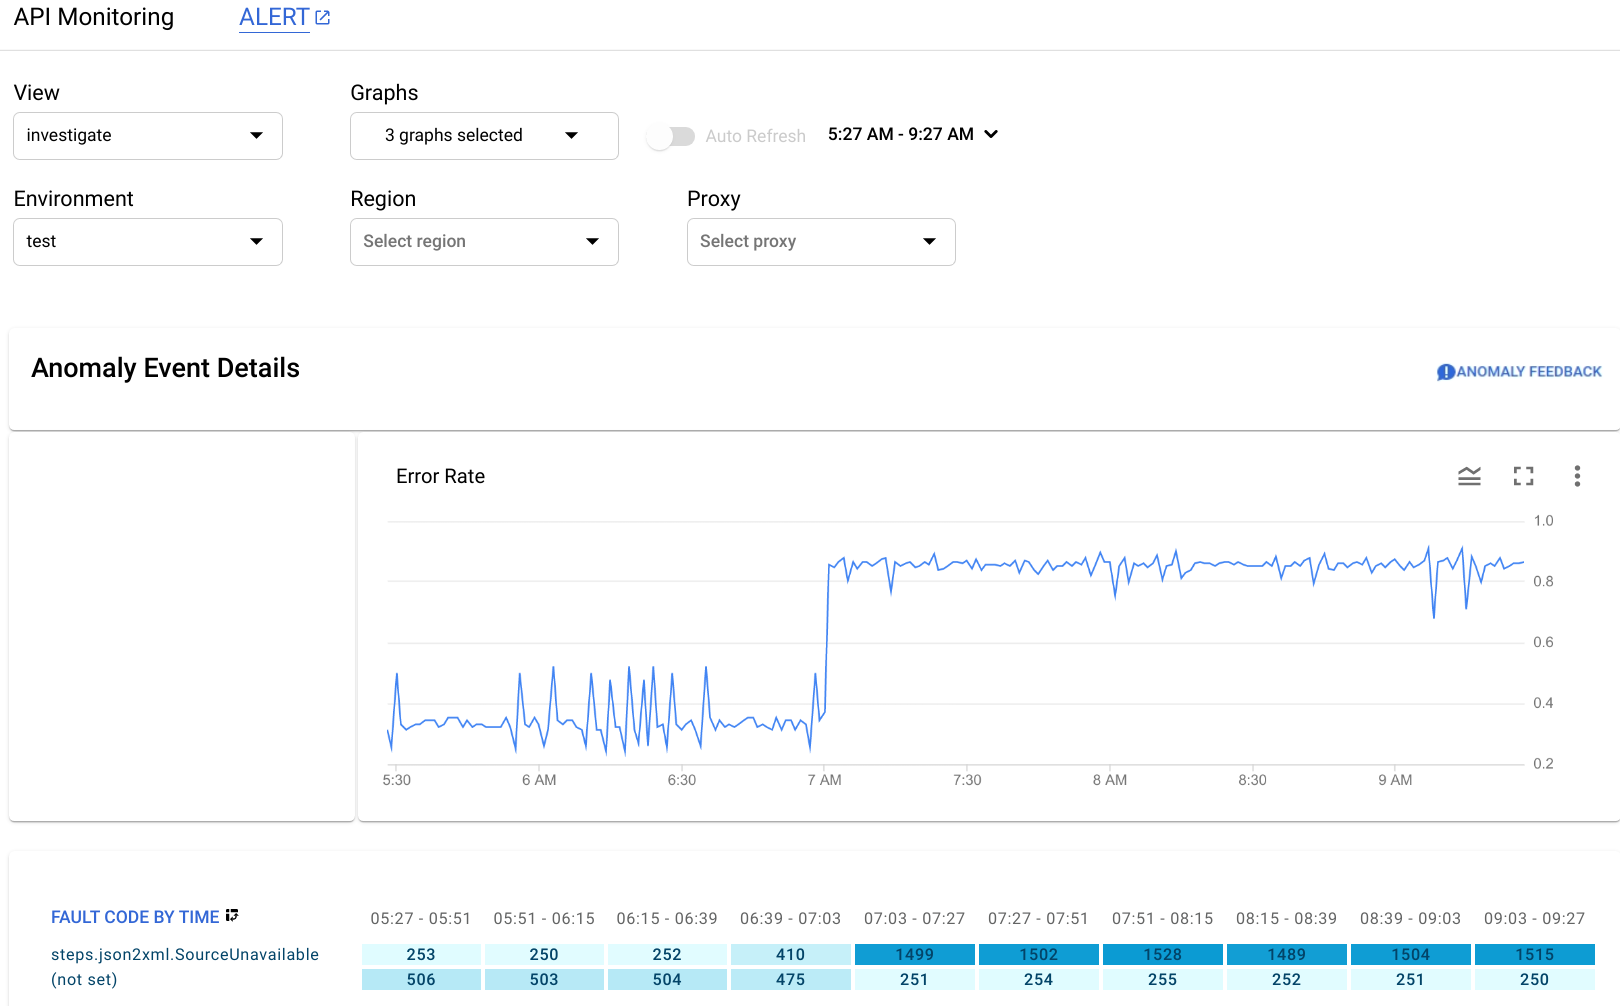
이상 이벤트 세부정보 창에 오류율 타임라인이 표시됩니다.
그래프에는 오류율이 0.4 미만에서 0.8 초과로 급증했을 때 이상이 오전 7시 이후에 발생한 것으로 표시됩니다.
타임라인 그래프의 오류율은 모든 결함 코드의 오류를 포함합니다.
여러 결함 코드에 대한 오류 분석을 보려면 타임라인 아래에 표시된 Fault Code by Time 그래프를 확인하세요.
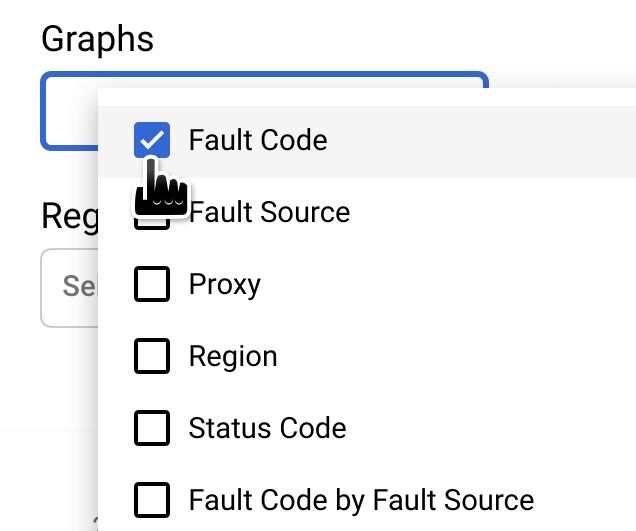
참고: Fault Code by Time 그래프가 현재 표시되지 않으면 그래프 메뉴에서 결함 코드를 선택하여 표시합니다.
Fault Code by Time 그래프의 원으로 표시된 열은 이상 시간이 포함된 시간 간격에 해당합니다.
참고: 그래프에 표시된 데이터와 이상 보고 시간 사이에는 약간의 차이가 있습니다.
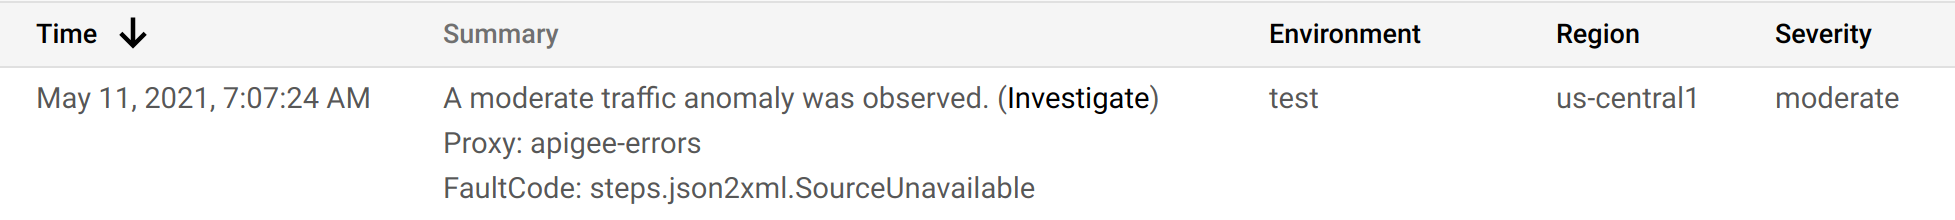
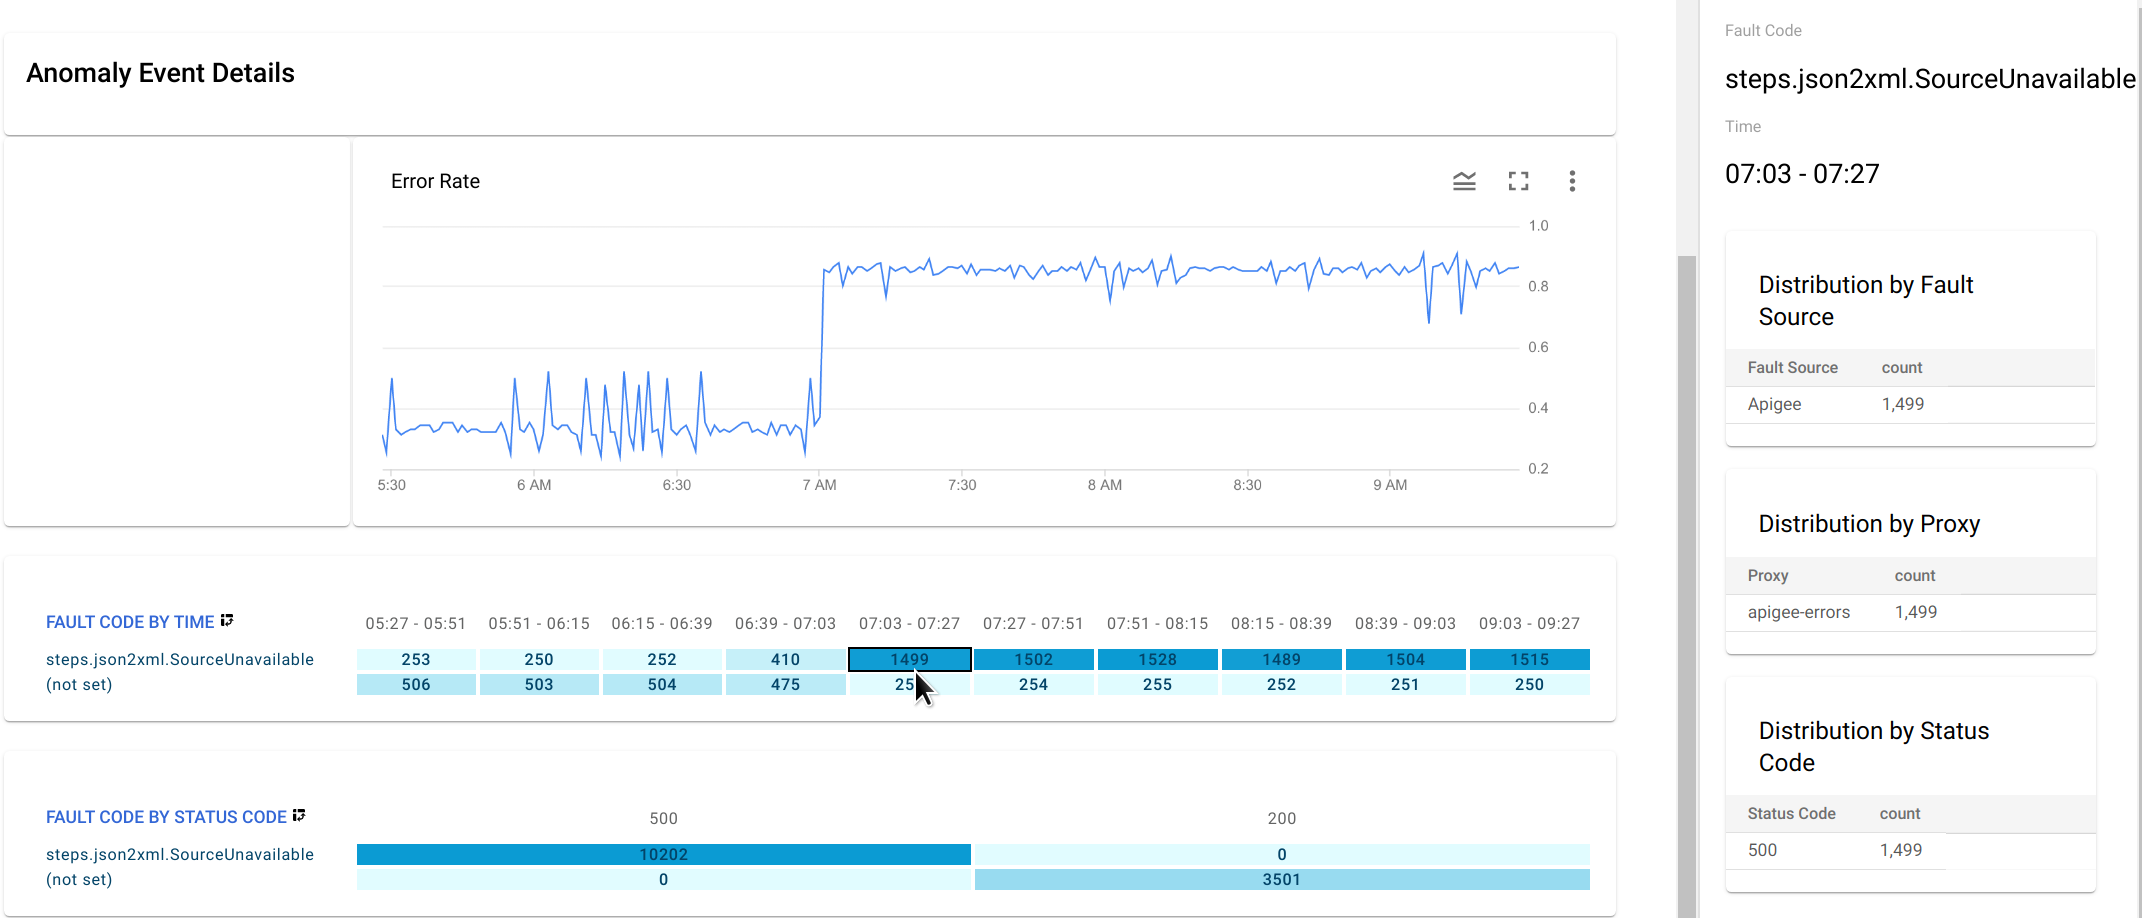
07:03 - 07:27 간격에 steps.json2xml.SourceUnavailable 결함 코드(JSON to XML 정책 메시지 소스를 사용할 수 없을 때 반환되는 오류 코드)가 포함된 1499개의 응답이 있는 것을 관찰했습니다.
이상을 트리거한 결함 코드입니다.
이와 반대로 이전 4개 간격 동안 해당 결함 코드가 포함된 평균 응답 수는 약 291개이므로 1499로 바로 이동하는 것은 비정상적인 이벤트였습니다.
[[["이해하기 쉬움","easyToUnderstand","thumb-up"],["문제가 해결됨","solvedMyProblem","thumb-up"],["기타","otherUp","thumb-up"]],[["이해하기 어려움","hardToUnderstand","thumb-down"],["잘못된 정보 또는 샘플 코드","incorrectInformationOrSampleCode","thumb-down"],["필요한 정보/샘플이 없음","missingTheInformationSamplesINeed","thumb-down"],["번역 문제","translationIssue","thumb-down"],["기타","otherDown","thumb-down"]],["최종 업데이트: 2025-08-19(UTC)"],[[["\u003cp\u003eThis content focuses on how to investigate Operations Anomalies within the Apigee UI in Cloud console, contrasting it with the Anomaly Detection in the classic Apigee UI.\u003c/p\u003e\n"],["\u003cp\u003eAnomalies detected in the Operations Anomalies dashboard can be further examined using the API Monitoring dashboards to access specific API data related to the anomaly's timeframe.\u003c/p\u003e\n"],["\u003cp\u003eThe API Monitoring Investigate dashboard, accessible by clicking "Investigate" on an anomaly, displays an error rate timeline, and a breakdown of errors by fault codes, helping pinpoint the anomaly's origin.\u003c/p\u003e\n"],["\u003cp\u003eBy examining the Fault Code by Time graph, users can identify the specific fault code triggering the anomaly, as demonstrated with the \u003ccode\u003esteps.json2xml.SourceUnavailable\u003c/code\u003e example.\u003c/p\u003e\n"],["\u003cp\u003eUsers can further investigate by drilling down into fault code data or creating alerts for similar anomalies to receive notifications about future occurrences.\u003c/p\u003e\n"]]],[],null,["# Investigate anomalies\n\n*This page\napplies to **Apigee** and **Apigee hybrid**.*\n\n\n*View [Apigee Edge](https://docs.apigee.com/api-platform/get-started/what-apigee-edge) documentation.*\n\n| **Important:** This page describes how to use Operations Anomalies, which is comparable to the [Advanced API Operations Anomaly Detection](/apigee/docs/aapi-ops) functionality in the Classic Apigee UI. Operations Anomalies is only available in the [Apigee UI in Cloud console](https://console.cloud.google.com/apigee) while Anomaly Detection is only available when using the classic [Apigee UI](https://apigee.google.com). Both are available at this time.\n\nWhen you see an anomaly in the\n[Operations Anomalies dashboard](/apigee/docs/api-platform/analytics/operations-anomalies-overview#view-detected-operations-anomalies), you\ncan investigate it further in the\n[API Monitoring](/apigee/docs/api-monitoring) dashboards.\nThe dashboards display graphs and tables of recent API data, which provide\nhighly specific information about what was occurring in the API at the time of the anomaly.\n\nThe following sections present examples that illustrate how to investigate\nanomalies in the dashboards.\n\nExample: fault code anomaly\n---------------------------\n\nSuppose are looking at the Operations Anomalies\ndashboard, and you notice the anomaly shown below:\n\nTo view the details of the anomaly, click **Investigate** in the **Summary** column.\nThis displays the\n[API Monitoring Investigate dashboard](/apigee/docs/api-monitoring/investigate),\nas shown below.\n\n\nThe Anomaly Event Details pane displays an error rate timeline.\nThe graph shows that the anomaly occurred after 07:00 AM, when the error rate\njumped from less than 0.4 to more than 0.8.\n\nThe error rate in the timeline graph includes errors for all fault codes.\nTo see a breakdown\nof errors for different fault codes, look at the Fault Code by Time graph displayed\nbelow the timeline.\n\n**Note:** If the Fault Code by Time graph\nisn't currently displayed, select **Fault Code** in the **Graphs** menu to show it:\n\n\nThe circled column of the Fault Code by Time graph corresponds to the time interval containing\nthe time of the anomaly.\n\n**Note:** A small difference between the data displayed in the graph\nand the reported time of the anomaly is normal.\n\nYou observe that in the\ninterval `07:03 - 07:27`, there were 1499 responses with fault code\n`steps.json2xml.SourceUnavailable` (an error code\nthat is returned when a JSON to XML policy message source is unavailable).\nThis is the fault code that triggered the anomaly.\nBy contrast, over the preceding four\nintervals the average number of responses with that fault code was about 291, so the jump to 1499\nwas certainly an unusual event.\n\nFor more information about the `SourceUnavailable` error message, see\n[JSON to XML policy runtime error troubleshooting](/apigee/docs/api-platform/troubleshoot/policies/runtime/jsontoxml-runtime-errors).\n\nAt this point, there are a couple of ways to continue investigating the cause of the\nanomaly:\n\n- Drill down on the fault code data at the time of the anomaly by clicking the\n cell for the anomaly in the Fault Code by Time graph.\n\n\n This displays distribution tables for `steps.json2xml.SourceUnavailable`\n by fault source, proxy, and status code in the right-hand pane.\n\n In this example, the tables don't provide any additional information\n because all the fault codes arise from the same fault source, proxy, and\n status code. But in other situations, the distribution tables can point you\n to the location and cause of the anomaly.\n- [Create an alert](/apigee/docs/aapi-ops/create-alerts) for the anomaly and set up a notification. After you have done this, AAPI Ops will send you a message whenever a similar event occurs in the future."]]