本頁內容適用於 Apigee 和 Apigee Hybrid。
查看
Apigee Edge 說明文件。

這個資訊主頁會顯示哪些資訊?
Proxy 效能資訊主頁可協助您查看 API Proxy 流量模式和處理時間。 您可以透過這項功能,以圖表呈現 API 產生的流量,以及 API 呼叫從 Apigee 收到要求到傳回用戶端應用程式的處理時間。
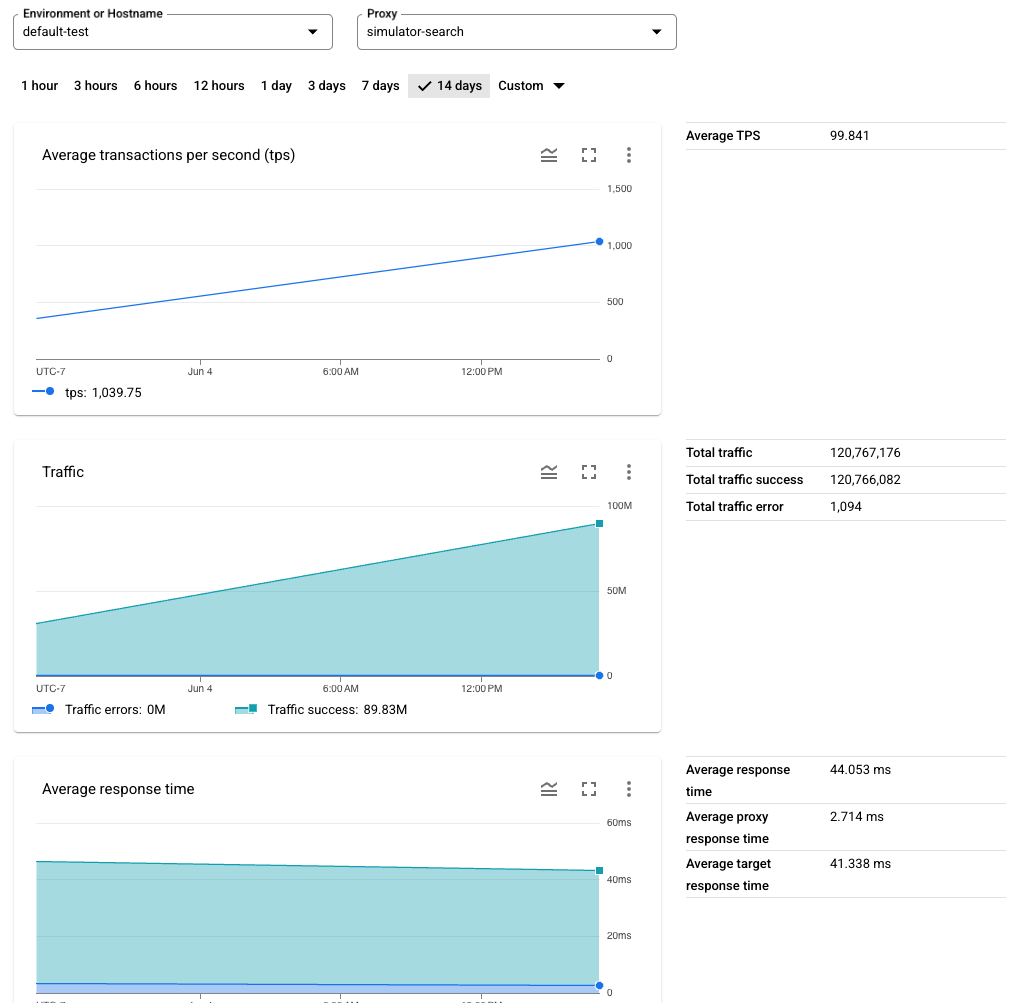
API Proxy 效能資訊主頁
如要存取 Proxy 效能資訊主頁,請按照下列步驟操作:
-
在 Google Cloud 控制台中,依序前往「Analytics」(分析) >「API metrics」(API 指標) >「API Proxy Performance」(API Proxy 效能) 頁面。
- 在「Proxy」清單中,選取「Environment or Hostname」和一或多個「All」Proxy。選取「全部」,即可查看所有 Proxy 的圖表,包括 Proxy 的匯總資料。 選取單一 Proxy 時,圖表只會顯示該 Proxy 的資料。
- 視需要變更預設時間範圍。舉例來說,您可以查看最近一天或最近 14 天的資料。
系統會顯示「API Proxy 效能」檢視畫面。圖表右側會顯示每個圖表的匯總指標,例如每秒平均交易數 (平均 TPS)
這個資訊主頁會評估哪些資料?
這個資訊主頁包含下列圖表:
每秒平均交易次數 (TPS)
| 指標 | 說明 |
|---|---|
| 平均 TPS | 每秒的平均 API 要求數和相應的回應數。 |
流量
| 指標 | 說明 |
|---|---|
| 總流量 | Apigee 為機構中的 API 環境收到的 API 請求總數。 |
| 流量成功 | 成功回應的要求總數。錯誤回應不會計入。 |
| 流量錯誤 | 所有不成功 API 要求的總數,也就是要求未傳送使用者所需的回應。這項計數包含 Proxy 和 Target 錯誤。 |
平均回覆時間
另請參閱 Apigee 社群網站上的這篇有趣文章: 平均總回應時間何時會低於平均目標回應時間?
| 指標 | 說明 |
|---|---|
| 平均回應時間 |
針對向 Apigee 機構環境發出的所有 API 呼叫,測得的「總回應時間」平均值。總回應時間是指 API 呼叫傳回 Apigee 的時間長度 (以毫秒為單位)。 換句話說,總回應時間是指從 Apigee 收到完整 API 呼叫,到 Apigee 開始將回應傳回用戶端應用程式所測量的時間。 這張圖表會顯示所有 Proxy 的平均值。如要查看個別 Proxy 的平均回應時間,請參閱下方的「Average Response Time by Proxy」圖表。 |
| 平均 Proxy 回應時間 |
這個值的計算方式是:針對向 Apigee 機構環境發出的所有 API 呼叫,將「總回應時間」減去「目標回應時間」後,再取平均值。 這項指標基本上是衡量 API 呼叫在 Apigee 本身流動所花費的時間 (以毫秒為單位)。 |
| 平均目標回應時間 |
從 Apigee 將要求的最後一個位元組傳送至後端目標,到 Apigee 接收回應的最後一個位元組,這段時間的平均毫秒數。 這項指標基本上是測量 API 呼叫在目標系統上花費的時間。 |
平均 Proxy 回應時間的計算方式,是將平均總回覆時間減去平均目標回覆時間。預期總回應時間一律會大於目標回應時間。不過,也有一些呼叫是由 Proxy 本身處理,例如預檢要求、快取回應、OAuth 權杖等,這些呼叫不會傳送到後端系統。Proxy 進行的這些「較快」呼叫會縮短平均總回應時間,但不會縮短目標回應時間。因此,平均總回應時間不一定會大於平均目標回應時間,這可能會導致 Proxy 回應時間出現負值。如果查看較大的 TPS,且未過度放大時間刻度,這些例外狀況就不會佔據太多權重,因此可提供更準確且實用的資料。
收集大量要求並經過一段時間後,您就能取得最有意義的平均回應資料,而不是只從短期內收集的少數要求取得資料。如果短時間內只有少數要求傳入,即使只有一通未轉接至目標的通話,也可能導致平均 Proxy 回應時間為負值。評估平均回覆時間時,建議查看流量較高的較長時間範圍。
依 Proxy 區分的流量
| 指標 | 說明 |
|---|---|
| <Proxy name> | 指定 API Proxy 的記錄 API 要求和回應數量。 |
依 Proxy 計算的平均回應時間
| 指標 | 說明 |
|---|---|
| <Proxy name> |
針對指定 API Proxy,所有對 Apigee 環境發出的 API 呼叫所測得的「總回應時間」平均值。總回應時間是指 API 呼叫傳回 Apigee 所需的時間 (以毫秒為單位)。
將滑鼠游標懸停在圖表上,即可查看在 Proxy 端和目標端花費的總時間,以及平均時間。
|