本页面适用于 Apigee 和 Apigee Hybrid。
查看 Apigee Edge 文档。

API Monitoring 的“最近”视图会显示代理的 API 流量树状图。
要访问“最近”视图,请按照访问 API 监控中的步骤操作,并选择最近。
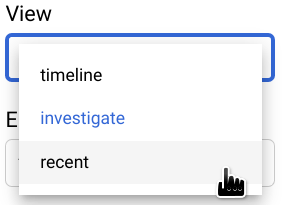
下图显示了已选定最近的界面。
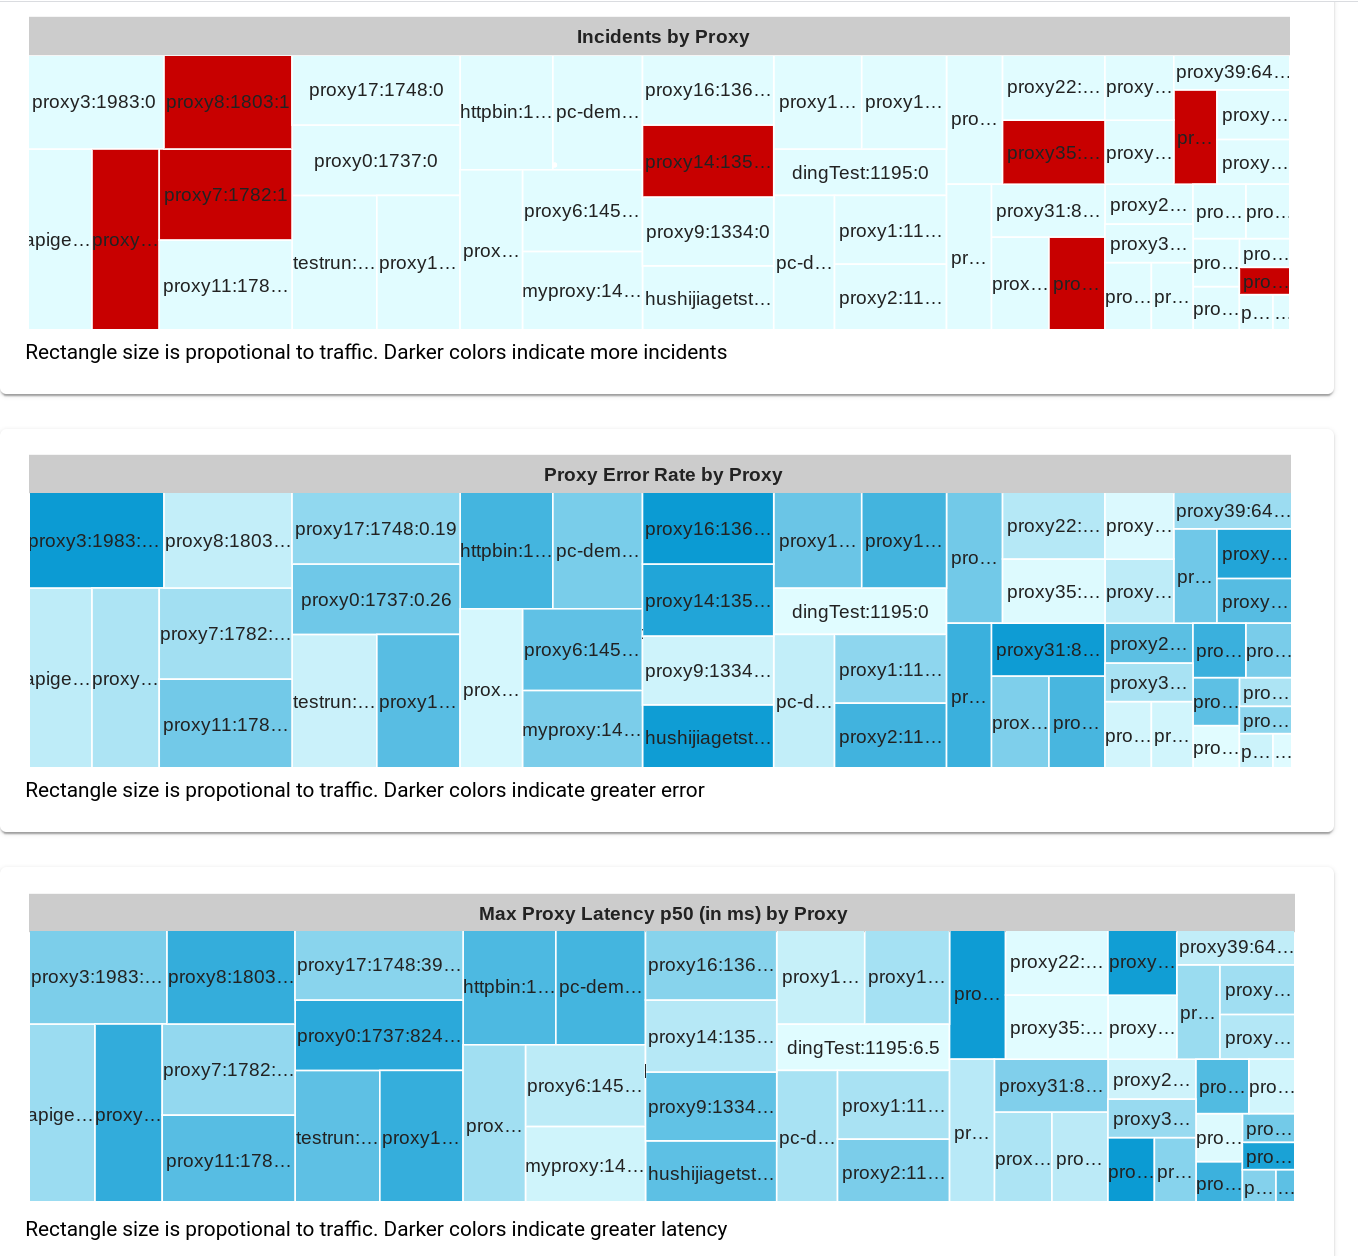
“最近”视图会显示三个树状图,其中每个代理的 API 流量都显示为一个矩形,其大小与该代理的流量成正比。矩形的颜色表示以下变量之一的相对大小(具体取决于您查看的树状图):
- 由提醒触发的突发事件数量
- 错误率
- 最大延迟时间(第 50 百分位)
请注意,如果您忽略矩形的颜色,则所有三个图表都将显示相同的底层矩形模式。这是因为每个代理的矩形大小仅取决于流量,这在所有三个图表中都相同。
例如,第二个图表按代理划分代理错误率会显示每个代理的错误率的相对大小:矩形颜色越深,错误率越高。如需在 Apigee 界面中查看一个代理的错误率值,请将光标移到该代理对应的矩形上。下面显示了一个示例:
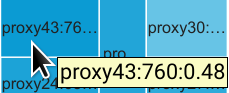
矩形中的文本会显示 proxy43 的以下数据:
- 总流量:760
- 错误率:0.48
由于 proxy43 的错误率在所有代理中最大,因此其矩形在图表中为最深的蓝色。
默认情况下,“最近”视图显示三个表:
- 按代理划分突发事件
- 按代理划分代理错误率
- 按代理划分代理最大延迟时间 p50(以毫秒为单位)
如时间轴视图中所示,您可以从图表菜单选择要显示的任意表组合。所有其他图表选项与时间轴视图中相同。
仔细查看手机数据分布
与“调查”视图中一样,您可以通过点击单元来查看各个表单元格的数据。此时右侧面板中会显示多个不同属性的数据分布。如需了解详情,请参阅查看手机数据的分布。