Apigee vous permet de créer des alertes déclenchées par des schémas de trafic d'API spécifiques, par exemple lorsque le taux d'erreur d'une API atteint un seuil prédéterminé. Les opérations d'API avancées (AAPI Ops) étendent cette capacité avec des alertes d'anomalie, déclenchées chaque fois qu'Apigee détecte des données de trafic des API inhabituelles. Les alertes d'anomalies présentent l'avantage de ne pas avoir à définir vous-même les conditions exactes pour chaque anomalie. Les opérations d'API avancées déterminent les bonnes conditions d'anomalie à l'aide de méthodes statistiques et les mettent à jour continuellement en fonction des données récentes sur le trafic.
Grâce à la détection d'anomalies, vous permettez à Apigee de détecter les problèmes de trafic et de performances, plutôt que de prédéterminer par vous-même les conditions d'alerte.
Lorsque les opérations d'API détectent une anomalie, l'événement s'affiche dans le tableau de bord des événements d'anomalies Cependant, elles ne déclenchent pas automatiquement une alerte pour l'anomalie. Si vous examinez une anomalie dans le tableau de bord et décidez que vous souhaitez être averti d'un événement semblable à l'avenir, vous pouvez créer une alerte d'anomalie et configurer une notification, qui vous envoie un message dès que l'anomalie est détectée.
Avant de créer une alerte d'anomalie, assurez-vous que vous disposez des rôles requis pour les opérations d'API.
Pour créer une alerte d'anomalie dans le tableau de bord des règles d'alerte, procédez comme suit :
Remarque : Ouvrez le tableau de bord "Créer une règle d'alerte" dans un nouvel onglet pour suivre les étapes ci-dessous.
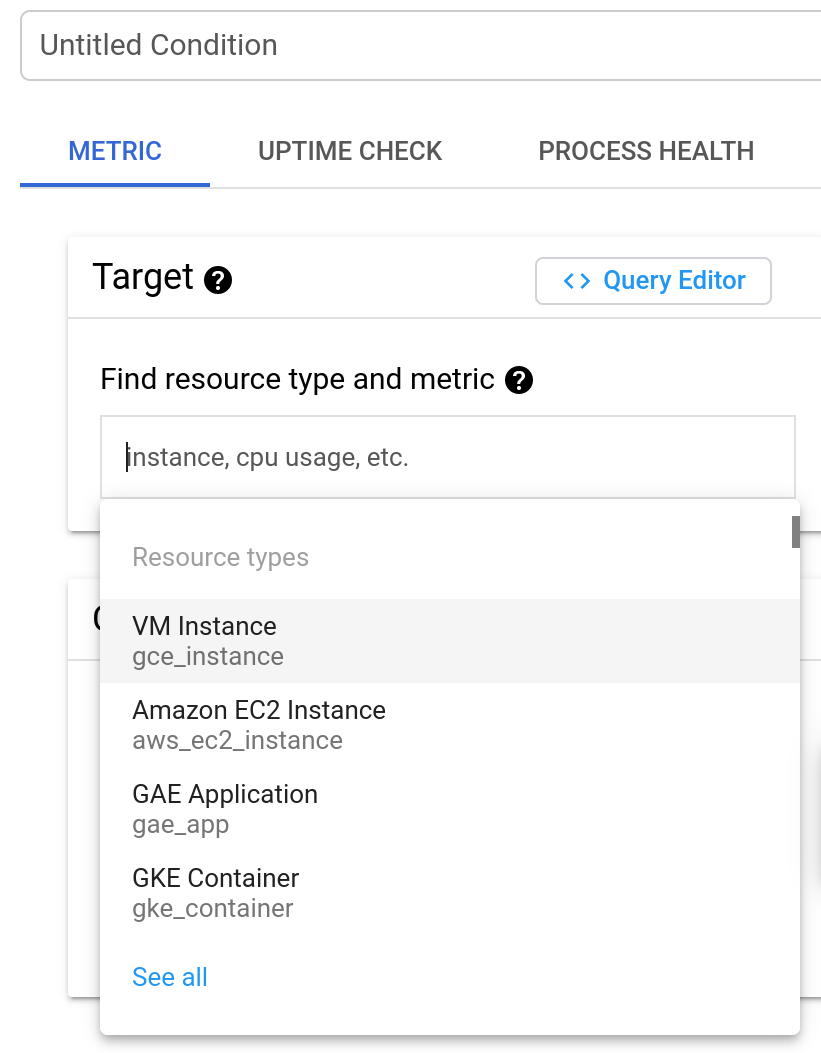
Cliquez sur AJOUTER UNE CONDITION. Une nouvelle fenêtre s'ouvre, dans laquelle vous pouvez ajouter la condition d'alerte.
Facultatif : ajoutez un intitulé pour la condition dans le champ Condition sans titre. Dans cet exemple, nous allons laisser ce champ vide : la condition se voit alors attribuer le titre par défaut.
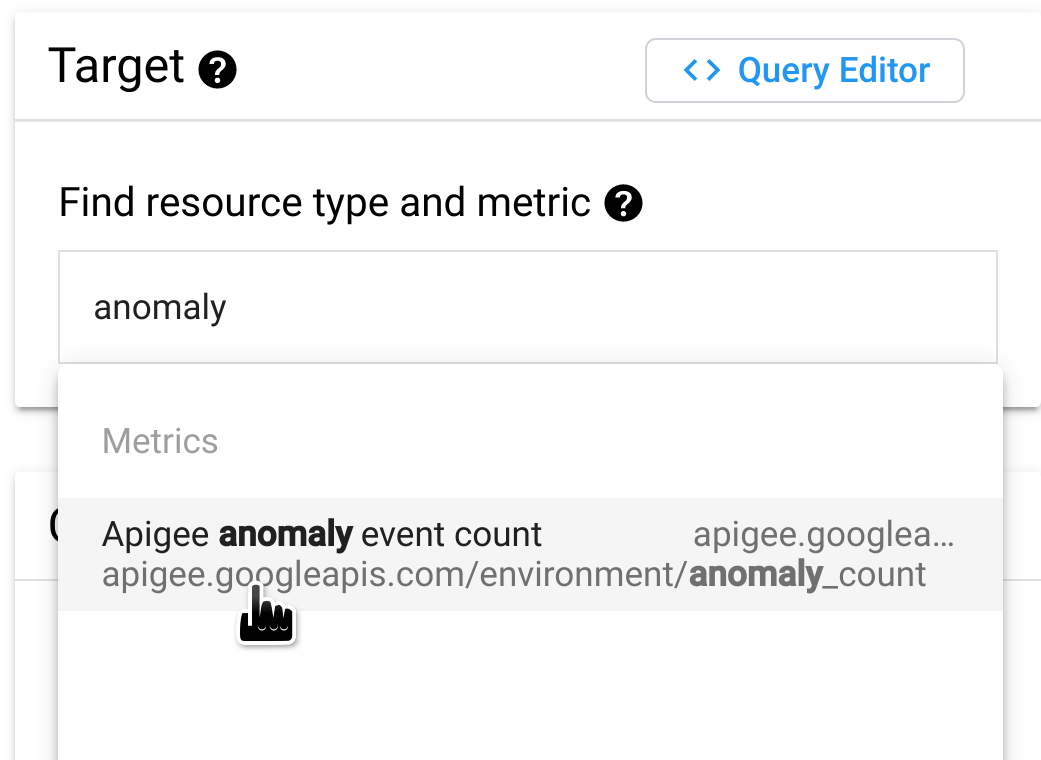
Dans le champ Rechercher un type de ressource et une métrique, saisissez
anomaly
puis sélectionnez Apigee Anomalies event count (Nombre d'événements d'anomalies Apigee).
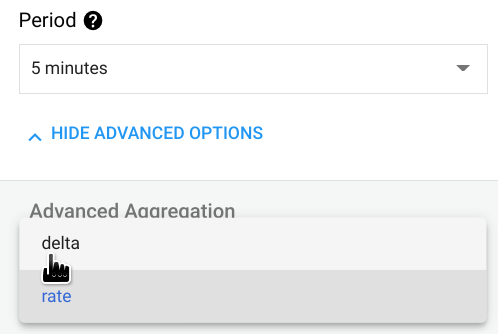
Cliquez sur AFFICHER LES PARAMÈTRES AVANCÉS et, dans le volet Agrégation avancée, sélectionnez delta dans le champ Aligneur. Cela spécifie la manière dont les données sont agrégées pour chaque période, que vous pouvez définir dans le champ Période.
Avec le paramètre delta, la valeur agrégée correspond à la valeur de données finale dans la période, moins la valeur de données initiale.
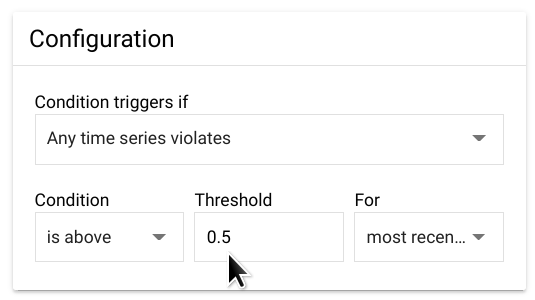
Dans le volet Configuration, définissez le champ Seuil sur 0,5.
(Tout nombre compris entre 0 et 1 fonctionnera pour le seuil.)
Avec cette valeur, une seule anomalie dépasse le seuil et déclenche l'alerte.
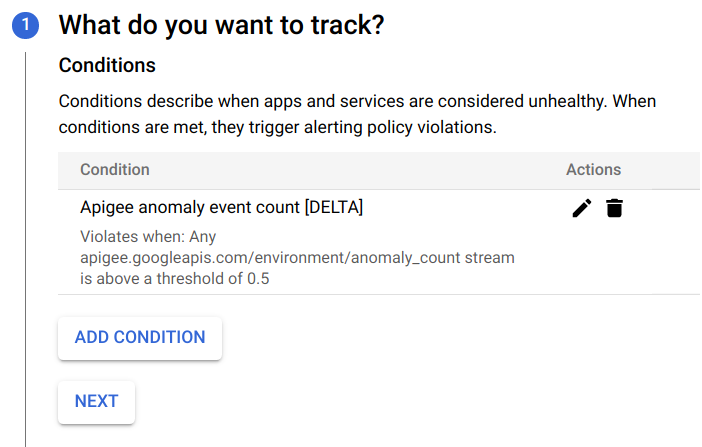
Cliquez sur Ajouter. Vous revenez à la page Créer une règle d'alerte, qui affiche désormais la condition que vous venez de créer.
À ce stade, vous pouvez choisir l'une des options suivantes :
Cliquer sur AJOUTER une condition pour créer une autre condition associée à l'alerte, ou
Cliquez sur NEXT (SUIVANT) pour passer à l'étape suivante, où vous aurez la possibilité de créer une notification pour l'alerte, comme décrit dans la section suivante.
Si vous ne souhaitez pas créer de notification, cliquez deux fois sur SUIVANT sans rien saisir pour contourner les étapes 2 et 3.
Cliquez sur ENREGISTRER pour enregistrer l'alerte.
Créer une notification pour une alerte
Si vous souhaitez être averti immédiatement en cas d'incident, vous pouvez créer une notification qui sera associée à l'alerte. Ainsi, lorsque l'alerte est déclenchée, Apigee vous envoie une notification. Vous pouvez choisir de recevoir la notification par l'un des canaux suivants :
E-mail
PagerDuty
Slack
Webhooks
Pour créer une notification pour une alerte, procédez comme suit :
Si vous venez de créer l'alerte (comme illustré dans l'exemple précédent) et que vous affichez actuellement le tableau de bord Créer une règle d'alerte, passez à l'étape suivante.
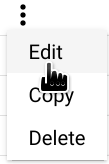
Sinon, ouvrez le volet Règles du tableau de bord des alertes dans la console Cloud, puis cliquez sur l'icône Trois points dans la ligne correspondant à l'alerte que vous avez créée et sélectionnez Modifier.
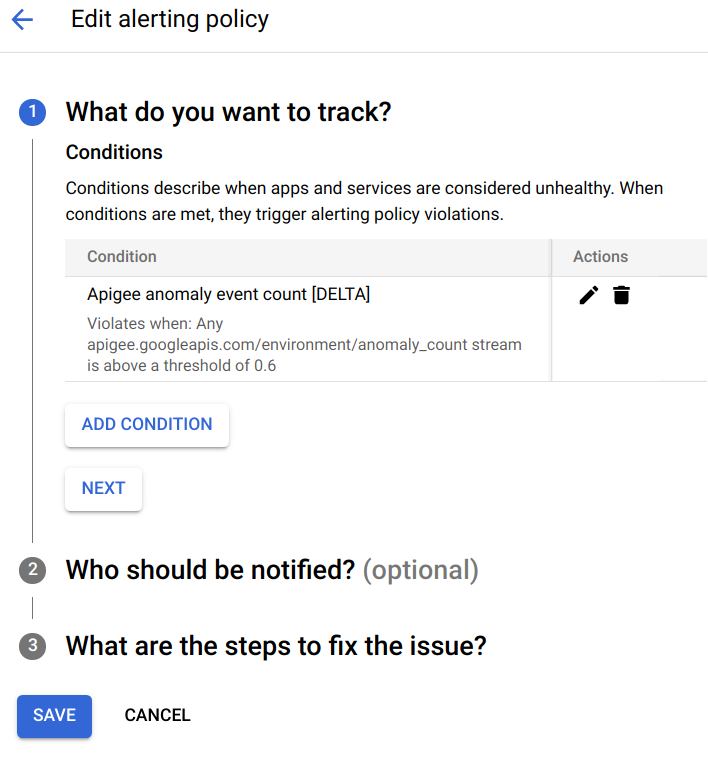
Le tableau de bord Modifier la règle d'alerte s'ouvre :
Dans la section Que voulez-vous surveiller ?, cliquez sur SUIVANT.
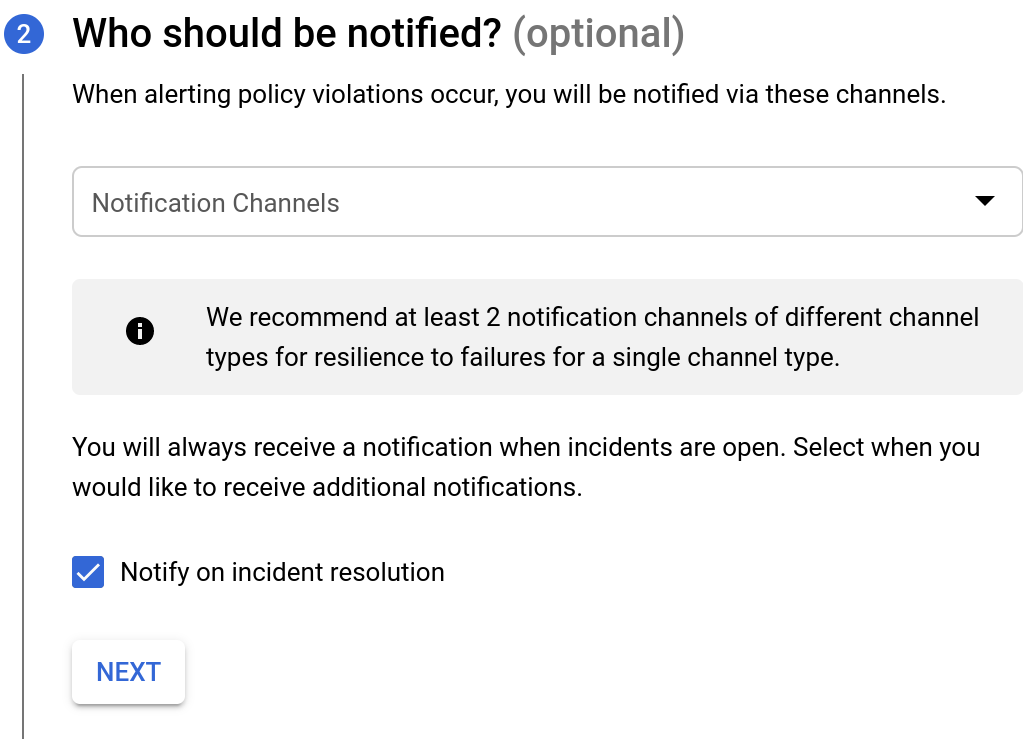
Dans la section Qui doit être informé, cliquez dans la zone de liste Canaux de notification. Vous pourrez alors choisir parmi les canaux existants celui de votre choix pour recevoir des notifications.
Si vous souhaitez créer un canal de notification, sélectionnez GÉRER LES CANAUX DE NOTIFICATION. Le tableau de bord "Canaux de notification" va alors s'ouvrir dans la console Cloud, et vous permet d'ajouter des canaux. Pour en savoir plus, consultez la page Créer et gérer des canaux de notification.
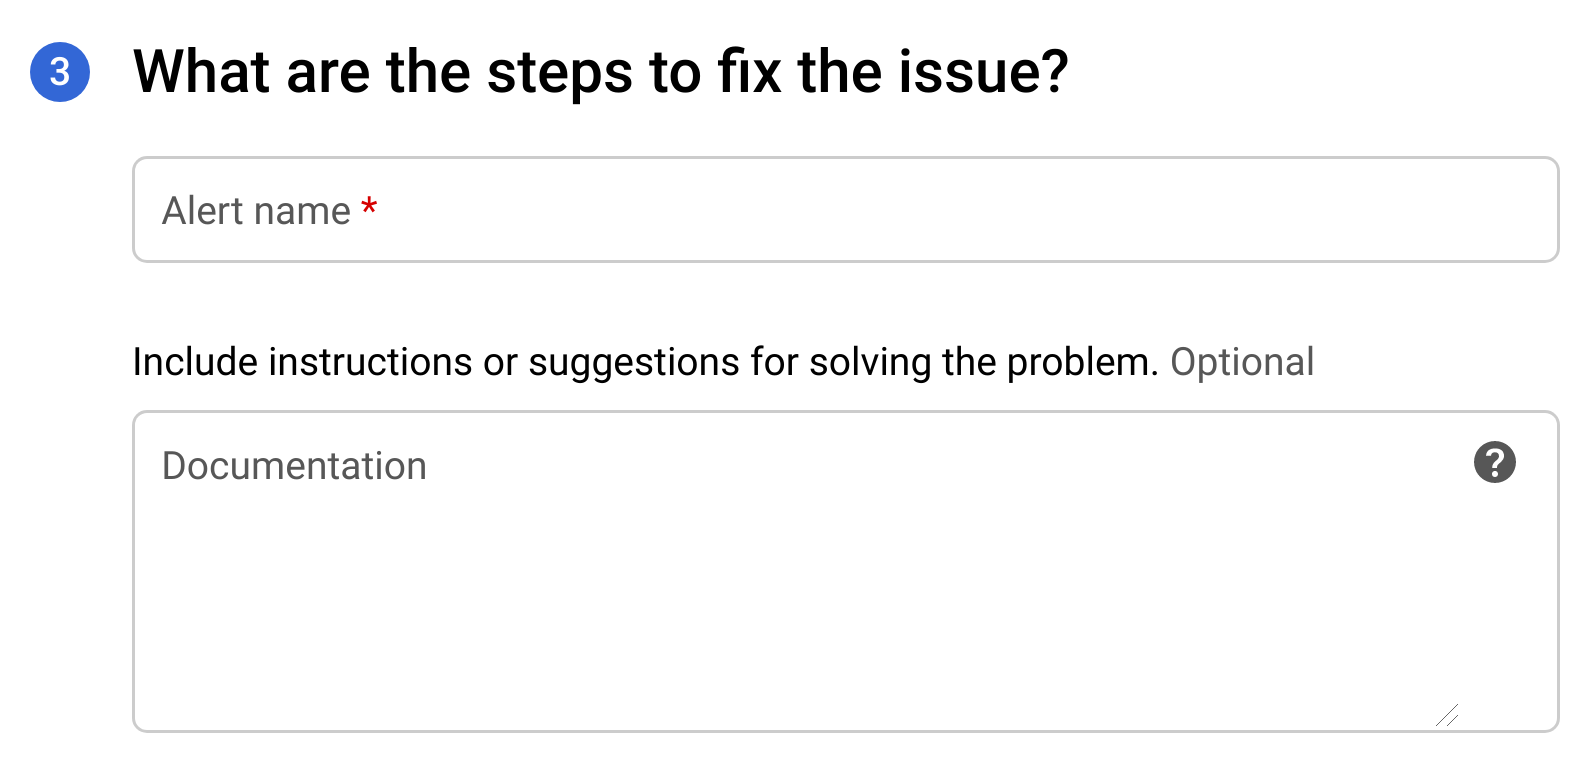
Cliquez sur NEXT (Suivant). Les options s'affichent, comme illustré ci-dessous.
Dans le champ Nom de l'alerte, saisissez le nom de l'alerte.
Dans le champ Documentation, saisissez l'URL d'une page Web incluant des informations sur la façon de résoudre le problème à l'origine de l'alerte. L'URL sera incluse dans la notification.
Cliquez sur Enregistrer pour créer l'alerte.
Lorsqu'une alerte est déclenchée, vous recevez une notification contenant un résumé de l'incident et indiquant quand celui-ci s'est produit. La notification contient également deux liens pour vous aider à étudier l'incident :
AFFICHER L'INCIDENT : affichez l'incident dans Cloud Console.
AFFICHER DANS APIGEE : permet d'afficher un graphique de chronologie du trafic de l'API et des tables de données associées dans le tableau de bord "Examen de l'API Monitoring".
Sauf indication contraire, le contenu de cette page est régi par une licence Creative Commons Attribution 4.0, et les échantillons de code sont régis par une licence Apache 2.0. Pour en savoir plus, consultez les Règles du site Google Developers. Java est une marque déposée d'Oracle et/ou de ses sociétés affiliées.
Dernière mise à jour le 2025/09/04 (UTC).
[[["Facile à comprendre","easyToUnderstand","thumb-up"],["J'ai pu résoudre mon problème","solvedMyProblem","thumb-up"],["Autre","otherUp","thumb-up"]],[["Difficile à comprendre","hardToUnderstand","thumb-down"],["Informations ou exemple de code incorrects","incorrectInformationOrSampleCode","thumb-down"],["Il n'y a pas l'information/les exemples dont j'ai besoin","missingTheInformationSamplesINeed","thumb-down"],["Problème de traduction","translationIssue","thumb-down"],["Autre","otherDown","thumb-down"]],["Dernière mise à jour le 2025/09/04 (UTC)."],[[["\u003cp\u003eApigee offers anomaly alerts that automatically detect unusual API traffic patterns without requiring users to manually define specific anomaly conditions.\u003c/p\u003e\n"],["\u003cp\u003eAnomaly detection events are displayed on the Anomaly Events dashboard, and users can choose to set up anomaly alerts with notifications for similar future events.\u003c/p\u003e\n"],["\u003cp\u003eTo create an anomaly alert, users must navigate to the "Create alerting policy" dashboard in the Google Cloud console and select "Apigee anomaly event count" as the metric.\u003c/p\u003e\n"],["\u003cp\u003eUsers can configure notifications for anomaly alerts to be sent via email, PagerDuty, Slack, or webhooks when an anomaly is detected.\u003c/p\u003e\n"],["\u003cp\u003eWhen an anomaly alert is triggered, notifications include links to view the incident in the Cloud console and an API traffic timeline graph in the API Monitoring Investigate dashboard.\u003c/p\u003e\n"]]],[],null,["# Creating anomaly alerts\n\n*This page\napplies to **Apigee** and **Apigee hybrid**.*\n\n\n*View [Apigee Edge](https://docs.apigee.com/api-platform/get-started/what-apigee-edge) documentation.*\n\nApigee enables you to create alerts that are triggered by specific API traffic patterns---\nfor example, when an API's\nerror rate reaches a predetermined threshold. AAPI Ops extends this capability with\n*anomaly alerts*, which are triggered whenever Apigee detects unusual API traffic\ndata. The advantage of anomaly alerts is that you don't have to define the exact conditions\nfor each anomaly yourself. AAPI Ops determines the right anomaly conditions using statistical methods,\nand constantly updates them based on recent traffic data.\nUsing anomaly detection, you let Apigee detect traffic and performance issues, rather than\npredetermining the alert conditions yourself.\n| **Important:** \"Anomaly Detection\" describes the Advanced API Operations Anomaly Detection functionality, which is available in the Classic Apigee UI. This functionality is comparable to the \"Operations Anomalies\" functionality in [Apigee UI in Cloud console](https://console.cloud.google.com/apigee). Both are available at this time. See [Operations Anomalies overview](/apigee/docs/api-platform/analytics/operations-anomalies-overview) for information on the Operations Anomalies functionality.\n\nWhen AAPI-Ops detects an anomaly, it displays the event in the Anomaly Events\ndashboard. However, it doesn't automatically raise an alert for\nthe anomaly. If you examine an anomaly in the dashboard and decide you want to be alerted about\nsimilar event in future, you can create an anomaly alert\nand set up a notification, which sends you a message whenever the anomaly is detected.\n\nBefore creating an anomaly alert, make sure you have been assigned the\n[required roles](/apigee/docs/aapi-ops#required-roles-for-aapi-ops)\nfor AAPI Ops.\n\nTo create an anomaly alert in the Alerting policy dashboard, do the following:\n\n1. Open the\n [Create alerting policy](https://console.cloud.google.com/monitoring/alerting/policies/create?) dashboard in the Google Cloud console.\n\n **Note:** Open the Create alerting policy dashboard in a new tab if you want to follow\n the steps below.\n2. Click **ADD CONDITION** . This opens a new window where you can add the alert condition.\n\n\n3. Optional: Add a title for the condition in the **Untitled Condition** field. We'll leave it blank for this example, in which case the condition is given a default title.\n4. In the **Find resource type and metric** field, type\n\n ```\n anomaly\n ```\n\n and then select **Apigee anomaly event count**.\n5. Click **SHOW ADVANCED SETTINGS** and in the **Advanced Aggregation** pane,\n select **delta** in the **Aligner** field. This specifies how the data is\n aggregated over each time period, which you can set in the **Period** field.\n With the **delta** setting, the aggregated value equals the\n final data value in the time period minus the initial data value.\n\n6. In the **Configuration** pane, set the **Threshold** to **0.5**.\n (Any number between 0 and 1 will work for the threshold.)\n With this value, a single anomaly exceeds the threshold and triggers the alert.\n\n7. Click **Add** . This takes you back to the **Create alerting policy** page\n where you can see the condition you just created.\n\nAt this point you can choose to either:\n\n- Click **ADD Condition** to create another condition for the alert, or\n- Click **NEXT** to go to the next step, where you will have the option to [create a notification for the\n alert](#creating-a-notification-for-an-alert), as described in the next section.\n\nIf you don't want to create a notification, click **NEXT** twice\nwithout entering anything to bypass Steps 2 and 3.\n\nClick **SAVE** to save the alert.\n\nCreating a notification for an alert\n------------------------------------\n\nIf you want to be notified immediately when an incident occurs, you can create\na notification for the alert. When the alert is triggered, Apigee sends you\na notification. You can choose any of the following channels to receive\nthe notification:\n\n- Email\n- PagerDuty\n- Slack\n- Webhooks\n\n| **Note:** Currently, to receive a notification, you must add **org** to the **Group by** field in the alert. This requirement will be removed in a future release.\n\nTo create a notification for an alert:\n\n1. If you just created the alert (as shown in the\n preceding example) and are currently viewing the\n **Create alerting policy** dashboard, skip to the next step.\n\n Otherwise, open the\n [**Policies** pane](https://console.cloud.google.com/monitoring/alerting/policies) in the Cloud console Alerting dashboard, and in\n the row for the alert you created, click the three dots icon at the end\n of the row and select **Edit**.\n\n This opens the **Edit alerting policy** dashboard:\n2. In the **What do you want to track?** section, click **NEXT**.\n\n3. In the **Who should be notified** section, select\n **Notification Channels**, where you can choose from existing channels for receiving\n notifications.\n\n If you want to create a new\n notification channel, select **MANAGE NOTIFICATION CHANNELS** . This\n opens the Notification channels dashboard in the Cloud console, where you can\n add channels. See\n [Create and manage notification channels](https://cloud.google.com/monitoring/support/notification-options) for more details.\n4. Click **NEXT**. This displays the options shown below.\n\n5. In the **Alert name** field, enter a name for the alert.\n6. In the **Documentation** field, enter the URL for a web page that provides information on how to fix the issue that caused the alert. The URL will be included in the notification.\n7. Click **Save** to create the alert.\n\nWhen an alert is triggered, you will receive a notification\nproviding a summary of the incident and when it occurred. The notification\nalso contains two links to help you investigate the incident:\n\n- **VIEW INCIDENT**: View the incident in the Cloud console.\n- **VIEW IN APIGEE** : View a timeline graph of API traffic and related data tables in the [API Monitoring Investigate dashboard](/apigee/docs/api-monitoring/investigate)."]]