Questa pagina si applica ad Apigee e Apigee hybrid.
Visualizza la documentazione di
Apigee Edge.

La dashboard Eventi anomali nell'interfaccia utente Apigee è la tua fonte principale di informazioni sulle anomalie API rilevate. La dashboard mostra un elenco di anomalie recenti.
Prima di aprire la dashboard, assicurati di aver ricevuto i ruoli richiesti per AAPI Ops.
Per aprire la dashboard delle anomalie:
Apigee in Cloud Console
-
Nella console Google Cloud , vai alla pagina Anomalie delle operazioni.
- Passa all'organizzazione che vuoi monitorare.
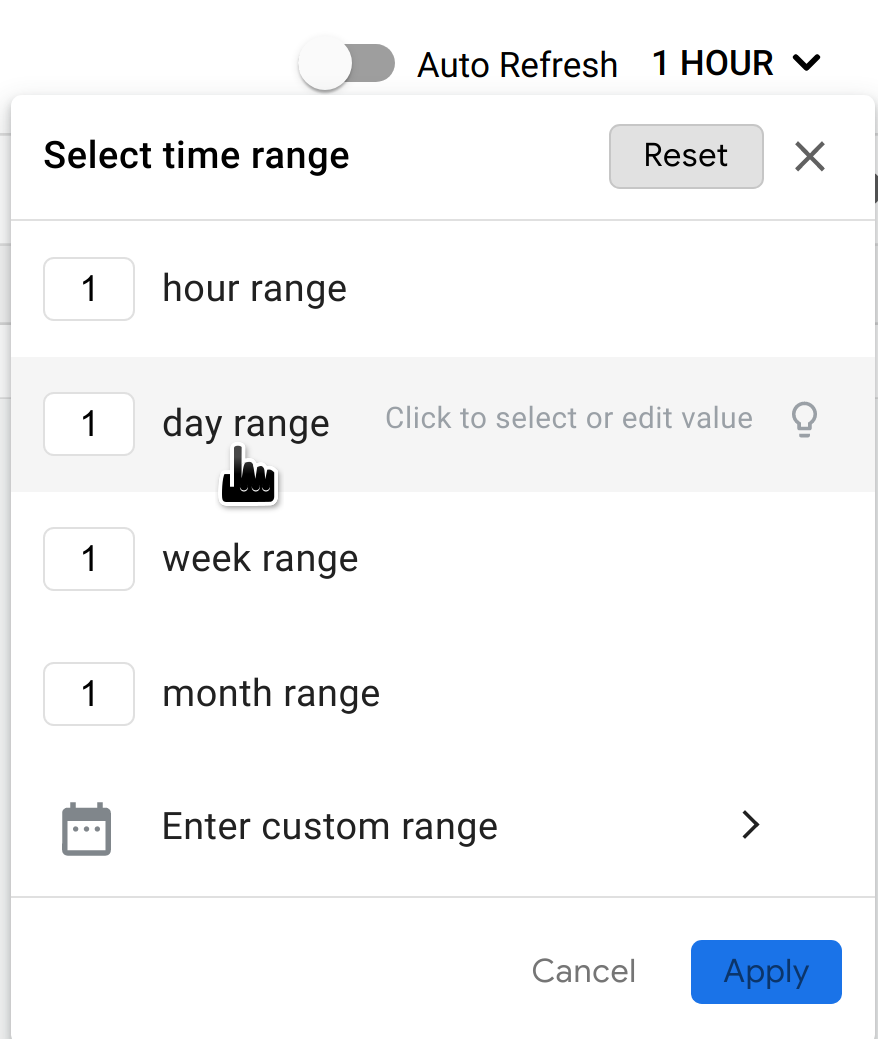
Per impostazione predefinita, la dashboard mostra le anomalie che si sono verificate nell'ora precedente. Se non sono state rilevate anomalie durante questo periodo di tempo, nella dashboard non vengono visualizzate righe. In questo caso, puoi selezionare un intervallo di tempo più ampio dal menu dell'intervallo di tempo in alto a destra nella dashboard.
Ogni riga della tabella corrisponde a un'anomalia rilevata e mostra le seguenti informazioni:
- La data e l'ora dell'anomalia.
- Un breve riepilogo dell'anomalia, incluso il proxy in cui si è verificata e il codice di errore che l'ha attivata.
- L'ambiente in cui si è verificata l'anomalia.
- La regione in cui si è verificata l'anomalia.
- La gravità dell'evento anomalo: lieve, moderata o grave. La gravità si basa su una misura statistica (valore p) della probabilità che l'evento si verifichi per caso (più è improbabile l'evento, maggiore è la sua gravità).
Puoi esaminare ulteriormente un'anomalia per determinare quali azioni, se presenti, devi intraprendere in risposta. Il punto di partenza migliore per la tua indagine sono le dashboard di API Monitoring, dove puoi visualizzare vari grafici dei dati recenti sul traffico API. La sezione successiva, Analisi delle anomalie, descrive come farlo.
UI classica
Accedi alla UI Apigee.
Nota:apri la UI di Apigee in una nuova scheda se vuoi seguire i passaggi riportati di seguito.
- Passa all'organizzazione che vuoi monitorare.
- Nel riquadro di navigazione, seleziona Analizza > Eventi anomali.
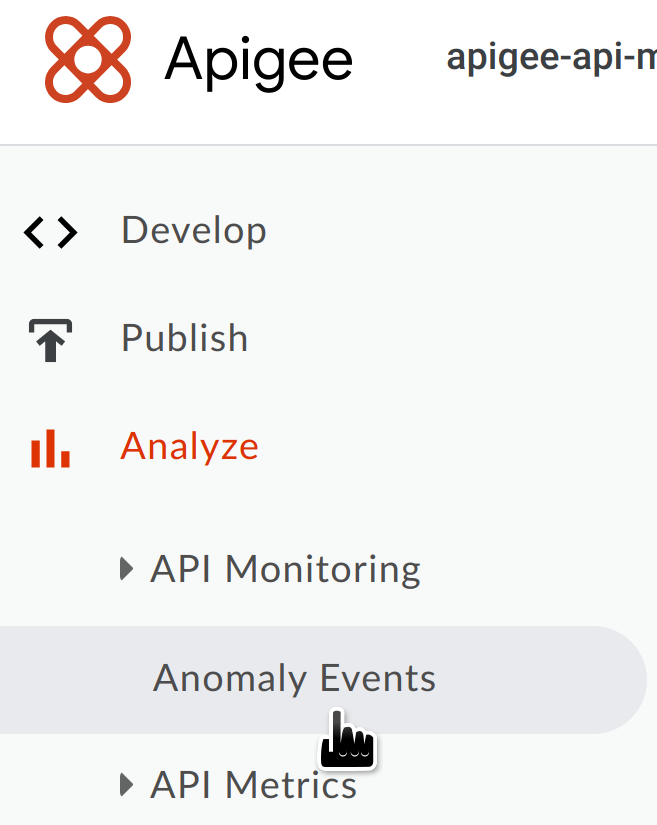
Viene visualizzata la dashboard Anomaly Events.
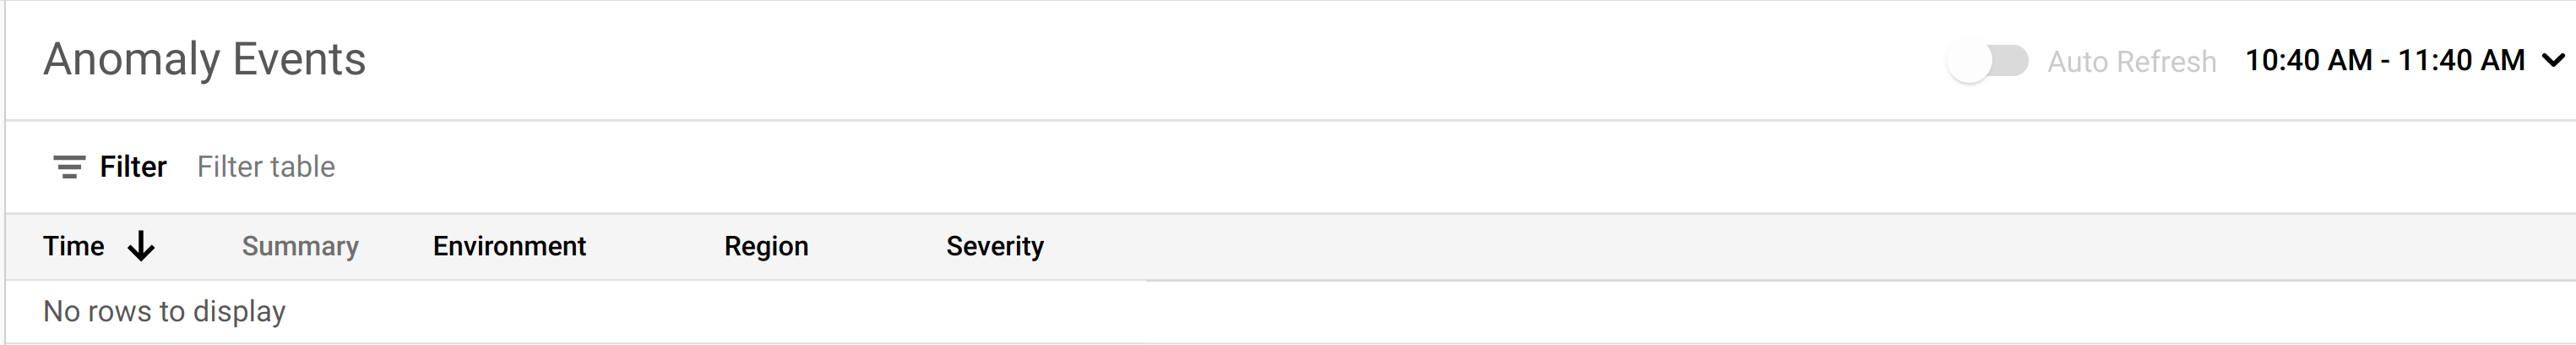
Per impostazione predefinita, la dashboard mostra le anomalie che si sono verificate nell'ora precedente. Se non sono state rilevate anomalie durante questo periodo di tempo, nella dashboard non vengono visualizzate righe. In questo caso, puoi selezionare un intervallo di tempo più ampio dal menu dell'intervallo di tempo in alto a destra nella dashboard.
Se sono presenti anomalie in questo intervallo di tempo, vengono visualizzate in modo simile a quelle mostrate di seguito.
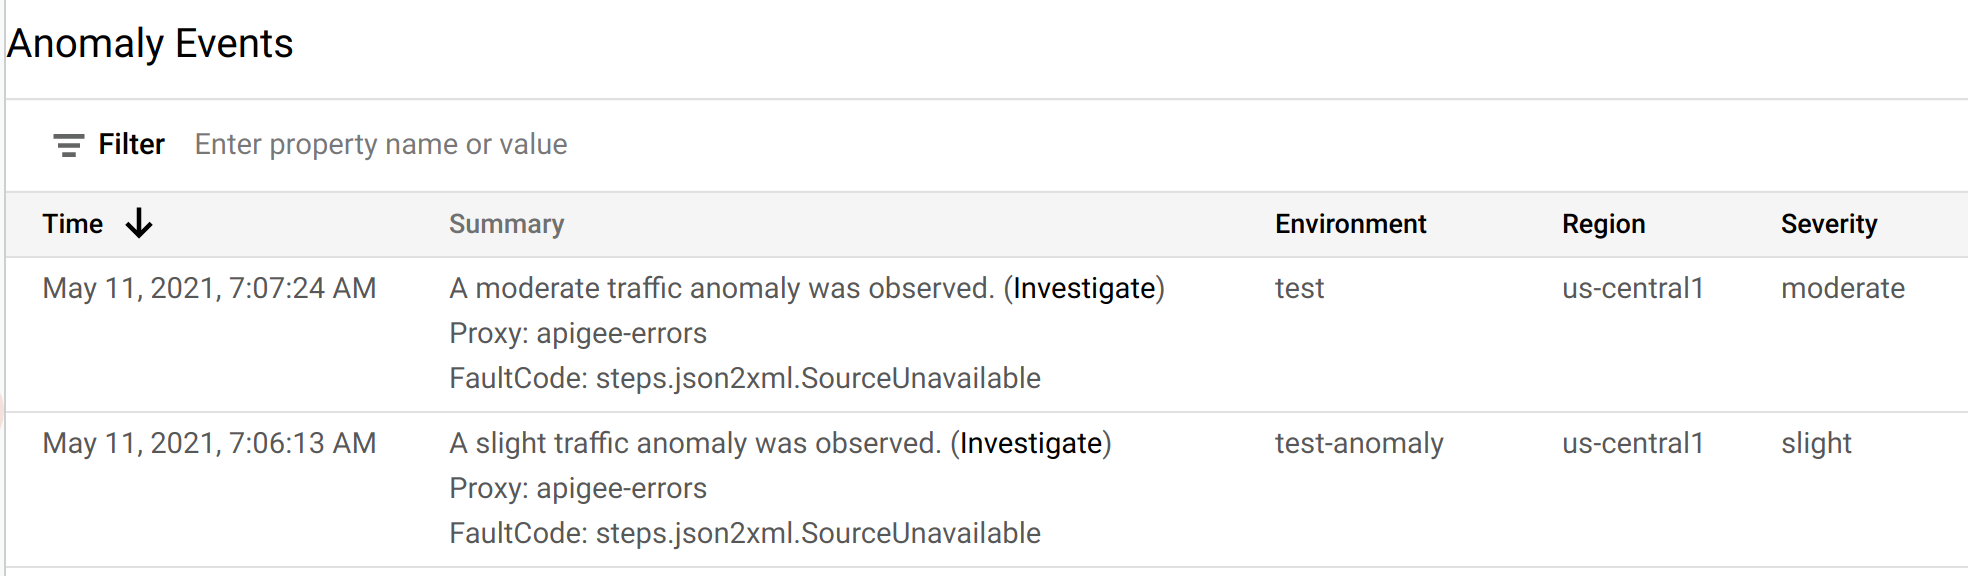
Ogni riga della tabella corrisponde a un'anomalia rilevata e mostra le seguenti informazioni:
- La data e l'ora dell'anomalia.
- Un breve riepilogo dell'anomalia, incluso il proxy in cui si è verificata e il codice di errore che l'ha attivata.
- L'ambiente in cui si è verificata l'anomalia.
- La regione in cui si è verificata l'anomalia.
- La gravità dell'evento anomalo: lieve, moderata o grave. La gravità si basa su una misura statistica (valore p) della probabilità che l'evento si verifichi per caso (più è improbabile l'evento, maggiore è la sua gravità).
Puoi esaminare ulteriormente un'anomalia per determinare quali azioni, se presenti, devi intraprendere in risposta. Il punto di partenza migliore per la tua indagine sono le dashboard di API Monitoring, dove puoi visualizzare vari grafici dei dati recenti sul traffico API. La sezione successiva, Analisi delle anomalie, descrive come farlo.