Esta página se aplica a Apigee y Apigee Hybrid.
Consulta la documentación de
Apigee Edge.

El panel de eventos de anomalías en la IU de Apigee es tu fuente principal de información sobre anomalías detectadas en la API. En el panel, se muestra una lista de anomalías recientes.
Antes de abrir el panel, asegúrate de que se te hayan asignado las funciones necesarias para AAPI Ops.
Para abrir el panel de anomalías, sigue estos pasos:
Apigee en la consola de Cloud
-
En la consola de Google Cloud , ve a la página Anomalías en las operaciones.
- Cambia a la organización que deseas supervisar.
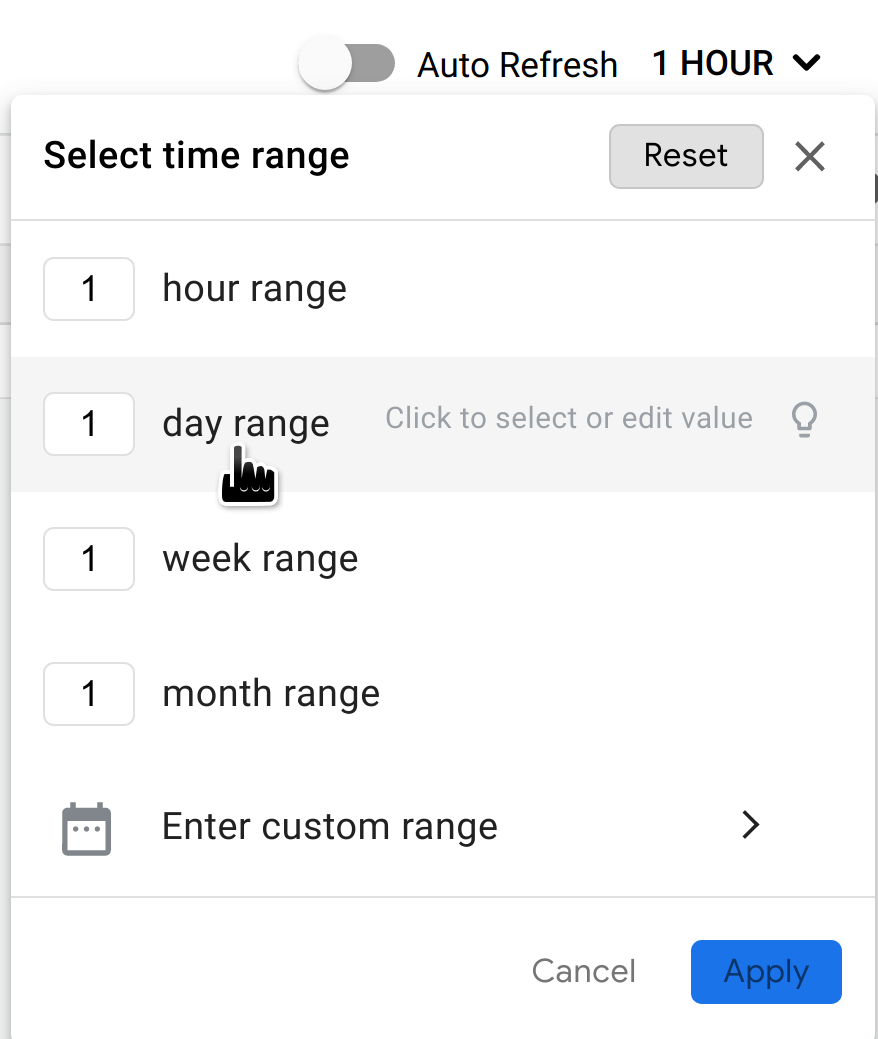
De manera predeterminada, el panel muestra anomalías que ocurrieron durante la hora anterior. Si no se detectaron anomalías durante ese período, no se mostrarán filas en el panel. En ese caso, puedes seleccionar un intervalo de tiempo mayor desde el menú de intervalos de tiempo en la parte superior derecha del panel.
Cada fila de la tabla corresponde a una anomalía detectada y muestra la siguiente información:
- La fecha y hora de la anomalía.
- Un breve resumen de la anomalía, incluido el proxy en el que ocurrió y el código de falla que lo activó.
- El entorno en el que se produjo la anomalía.
- La región en la que se produjo la anomalía.
- Gravedad del evento de la anomalía: leve, moderado o grave. La gravedad se basa en una medida estadística (valor p) de la probabilidad de que se genere el evento por casualidad (mientras menos probable sea el evento, mayor será su gravedad).
Puedes investigar con más detalle una anomalía para determinar qué acciones debes tomar en respuesta a alguna, si las hubiera. El mejor punto de partida para tu investigación son los paneles de supervisión de la API, en los que puedes ver varios grafos de datos recientes del tráfico de la API. En la siguiente sección, Investiga anomalías, se describe cómo hacerlo.
IU clásica
Accede a la IU de Apigee.
Nota: Abre la IU de Apigee en una pestaña nueva si deseas seguir los pasos que se indican a continuación.
- Cambia a la organización que deseas supervisar.
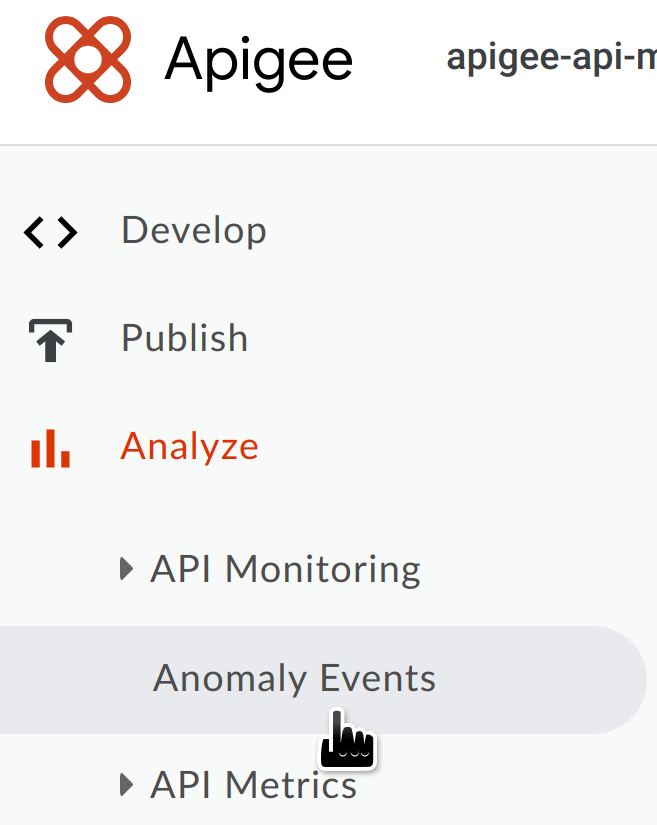
- En el panel de navegación, selecciona Analizar > Eventos de anomalías.
Se mostrará el panel de eventos de anomalías.
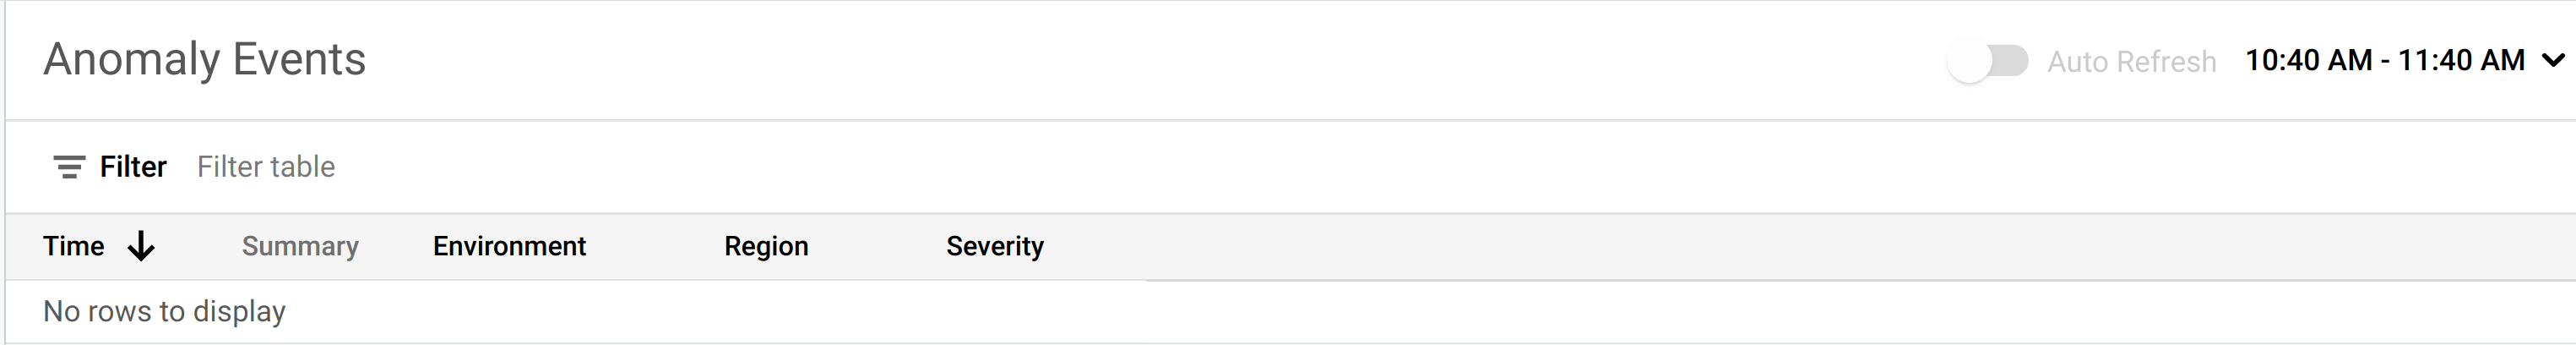
De manera predeterminada, el panel muestra anomalías que ocurrieron durante la hora anterior. Si no se detectaron anomalías durante ese período, no se mostrarán filas en el panel. En ese caso, puedes seleccionar un intervalo de tiempo mayor desde el menú de intervalos de tiempo en la parte superior derecha del panel.
Si hay anomalías en este intervalo de tiempo, se muestran de manera similar a las que se muestran a continuación.
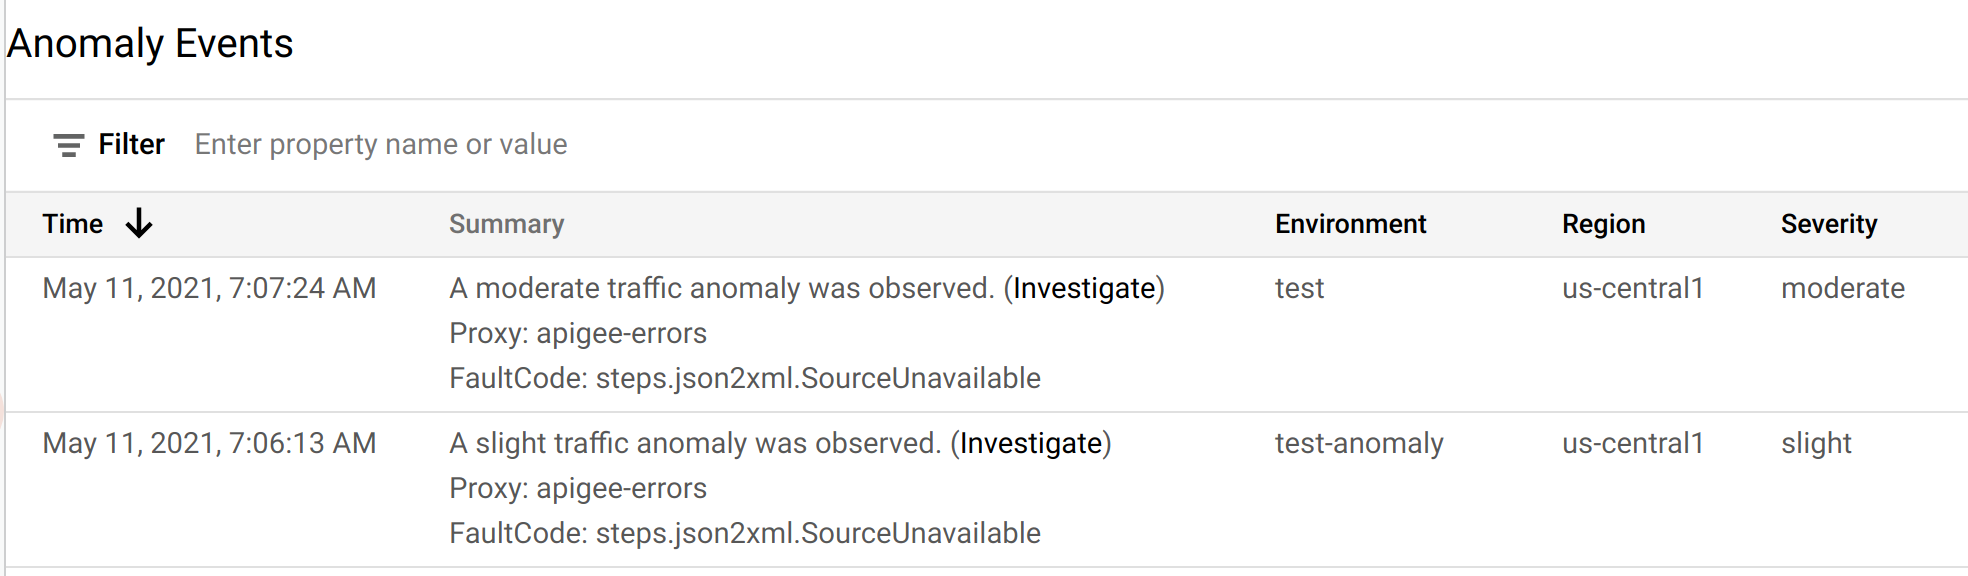
Cada fila de la tabla corresponde a una anomalía detectada y muestra la siguiente información:
- La fecha y hora de la anomalía.
- Un breve resumen de la anomalía, incluido el proxy en el que ocurrió y el código de falla que lo activó.
- El entorno en el que se produjo la anomalía.
- La región en la que se produjo la anomalía.
- Gravedad del evento de la anomalía: leve, moderado o grave. La gravedad se basa en una medida estadística (valor p) de la probabilidad de que se genere el evento por casualidad (mientras menos probable sea el evento, mayor será su gravedad).
Puedes investigar con más detalle una anomalía para determinar qué acciones debes tomar en respuesta a alguna, si las hubiera. El mejor punto de partida para tu investigación son los paneles de supervisión de la API, en los que puedes ver varios grafos de datos recientes del tráfico de la API. En la siguiente sección, Investiga anomalías, se describe cómo hacerlo.