Le tableau de bord des événements d'anomalies dans l'interface utilisateur d'Apigee est votre source d'informations principale sur les anomalies d'API détectées. Le tableau de bord affiche une liste d'anomalies récentes.
Avant d'ouvrir le tableau de bord, assurez-vous que vous disposez des rôles requis pour les opérations d'API.
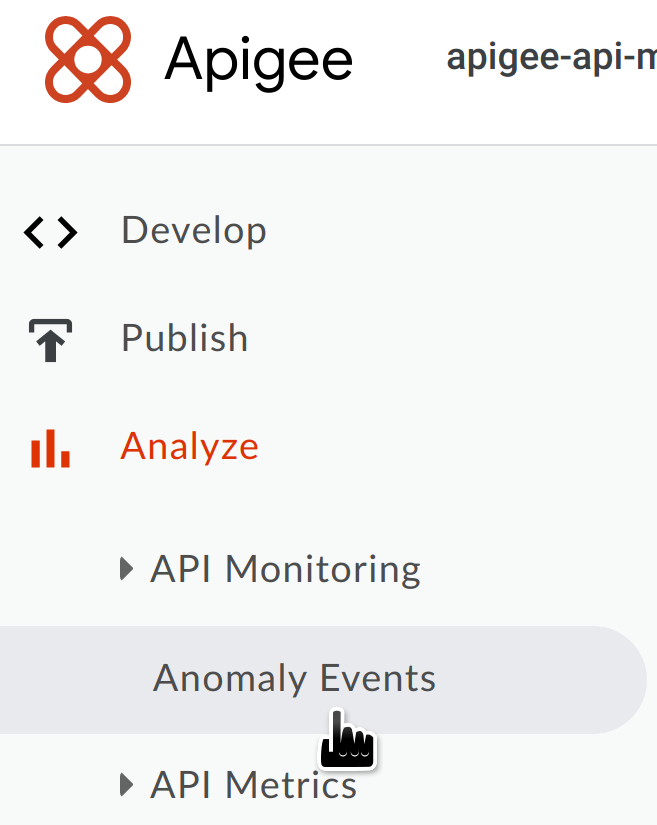
Pour ouvrir le tableau de bord "Événements d'anomalies", procédez comme suit :
Dans le volet de navigation, sélectionnez Analyze > Anomaly Events (Analyser > Événements d'anomalies).
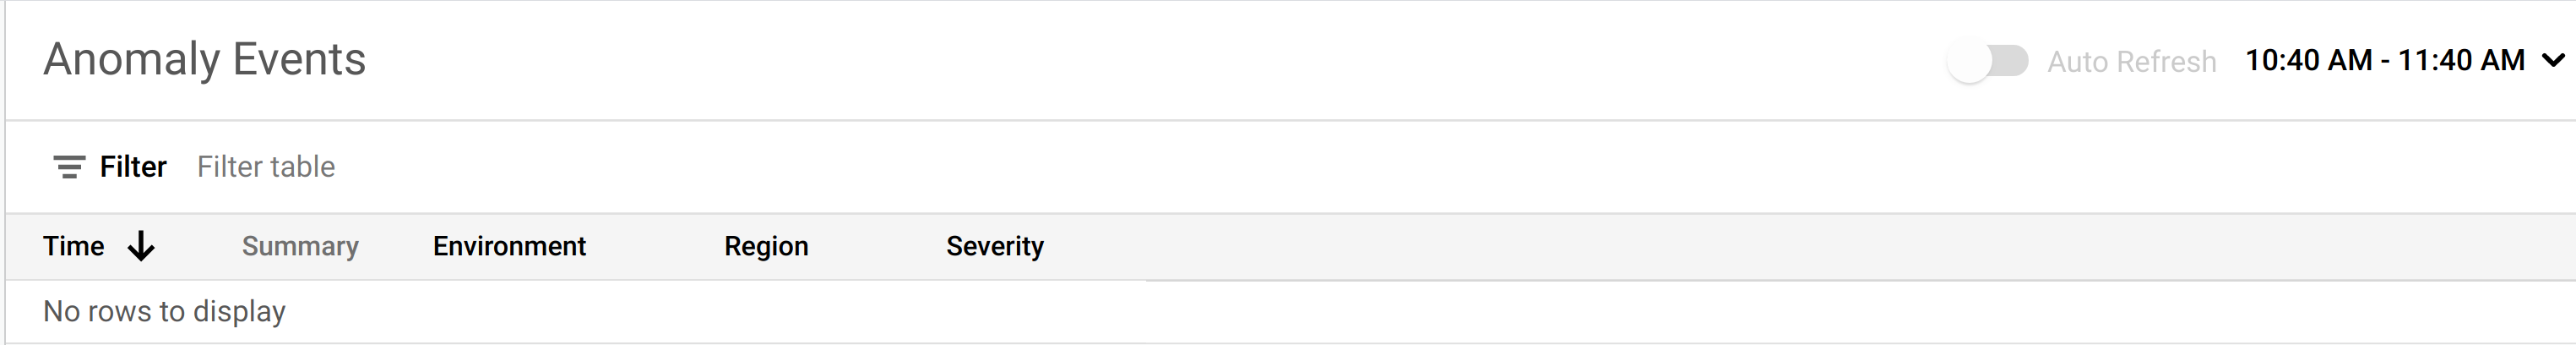
Le tableau de bord "Événements d'anomalies" s'affiche.
Par défaut, le tableau de bord affiche les anomalies qui se sont produites pendant l'heure précédente.
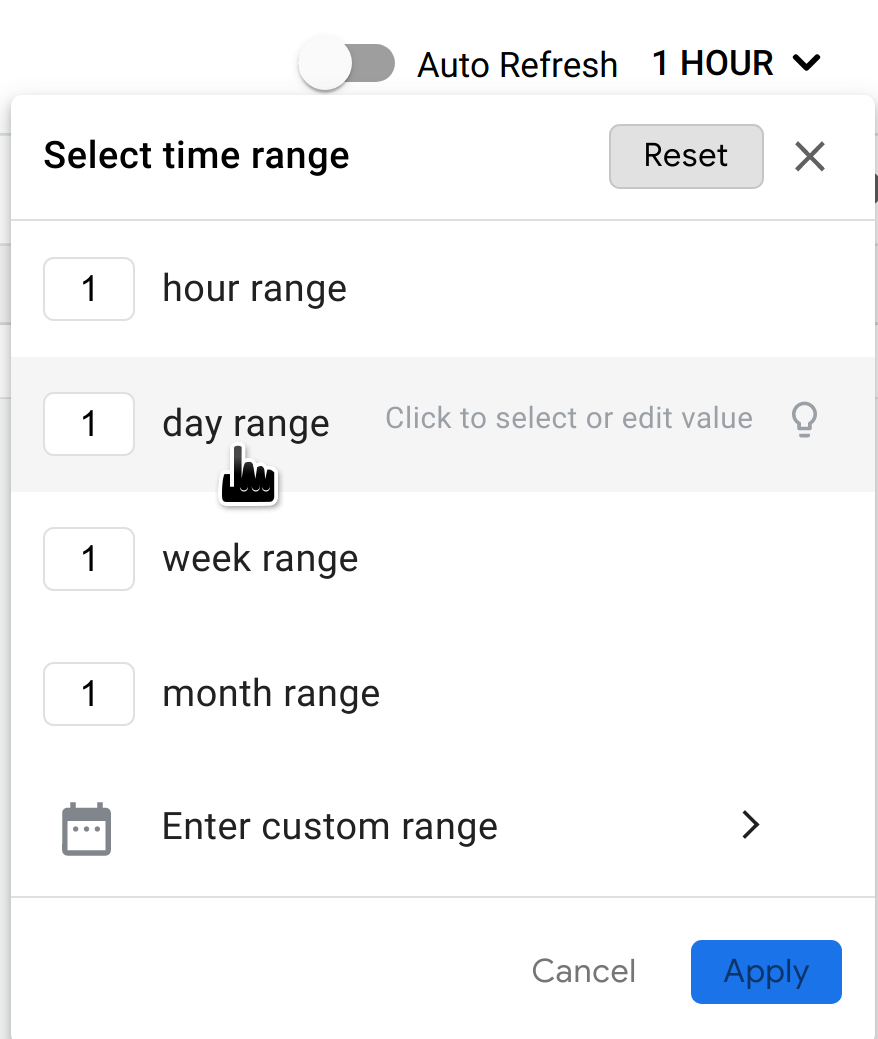
Si aucune anomalie n'a été détectée pendant cette période, aucune ligne n'est affichée dans le tableau de bord. Dans ce cas, vous pouvez sélectionner une période plus longue dans le menu situé en haut à droite du tableau de bord.
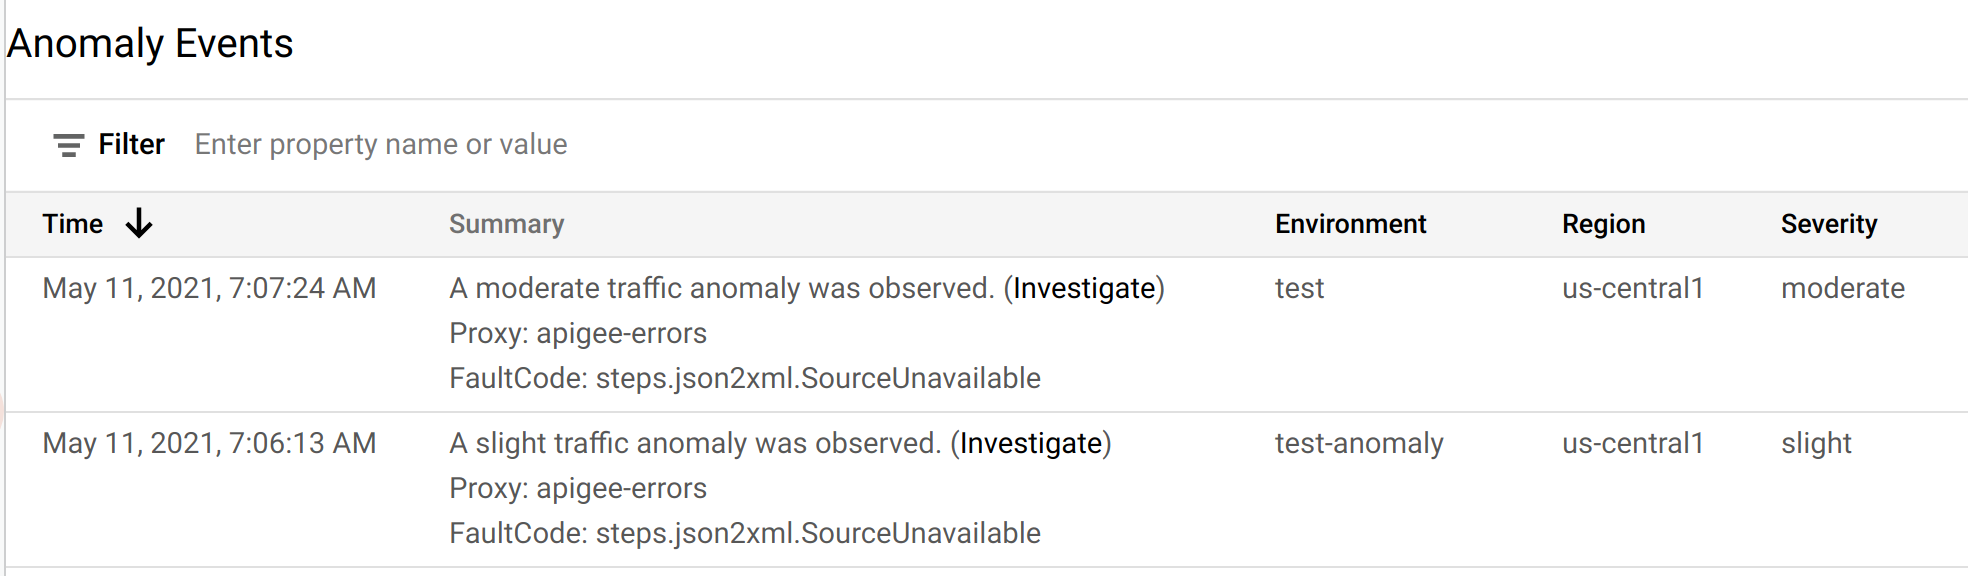
Si des anomalies ont été détectées au cours de cette période, elles sont affichées de la même manière que celles présentées dans la figure ci-dessous.
Chaque ligne du tableau correspond à une anomalie détectée et affiche les informations suivantes :
Date et heure de l'anomalie.
Bref résumé de l'anomalie, y compris le proxy dans lequel elle s'est produite et le code d'erreur qui l'a déclenchée.
Environnement dans lequel l'anomalie s'est produite.
Région dans laquelle l'anomalie s'est produite.
Gravité de l'événement d'anomalie : légère, modérée ou grave. Le niveau de gravité est basé sur une mesure statistique (p-valeur) évaluant la probabilité que l'événement se produise (plus l'événement est improbable, plus sa gravité est élevée).
Vous pouvez enquêter sur une anomalie pour déterminer les actions à effectuer, le cas échéant.
Le meilleur point de départ de votre enquête est de consulter les tableaux de bord de l'API Monitoring, dans lesquels vous pouvez afficher différents graphiques du trafic récent des API. La procédure à suivre est expliquée dans la section
Enquêter sur les anomalies.
Sauf indication contraire, le contenu de cette page est régi par une licence Creative Commons Attribution 4.0, et les échantillons de code sont régis par une licence Apache 2.0. Pour en savoir plus, consultez les Règles du site Google Developers. Java est une marque déposée d'Oracle et/ou de ses sociétés affiliées.
Dernière mise à jour le 2025/09/04 (UTC).
[[["Facile à comprendre","easyToUnderstand","thumb-up"],["J'ai pu résoudre mon problème","solvedMyProblem","thumb-up"],["Autre","otherUp","thumb-up"]],[["Difficile à comprendre","hardToUnderstand","thumb-down"],["Informations ou exemple de code incorrects","incorrectInformationOrSampleCode","thumb-down"],["Il n'y a pas l'information/les exemples dont j'ai besoin","missingTheInformationSamplesINeed","thumb-down"],["Problème de traduction","translationIssue","thumb-down"],["Autre","otherDown","thumb-down"]],["Dernière mise à jour le 2025/09/04 (UTC)."],[[["\u003cp\u003eThis page covers anomaly detection in Apigee and Apigee hybrid, focusing on the Anomaly Events dashboard in the Apigee UI.\u003c/p\u003e\n"],["\u003cp\u003eTo view anomalies, users must be subscribed to AAPI Ops and have the \u003ccode\u003eroles/logging.viewer\u003c/code\u003e role, along with other required AAPI Ops roles.\u003c/p\u003e\n"],["\u003cp\u003eThe Anomaly Events dashboard displays recent API anomalies, including details such as the date, time, summary, environment, region, and severity.\u003c/p\u003e\n"],["\u003cp\u003eThe dashboard defaults to showing anomalies from the previous hour, but users can adjust the time range to view anomalies from a different period.\u003c/p\u003e\n"],["\u003cp\u003eDetected anomalies in the dashboard can be further investigated in the API Monitoring dashboards to determine appropriate actions.\u003c/p\u003e\n"]]],[],null,["# Using the Anomaly Events dashboard\n\n*This page\napplies to **Apigee** and **Apigee hybrid**.*\n\n\n*View [Apigee Edge](https://docs.apigee.com/api-platform/get-started/what-apigee-edge) documentation.*\n\n| **Important:** \"Anomaly Detection\" describes the Advanced API Operations Anomaly Detection functionality, which is available in the Classic Apigee UI. This functionality is comparable to the \"Operations Anomalies\" functionality in [Apigee UI in Cloud console](https://console.cloud.google.com/apigee). Both are available at this time. See [Operations Anomalies overview](/apigee/docs/api-platform/analytics/operations-anomalies-overview) for information on the Operations Anomalies functionality.\n\nThe Anomaly Events dashboard in the Apigee UI is your primary source of information about\ndetected API anomalies. The dashboard displays a list of recent anomalies.\n| **Notes:** To view anomalies in the dashboard, you must:\n|\n| - Be subscribed to AAPI Ops. [Contact Apigee](https://cloud.google.com/contact) to learn more.\n| - Be assigned the role `roles/logging.viewer`, in addition to the other [required roles for AAPI Ops](/apigee/docs/aapi-ops#required-roles-for-aapi-ops).\n\nBefore opening the dashboard, make sure you have been assigned the\n[required roles](/apigee/docs/aapi-ops#required-roles-for-aapi-ops)\nfor AAPI Ops.\n\nTo open the anomalies dashboard: \n\n### Apigee in Cloud Console\n\n1. In the Google Cloud console, go to the **Operations anomalies** page.\n\n [Go to Operations anomalies](https://console.cloud.google.com/apigee/analytics/operations-anomalies)\n2. [Switch to\n the organization](/apigee/docs/api-platform/get-started/switch-org) that you want to monitor.\n\nBy default, the dashboard shows anomalies that have occurred during the previous hour.\nIf no anomalies have been detected during that time period, no rows are\ndisplayed in the dashboard. In that case, you can select a larger time range from\nthe time range menu in the top right of the dashboard.\n\nEach row in the table corresponds to a detected anomaly,\nand displays the following information:\n\n- The date and time of the anomaly.\n- A brief summary of the anomaly, including the proxy in which it occurred and the fault code that triggered it.\n- The environment in which the anomaly occurred.\n- The region where the anomaly occurred.\n- The severity of the anomaly event: slight, moderate, or severe. Severity is based on a statistical measure (p-value) of how unlikely it would be for the event to occur by chance (the more unlikely the event, the greater its severity).\n\nYou can further investigate an anomaly to\ndetermine what actions, if any, you should take in response.\nThe best place to start your investigation is in the\nAPI Monitoring dashboards, where you can see various graphs of recent API traffic\ndata. The next section, [Investigating anomalies](/apigee/docs/aapi-ops/investigate-anomalies), describes how to do this.\n\n### Classic UI\n\n1. Sign in to [Apigee UI](https://apigee.google.com).\n\n **Note:** Open the Apigee UI in a new tab if you want to\n follow the steps below.\n2. [Switch to the organization](/apigee/docs/api-platform/get-started/switch-org) that you want to monitor.\n3. In the navigation pane, select **Analyze \\\u003e Anomaly Events** .\n\n\nThis displays the Anomaly Events dashboard.\n\nBy default, the dashboard shows anomalies that have occurred during the previous hour.\nIf no anomalies have been detected during that time period, no rows are\ndisplayed in the dashboard. In that case, you can select a larger time range from\nthe time range menu in the top right of the dashboard.\n\nIf there are anomalies in this time range, they are displayed similarly to the ones shown\nbelow.\n\nEach row in the table corresponds to a detected anomaly,\nand displays the following information:\n\n- The date and time of the anomaly.\n- A brief summary of the anomaly, including the proxy in which it occurred and the fault code that triggered it.\n- The environment in which the anomaly occurred.\n- The region where the anomaly occurred.\n- The severity of the anomaly event: slight, moderate, or severe. Severity is based on a statistical measure (p-value) of how unlikely it would be for the event to occur by chance (the more unlikely the event, the greater its severity).\n\nYou can further investigate an anomaly to\ndetermine what actions, if any, you should take in response.\nThe best place to start your investigation is in the\nAPI Monitoring dashboards, where you can see various graphs of recent API traffic\ndata. The next section, [Investigating anomalies](/apigee/docs/aapi-ops/investigate-anomalies), describes how to do this."]]