Questa pagina si applica ad Apigee e Apigee hybrid.
Visualizza la documentazione di
Apigee Edge.

Cosa imparerai a fare
In questo tutorial imparerai a:
- Visualizza le intestazioni e il corpo del messaggio di risposta.
- Visualizza i messaggi di errore.
Che cosa ti serve
Prima di iniziare questo tutorial, segui questi passaggi:
- Assicurati che
curlsia installato sul tuo computer per effettuare chiamate API dalla riga di comando. - Completa i passaggi descritti in Prima di iniziare.
- Aggiungi un criterio SpikeArrest al tuo proxy. Il criterio Spike Arrest è un criterio che limita il numero di richieste che possono essere inviate al proxy API. Il proxy deve avere almeno una policy.
Visualizzare i dati dei messaggi
La visualizzazione Debug nell'editor proxy Apigee ti consente di visualizzare intestazioni, variabili, oggetti e altri dettagli, come il tempo di risposta nel flusso di richiesta e risposta del proxy API. La visualizzazione Debug ti consente anche di vedere come una richiesta o una risposta cambia man mano che viene elaborata da un proxy API. Per una descrizione più dettagliata della visualizzazione di debug, vedi Utilizzo di Debug.
Questa pagina descrive come utilizzare la visualizzazione di debug per vedere cosa succede quando viene superata la frequenza del criterio SpikeArrest.
Console Apigee Cloud
Debug v2 (nuovo)
Per utilizzare la visualizzazione Debug nella UI della console Cloud per vedere cosa succede quando viene superato il limite di frequenza del criterio Spike Arrest:
-
Nella console Google Cloud , vai alla pagina Sviluppo proxy > Proxy API.
- Assicurati che il nome della tua organizzazione sia selezionato nel selettore di progetti nel riquadro della console Google Cloud . Il nome dell'organizzazione è uguale al nome del progetto Google Cloud.
- Fai clic sul nome del proxy API di cui vuoi eseguire il debug.
- Fai clic sulla scheda Sviluppa.
- Fai clic sul criterio Norme > SpikeArrest.
- Nel riquadro di modifica, modifica Tariffa impostandola su 13:00.
- Fai clic su Salva.In questo modo potrai visualizzare sia le chiamate API riuscite sia quelle non riuscite (oltre il limite).
- Esegui il deployment del proxy aggiornato.
- Fai clic sulla scheda Debug.
- Fai clic su Avvia sessione di debug.
Nella finestra di dialogo:
- Seleziona l'ambiente in cui vuoi eseguire la sessione di debug.
-
(Facoltativo) Nell'elenco Filtro, seleziona un filtro da applicare a tutte le transazioni nella sessione di debug che stai creando. Il valore predefinito è
None (All
                  transactions)
, che include tutte le transazioni nei dati di debug.Per informazioni sull'utilizzo dei filtri, vedi Utilizzo dei filtri in una sessione di debug. Per informazioni sui filtri integrati, consulta Utilizzare i filtri predefiniti.
- Fai clic su Avvia.
-
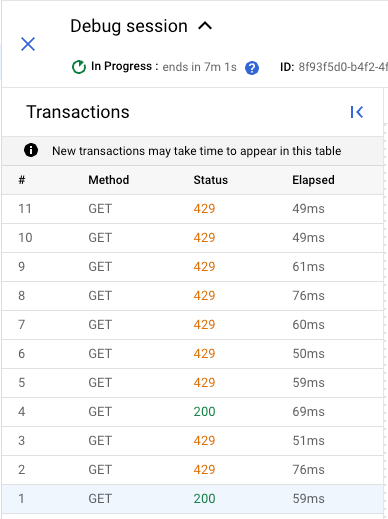
-
Fai clic su una transazione
429. Nel riquadro Mappa delle transazioni, viene visualizzato un diagramma di flusso che include una norma SpikeArrest con un'icona di errore.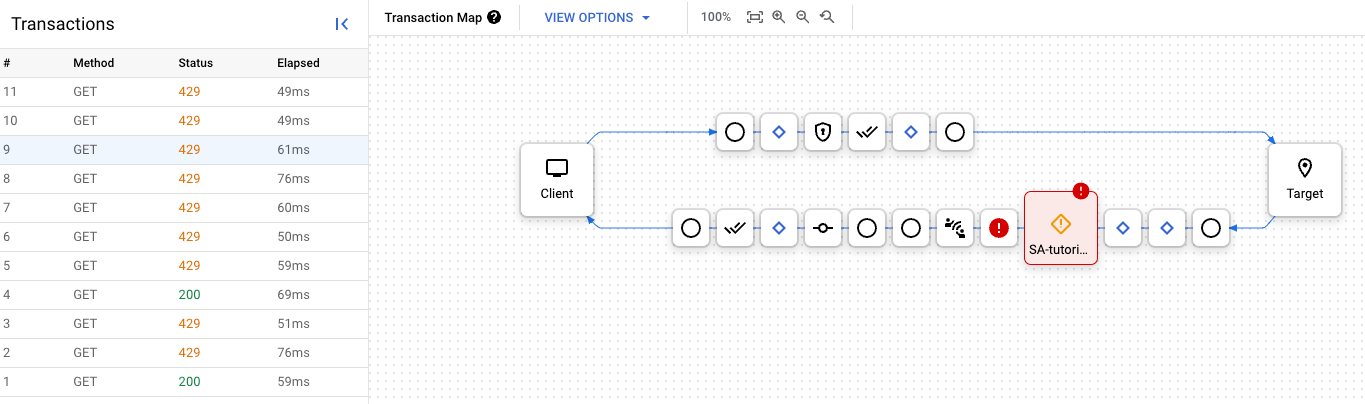
-
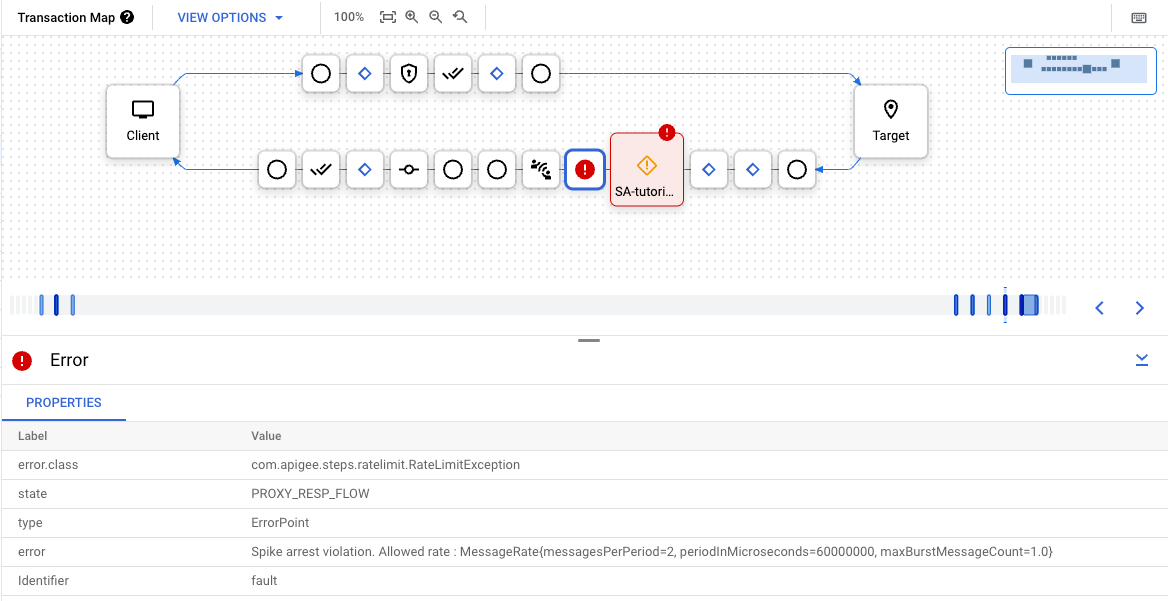
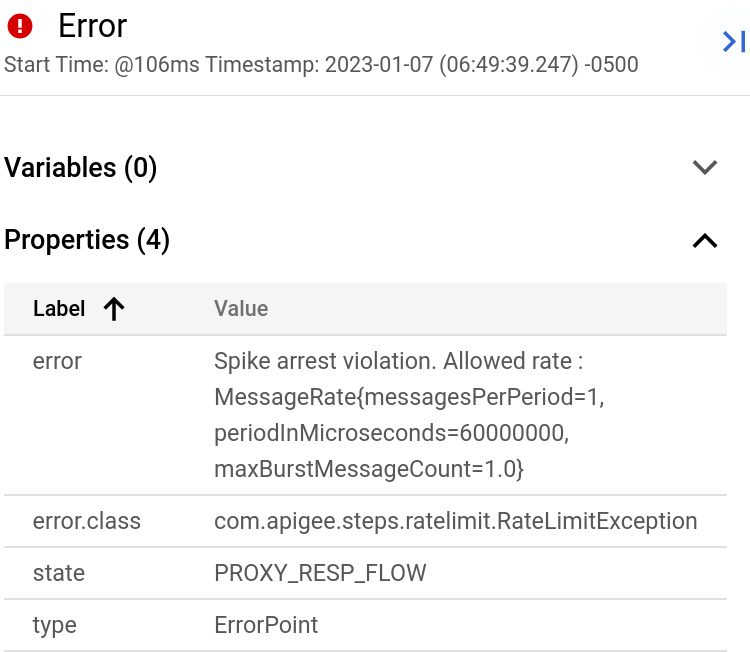
Fai clic sull'icona errore. Viene visualizzato il riquadro Proprietà errore.
Puoi fare clic sui pulsanti Precedente e Avanti per spostarti tra i passaggi del flusso e visualizzare i dettagli di ciascun passaggio.
Per scaricare l'intera sessione di debug come unico documento, fai clic su Scarica sessione. Una sessione di debug viene eliminata entro 24 ore dal momento in cui viene completata, quindi se vuoi visualizzarla dopo questo periodo di tempo, devi scaricarla prima.
Debug v1
- Nella scheda Sviluppa del proxy API, modifica l'ora
<Rate>del criterio Spike Arrest in 13:00, quindi salva il proxy. In questo modo potrai visualizzare le chiamate API riuscite e non riuscite (oltre il limite). - Nell'editor proxy, fai clic sulla scheda Debug.
- Fai clic su Avvia sessione di debug.
- Seleziona l'ambiente in cui vuoi eseguire la sessione di debug.
- (Facoltativo) Nell'elenco a discesa Filtro, seleziona un filtro da applicare a
tutte le transazioni nella sessione di debug che stai creando.
Il valore predefinito è
None (All transactions), che include tutte le transazioni nei dati di debug.Per informazioni sull'utilizzo dei filtri, vedi Utilizzare i filtri in una sessione di debug. Per informazioni sui filtri integrati, consulta Utilizzare i filtri predefiniti.
- Fai clic su Avvia.
-
Chiama di nuovo il proxy API utilizzando
curl(o con l'URL in un browser web) più volte finché non vedi almeno una risposta200e una risposta429nel riquadro a sinistra.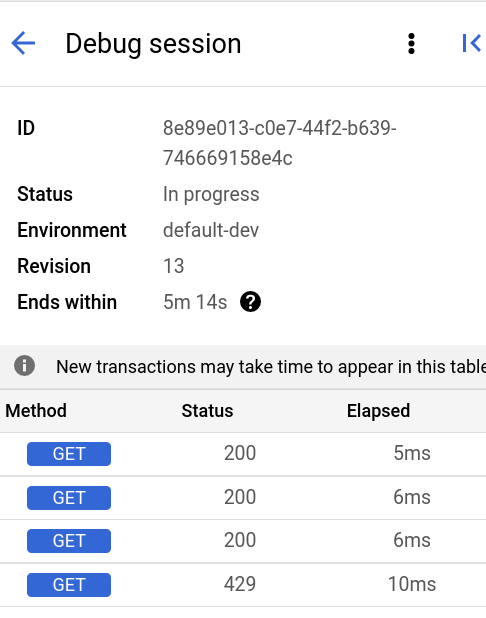
- Fai clic sulla transazione
429nel riquadro a sinistra. Viene visualizzato un diagramma di Gantt per la transazione nel riquadro a destra.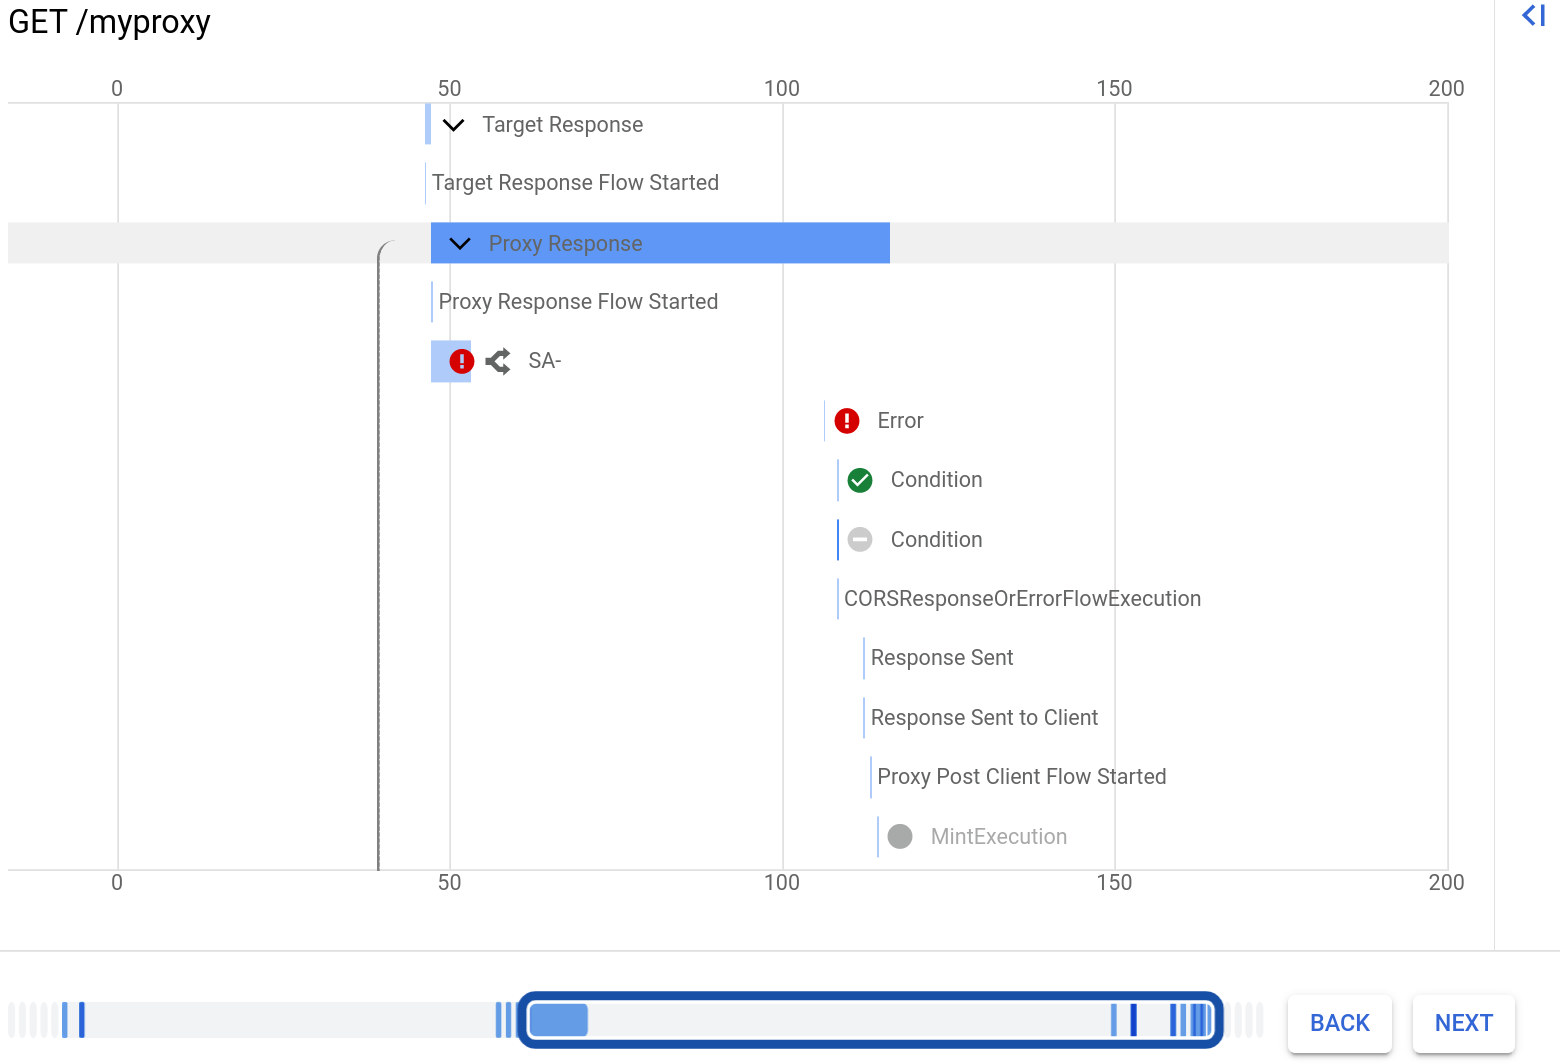
Tieni presente che è presente una riga per il criterio SpikeArrest, visualizzata con un'icona di errore.
Fai clic sulla riga con l'etichetta Errore. Mostra i dettagli dell'errore a destra del grafico. L'immagine seguente mostra la sezione Proprietà dei dettagli dell'errore:
Nella finestra di dialogo:
Puoi fare clic sui pulsanti Indietro e Avanti sotto il grafico Gantt per spostarti tra i passaggi del flusso e visualizzare i dettagli di ciascun passaggio.
Per scaricare l'intera sessione di debug come unico documento, fai clic su Scarica sessione. Una sessione di debug viene eliminata entro 24 ore dal completamento, quindi se vuoi visualizzarla dopo questo periodo di tempo, devi scaricarla prima.
UI classica
- Nella scheda Sviluppa del proxy API, modifica l'ora
<Rate>del criterio Spike Arrest impostandola di nuovo su 13:00, quindi salva il proxy. In questo modo potrai visualizzare le chiamate API riuscite e non riuscite (oltre il limite). - Nell'editor proxy, fai clic sulla scheda Debug.
- In Avvia una sessione di debug, seleziona l'ambiente in cui è stato eseguito il deployment del proxy.
- Fai clic su Avvia sessione di debug.
-
Chiama di nuovo il proxy API utilizzando
curl(o con l'URL in un browser web) finché non vedi almeno una risposta200e una risposta429nel riquadro Debug delle transazioni.curl -v https://YOUR_ENV_GROUP_HOSTNAME/my-proxy
dove
YOUR ENV_GROUP_HOSTNAMEè il nome host del gruppo di ambienti. Consulta Trova il nome host del gruppo di ambienti.Di seguito sono riportate una risposta
200e una risposta429.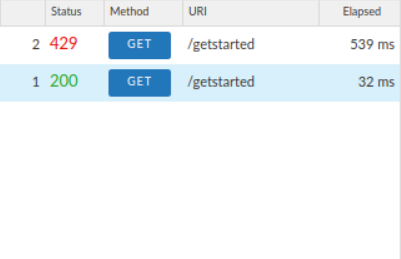
- Fai clic sulla transazione
200nel riquadro Transazioni a sinistra. I dettagli di debug vengono caricati nella finestra principale in Mappa delle transazioni, che mostra un diagramma di richiesta/risposta. L'icona Spike Arrest si trova nel flusso della richiesta. - Nel diagramma di flusso, fai clic sull'icona a forma di cerchio nella risposta, quella più a destra (mostrata nel diagramma seguente).
Il riquadro Dettagli fase mostra i dati disponibili in quel punto del flusso. Se scorri il riquadro, vedrai le intestazioni e il corpo della risposta HTTP.
- Ora esamina un errore in Debug.
Fai clic sulla transazione
429nel riquadro Transazioni. Nella finestra principale dell'editor, viene visualizzato un diagramma di flusso con gli elementi solo nella richiesta, inclusa un'icona di Spike Arrest con un punto esclamativo rosso che indica un errore.Fai clic sulla piccola icona di errore a forma di tubo a destra dell'icona di Spike Arrest e guarda i dettagli della violazione di Spike Arrest nel riquadro Dettagli fase.
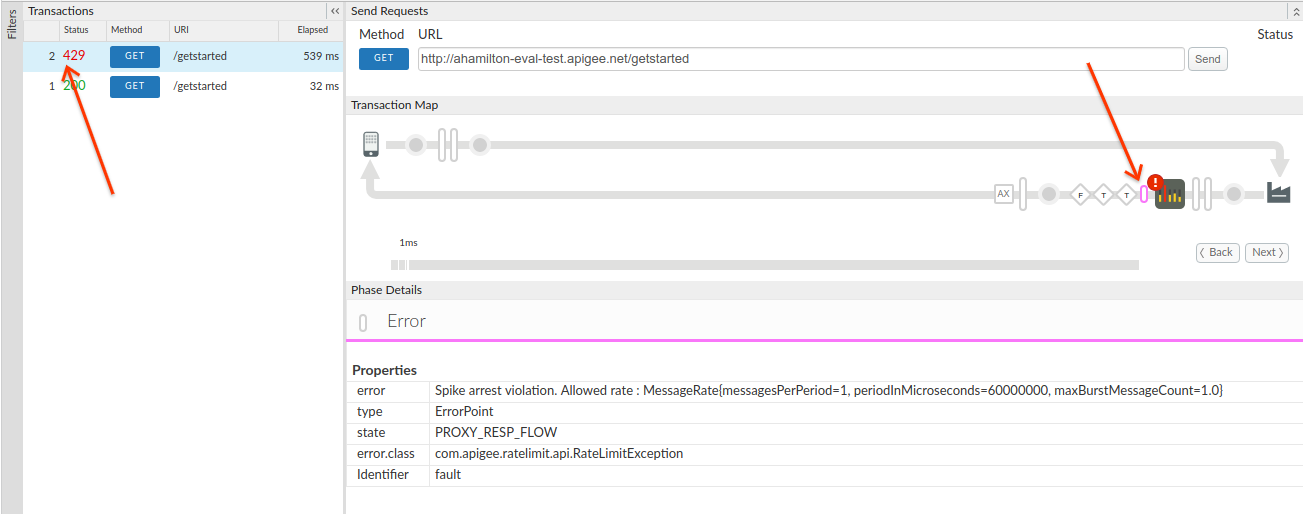
Puoi fare clic sui pulsanti Indietro e Avanti nel diagramma di flusso per spostarti tra i punti del flusso e visualizzare i dettagli di debug.
Se vuoi visualizzare l'intera sessione di debug come un unico documento, scaricala facendo clic su Scarica sessione di debug.
Per ulteriori informazioni, consulta la sezione Utilizzare Debug.