本页面适用于 Apigee 和 Apigee Hybrid。
查看 Apigee Edge 文档。

“操作异常”功能概览
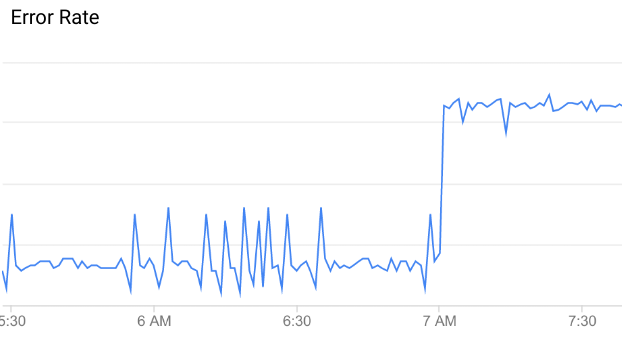
“操作异常”功能会根据近期的数据模式,识别 API 上异常或意外的 API 数据模式。例如,在此 API 错误率图表中,错误率在上午 7 点左右突然升高。与该时间之前的数据相比,这种增长是不寻常的,足以被归类为异常。
并非 API 数据的所有变化都表示存在异常,大多数变化属于随机波动。例如,您可以看到导致异常的错误率只是存在一些细微的变化,但实际这些变化并不够显著,无法归类为异常。
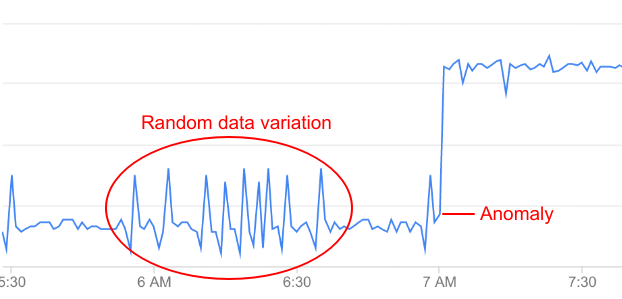
“操作异常”功能会持续监控 API 数据并执行统计分析,以区分真正的异常和数据的随机波动。
“操作异常”功能会自动检测以下异常类型:
- 组织、环境和区域级别的 HTTP 503 错误增加
- 组织、环境和区域级别的 HTTP 504 错误增加
- 组织、环境和区域层级的所有 HTTP 4xx 或 5xx 错误增加
- 组织、环境和区域级的第 90 百分位 (p90) 的总响应延迟时间增加
检测到的异常包括以下信息:
- 导致异常值的指标,例如代理延迟时间或 HTTP 错误代码。
- 异常值的严重程度。根据模型中的置信度,严重程度可以是轻微、中等或严重。较低的置信度表示严重程度轻微,而较高的置信度则表示严重。
使用“操作异常”功能的前提条件
如需使用“操作异常”功能,需满足以下条件:
- 必须为您的组织启用 AAPI Ops 插件。请参阅在组织中启用 AAPI Ops
- 用户必须具有所需的 AAPI Ops 角色才能使用“操作异常”功能。
- 在信息中心调查异常的用户还需要
roles/logging.viewer角色。
查看检测到的操作异常
当“操作异常”功能检测到异常时,它会在“操作异常”信息中心内显示异常详情。您可以在 API Monitoring 信息中心内调查异常,并在必要时采取适当的措施。您还可以创建提醒,以便在今后发生类似事件时收到通知。
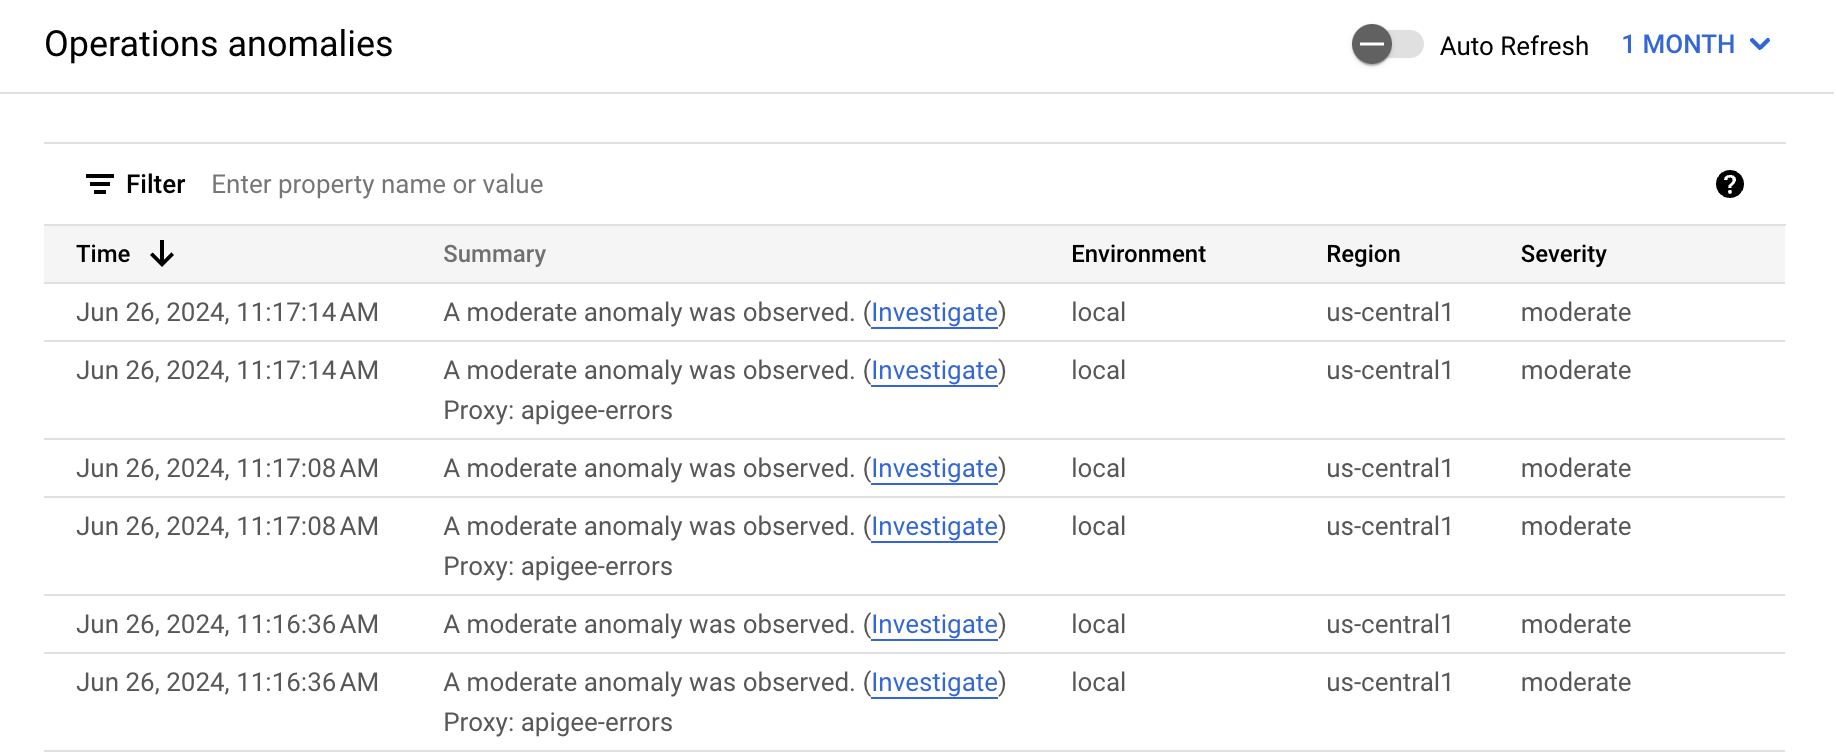
Apigee 界面中的“操作异常”信息中心是检测到的操作异常的主要信息来源。信息中心会显示最近的异常值列表。
如要打开“操作异常”信息中心,请执行以下操作:
在 Google Cloud 控制台中,依次前往分析 > 操作异常页面。
- 切换到您要监控的组织。
“操作异常”信息中心随即会显示。
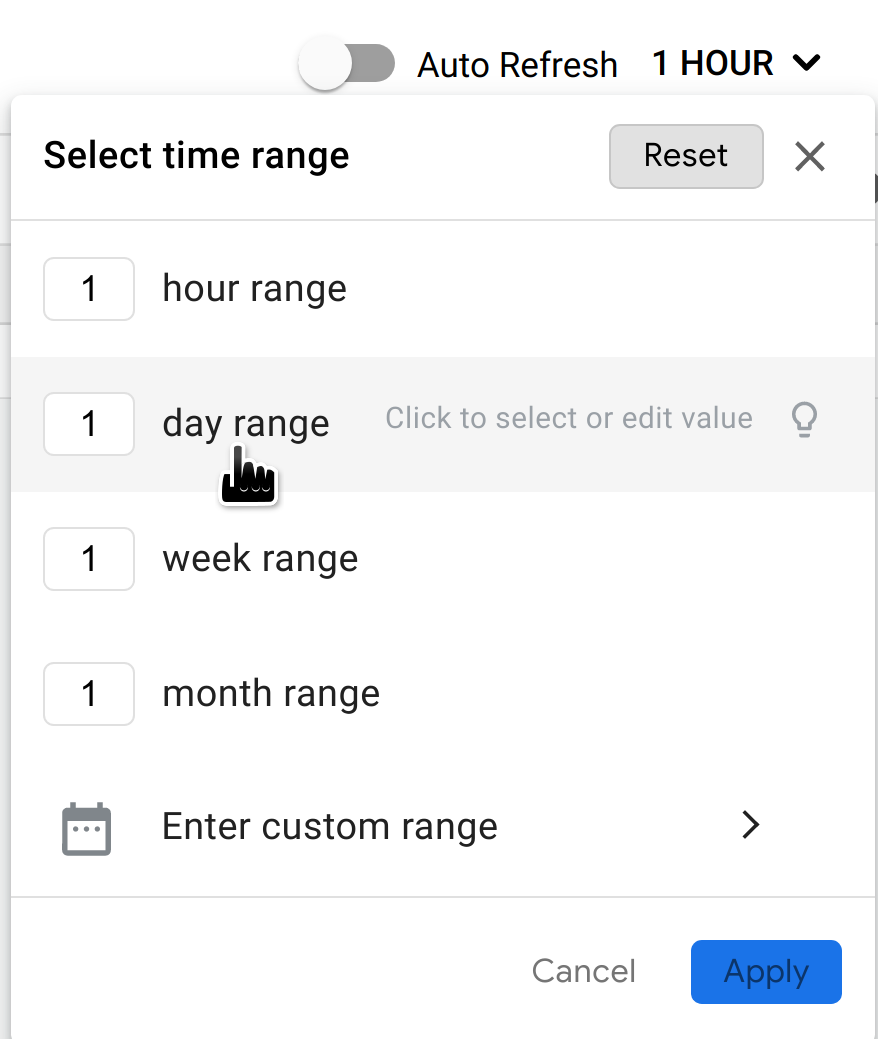
默认情况下,信息中心会显示过去一小时内出现的异常值。 如果在这段时间内未检测到任何异常,则信息中心将不显示任何行。您可以从信息中心右上角的时间范围菜单中选择一个更大的时间范围。
表中的每一行对应一个检测到的异常,并显示以下信息:
- 异常值的日期和时间。
- 异常的简要摘要,包括发生异常的代理和触发异常的故障代码。
- 出现异常值的环境。
- 出现异常值的区域。
- 异常值的严重程度:轻微、中等或严重。严重程度的界定基于事件发生可能性的统计测量结果(p 值)。事件发生的可能性越大,严重程度越高。
您还可以在 API Monitoring 信息中心内调查异常,该信息中心会显示近期 API 流量数据的各种图表。
异常值检测的工作原理
异常检测涉及以下阶段:
训练模型
“操作异常”功能通过根据历史时序数据训练一个 API 代理行为模型来实现其功能。您无需执行任何操作即可训练模型。Apigee 会根据过去六个小时的 API 数据自动为您创建并训练模型。因此,Apigee 要求至少有 6 个小时的 API 代理数据来训练模型,然后才能记录异常值。
训练的目标是提高模型的准确性,然后使用历史数据对模型进行测试。测试模型准确率的最简单方法是计算其错误率,即假正例和假负例的总和除以预测事件总数。
记录异常值事件
在运行时,“操作异常”功能会将 API 代理的当前行为与模型预测的行为进行对比。然后,在特定的置信度下,“操作异常”功能可以确定操作指标超出预测值的情况。例如,当 5xx 错误率超过模型预测的概率。
如果 Apigee 检测到异常,它会自动在“操作异常”信息中心内记录该事件。信息中心中显示的事件列表包括所有检测到的异常值以及触发的提醒。