In addition to viewing Apigee Analytics and monetization data in the Apigee UI, you can also view them using Looker Studio Integration, which connects Apigee data to Google's Looker Studio. Looker Studio is a powerful and flexible tool that you can use to display Apigee data in fully customizable dashboards and reports.
The following sections explain how to create an Analytics data report in Looker Studio.
Required role
To use Looker Studio, you first need to connect it to a data source—in this case,
Apigee. To make the connection, you need to have the role
roles/apigee.analyticsEditor.
See Apigee roles for more information.
Connect to the Apigee data source
To connect to the Apigee data source, do the following steps:
- Open Looker Studio. The main Looker Studio page is shown below:
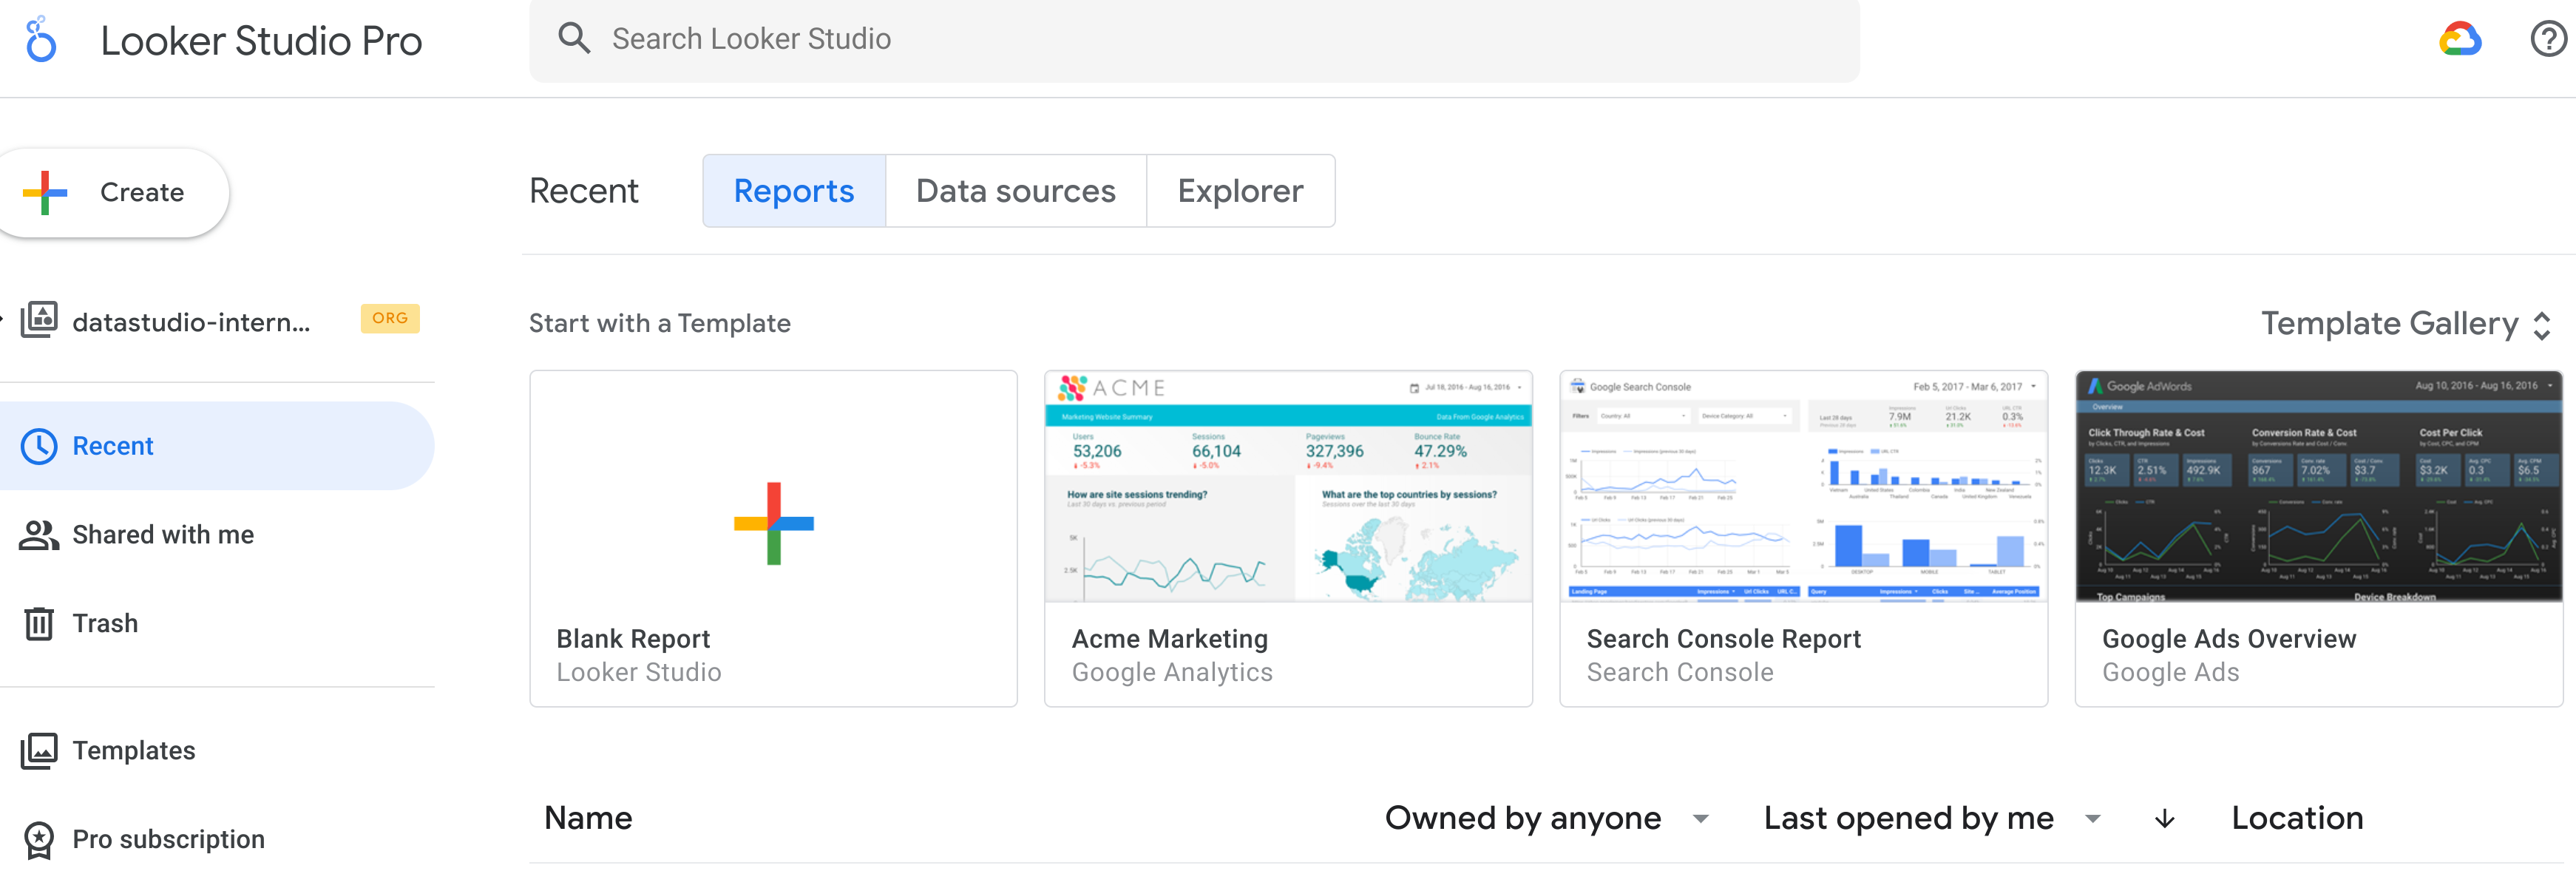
- Click the + Create button at the top of the page.
- Select Data source to display an untitled Data Source page.
- Scroll down and click the Apigee button:
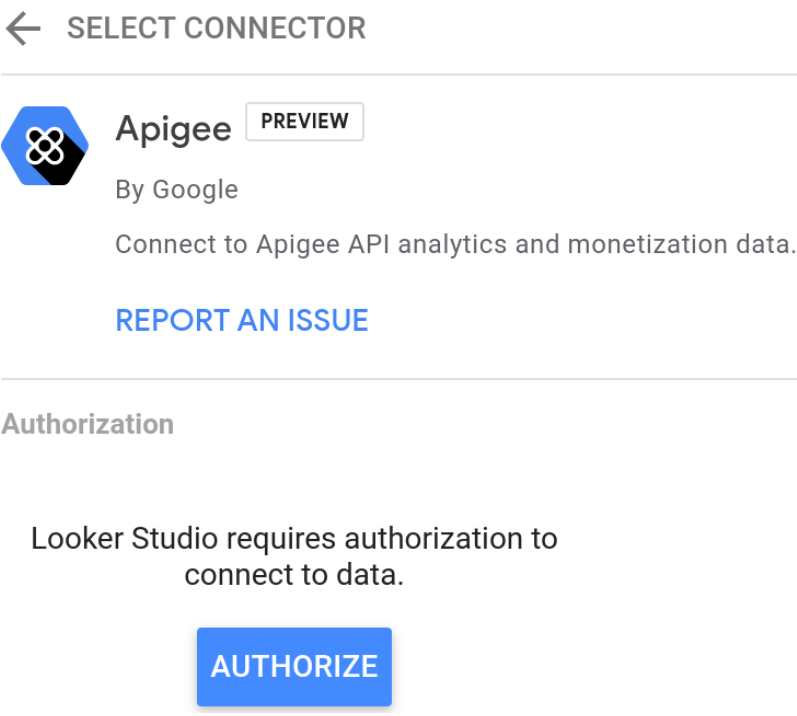
- Click the Authorize button to allow Looker Studio to connect to the Apigee data.
- In the Apigee Organization Name field, enter the organization ID. Note: The organization ID is the same as the Google Cloud project ID for the organization.
Click Connect at the top-right of the window.
Note: You must have the role
roles/apigee.analyticsEditorto perform this step.When the connection to Apigee is made, Looker Studio displays the page shown below, where you can create a report:

The next section explains how to view an Analytics data report in Looker Studio using the Apigee API Platform template.
Use the Apigee API Platform template
The following sections describe how to view a predefined report using the Apigee API Platform template.
- Open the Apigee API Platform template from Looker Studio
- Open the Apigee API Platform template from the Apigee UI
Open the Apigee API Platform template from Looker Studio
To open the Apigee API Platform template from Looker Studio:
- In the Looker Studio page, select Templates in the navigation pane.
- In the Category menu in Template Gallery, select Apigee.
- Under Apigee, select Apigee API Analytics. This displays the Apigee API
Platform template:
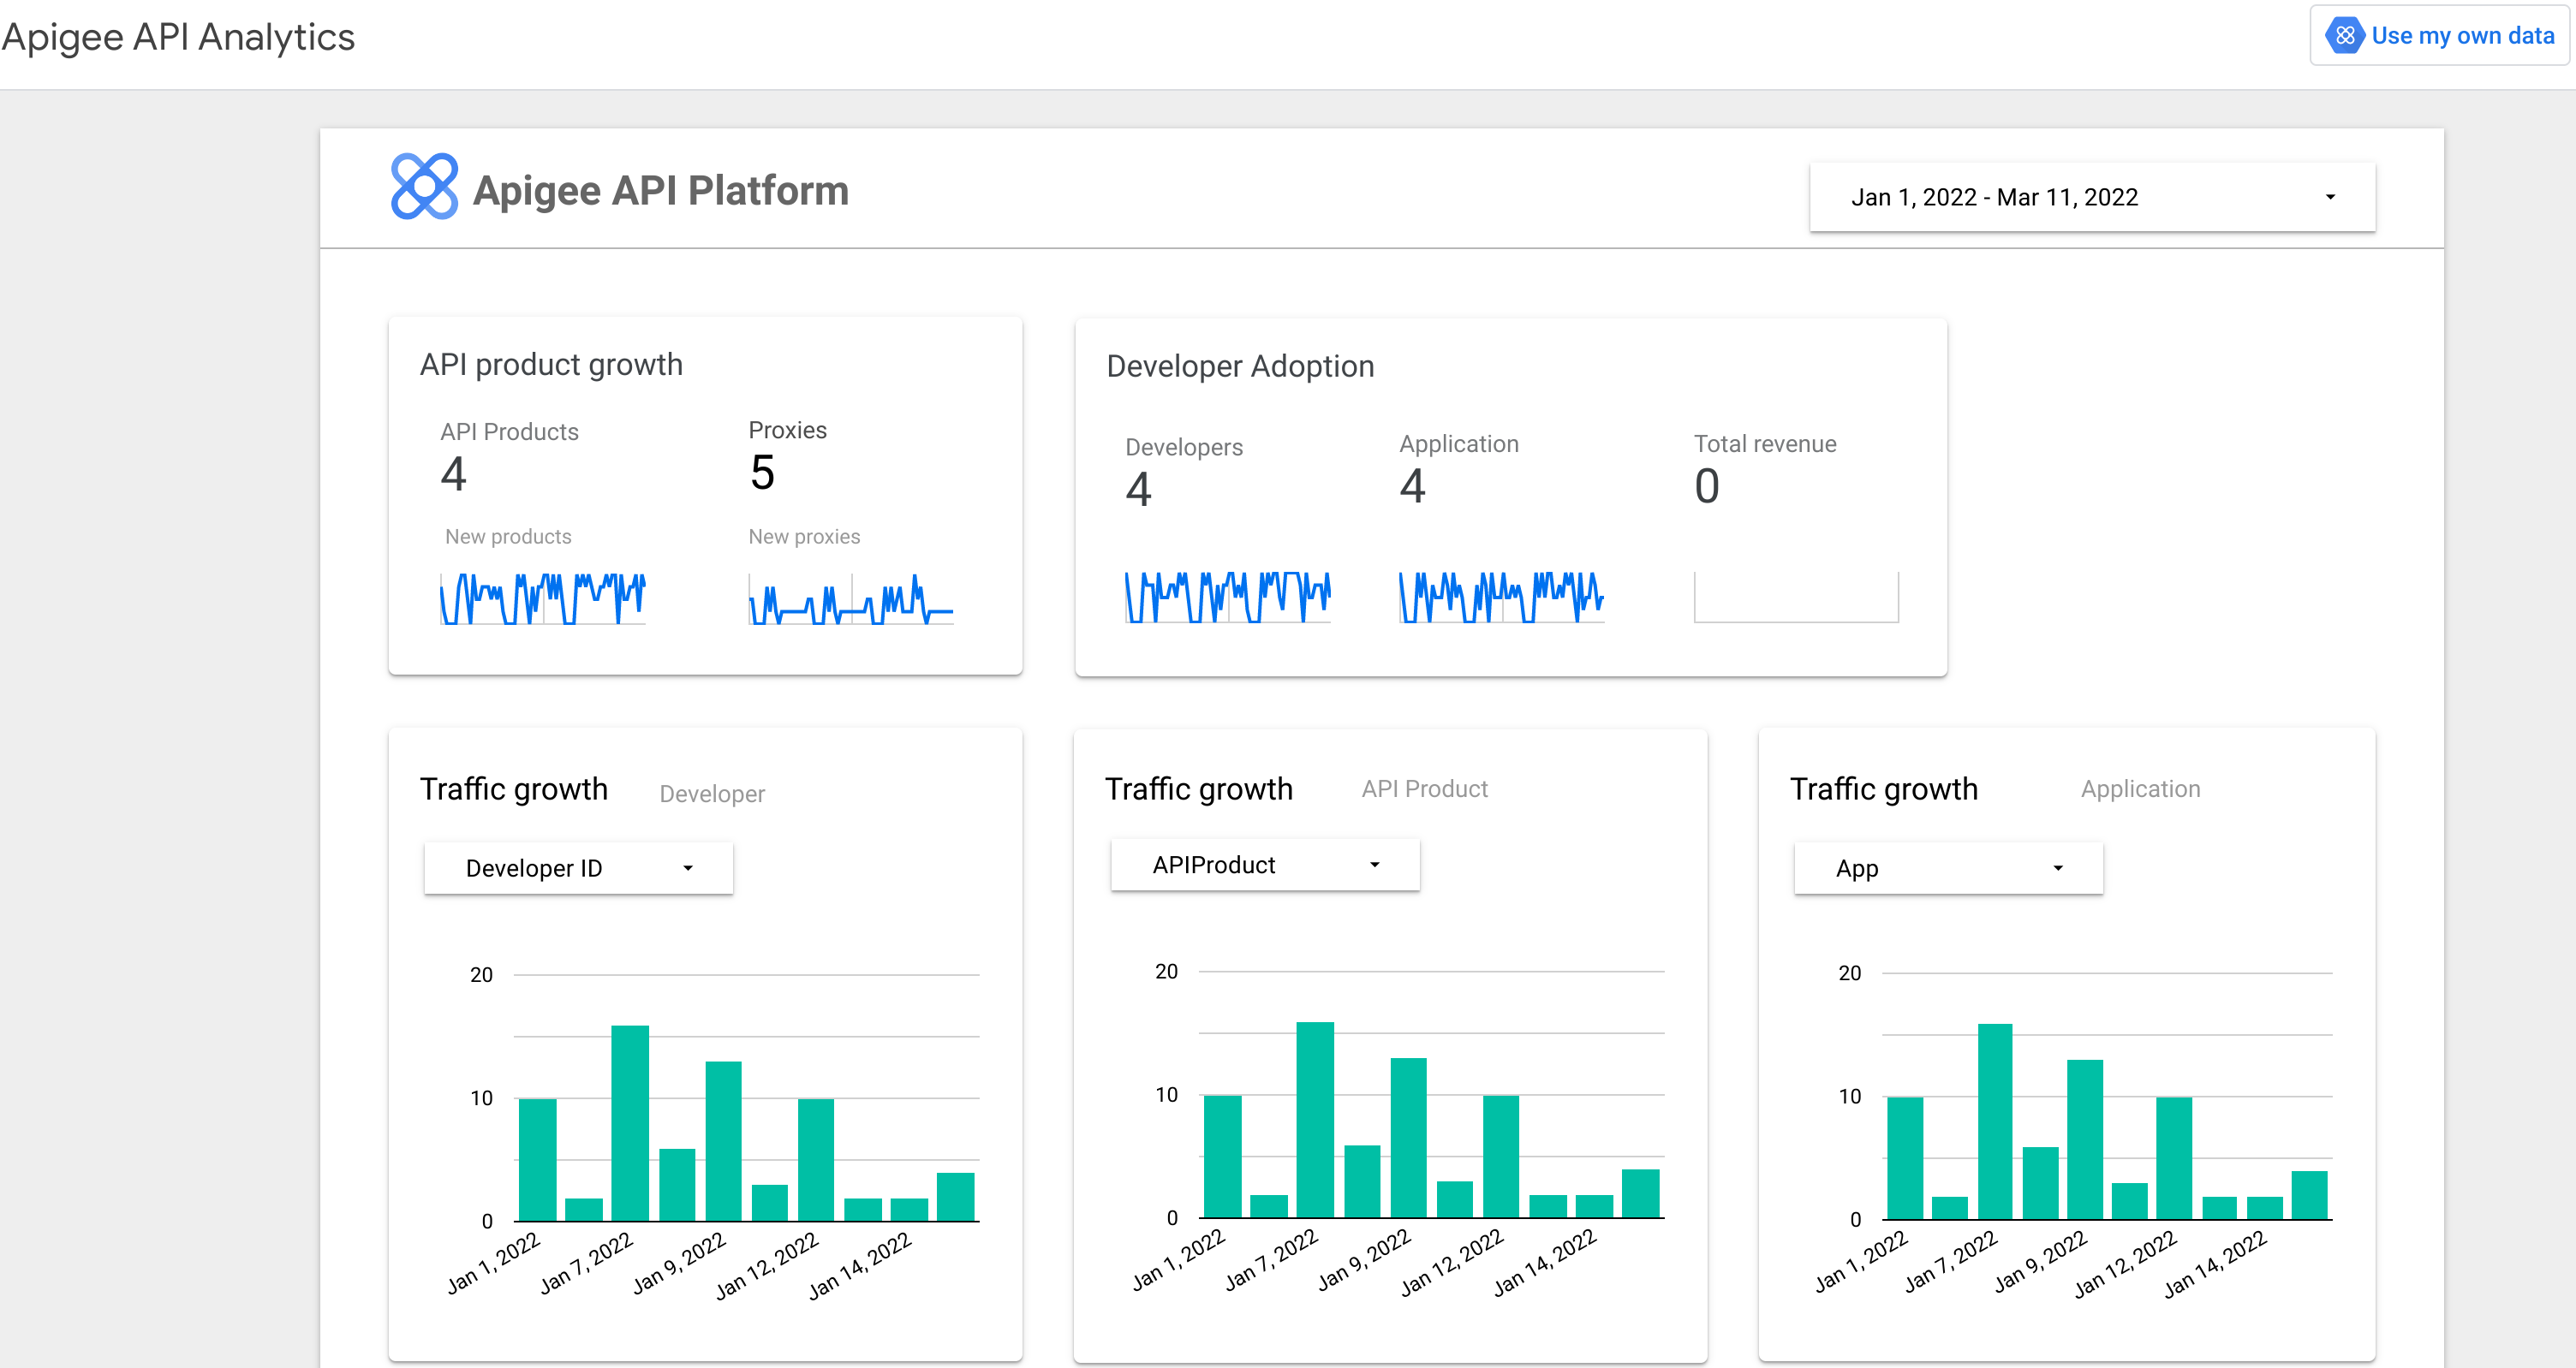
- Click Use my own data at the top-right of the page to open the the Add data to report dialog.
- In the Apigee Organization Name field, enter the organization ID. Note: The organization ID is the same as the Google Cloud project ID for the organization.
- Click Add at the lower right.
Open the Apigee API Platform template from the Apigee UI in Cloud console
To open the Apigee API Platform template from the Apigee UI in Cloud console:
In the Google Cloud console, go to the Analytics > Custom Reports page.
- Click Create More Reports Using Looker Studio at the top-right. This displays the
Apigee API Platform template:

- Click Use my own data at the top-right of the page to open the the Add data to report dialog.
- In the Apigee Organization Name field, enter the organization ID. Note: The organization ID is the same as the Google Cloud project ID for the organization.
- Click Add at the lower right.
You can view a number of different charts in the report, including:
- API product growth
- Traffic growth
- Latency performance
- Error code improvements
See the Looker Studio Quick start guide to learn more.
Create an Analytics data report
You can also create an Analytics data report directly in Looker Studio, without using the Apigee API Platform template:
- In the Looker Studio page, click + Create.
- Select Report.
- Under Add data to report, select My data sources.
- Select Apigee - Analytics.
- Click Add at the lower right.
- In the confirmation dialog, click Add to Report.
This displays the Report page with Apigee Analytics data
available to add to the report, as shown below:
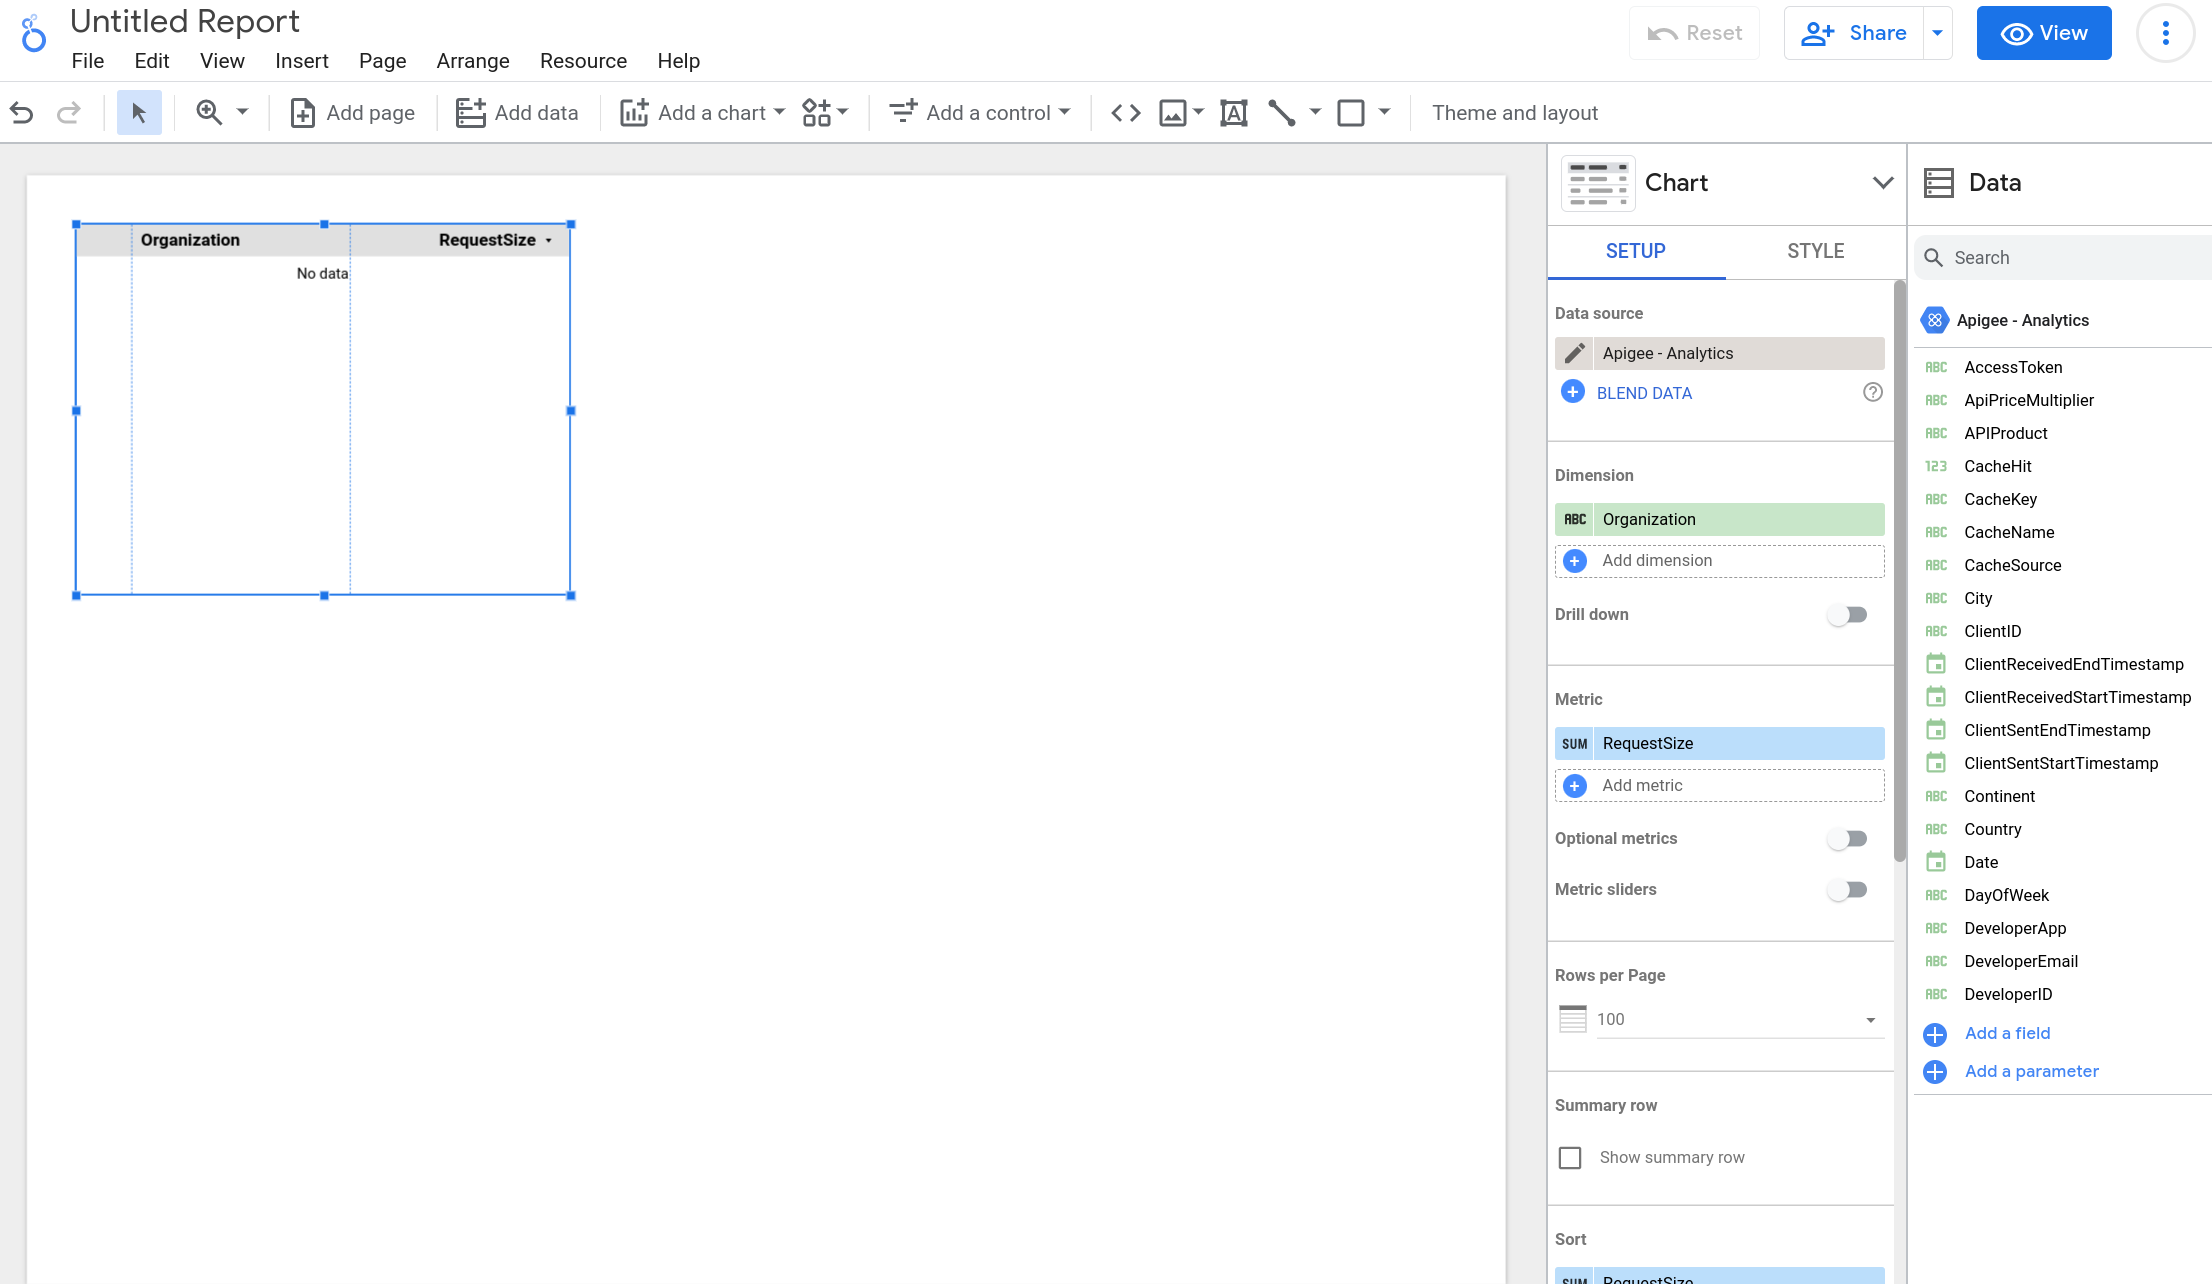
You can now create an Analytics report. Here's an example that creates a graph of API traffic over time:
- Select the Insert menu at the top of the Report page.
- Select Time series chart.
- In the Metric pane on the right side of the Report page, select + Add metric.
- Scroll down through the Available Fields and select Traffic.
This displays a time series chart of recent traffic. An example is shown below. (Your data will vary.)
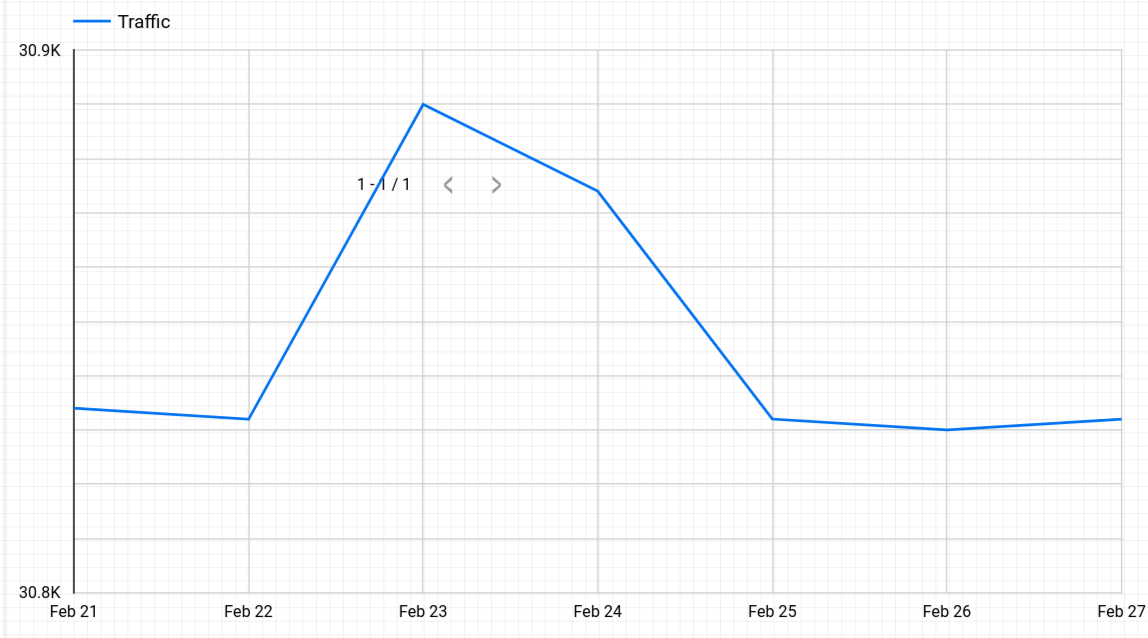
If you want to view a different time range for the data, return to the Insert menu and select Date range control. You can then use the control to select a time range for the data to display.
The Looker Studio documentation describes how to create many kinds of reports. For more information, see the following:
