El panel de rendimiento de la caché te permite ver de un vistazo el valor de la caché de respuestas.
El panel te ayuda a visualizar el beneficio de la caché de respuestas en términos de una latencia más baja y servidores de backend de carga reducidas.
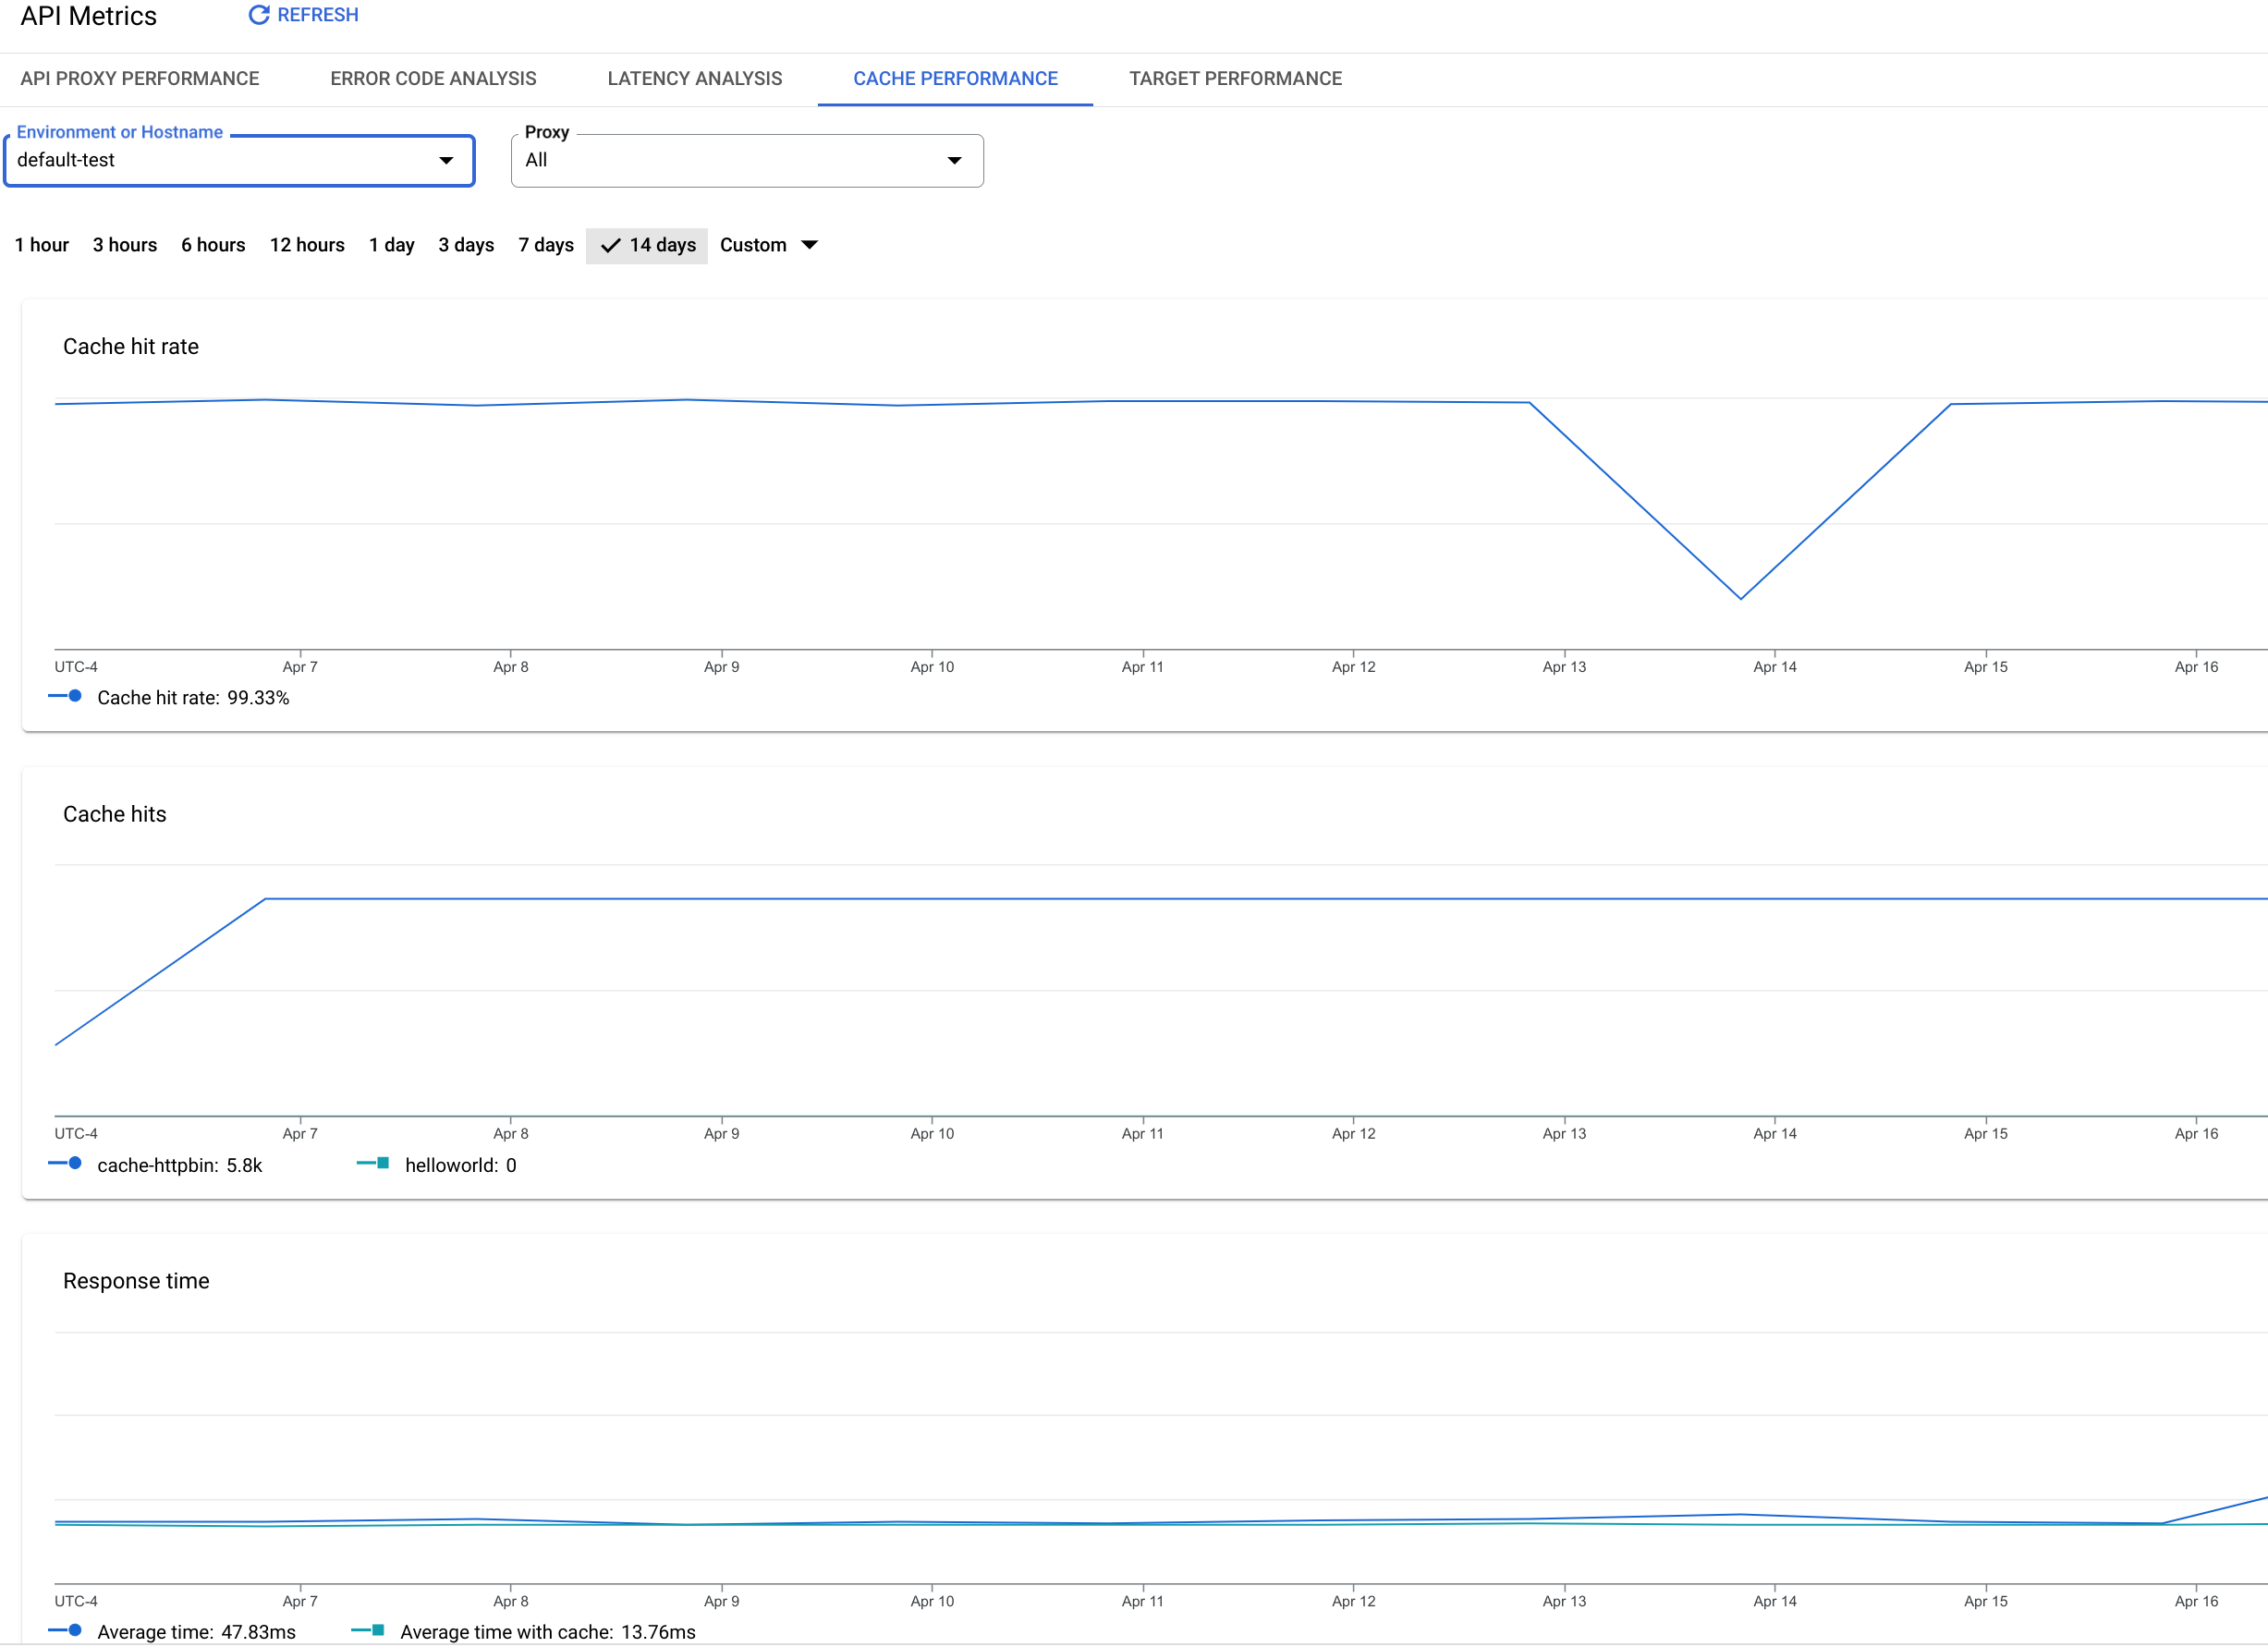
El panel del rendimiento de la caché
Sigue estos pasos para acceder al panel de rendimiento de la caché:
En la Google Cloud consola, ve a la página Estadísticas > Métricas de API > Rendimiento de la caché.
[[["Fácil de comprender","easyToUnderstand","thumb-up"],["Resolvió mi problema","solvedMyProblem","thumb-up"],["Otro","otherUp","thumb-up"]],[["Difícil de entender","hardToUnderstand","thumb-down"],["Información o código de muestra incorrectos","incorrectInformationOrSampleCode","thumb-down"],["Faltan la información o los ejemplos que necesito","missingTheInformationSamplesINeed","thumb-down"],["Problema de traducción","translationIssue","thumb-down"],["Otro","otherDown","thumb-down"]],["Última actualización: 2025-10-19 (UTC)"],[],[]]