프록시 성능 대시보드를 사용하면 API 프록시 트래픽 패턴과 처리 시간을 확인할 수 있습니다.
Apigee에서 API를 수신한 시간부터 API가 클라이언트 앱에 반환될 때까지 API가 생성한 트래픽 양과 API 호출을 처리하는 데 소요되는 시간을 간편하게 시각화할 수 있습니다.
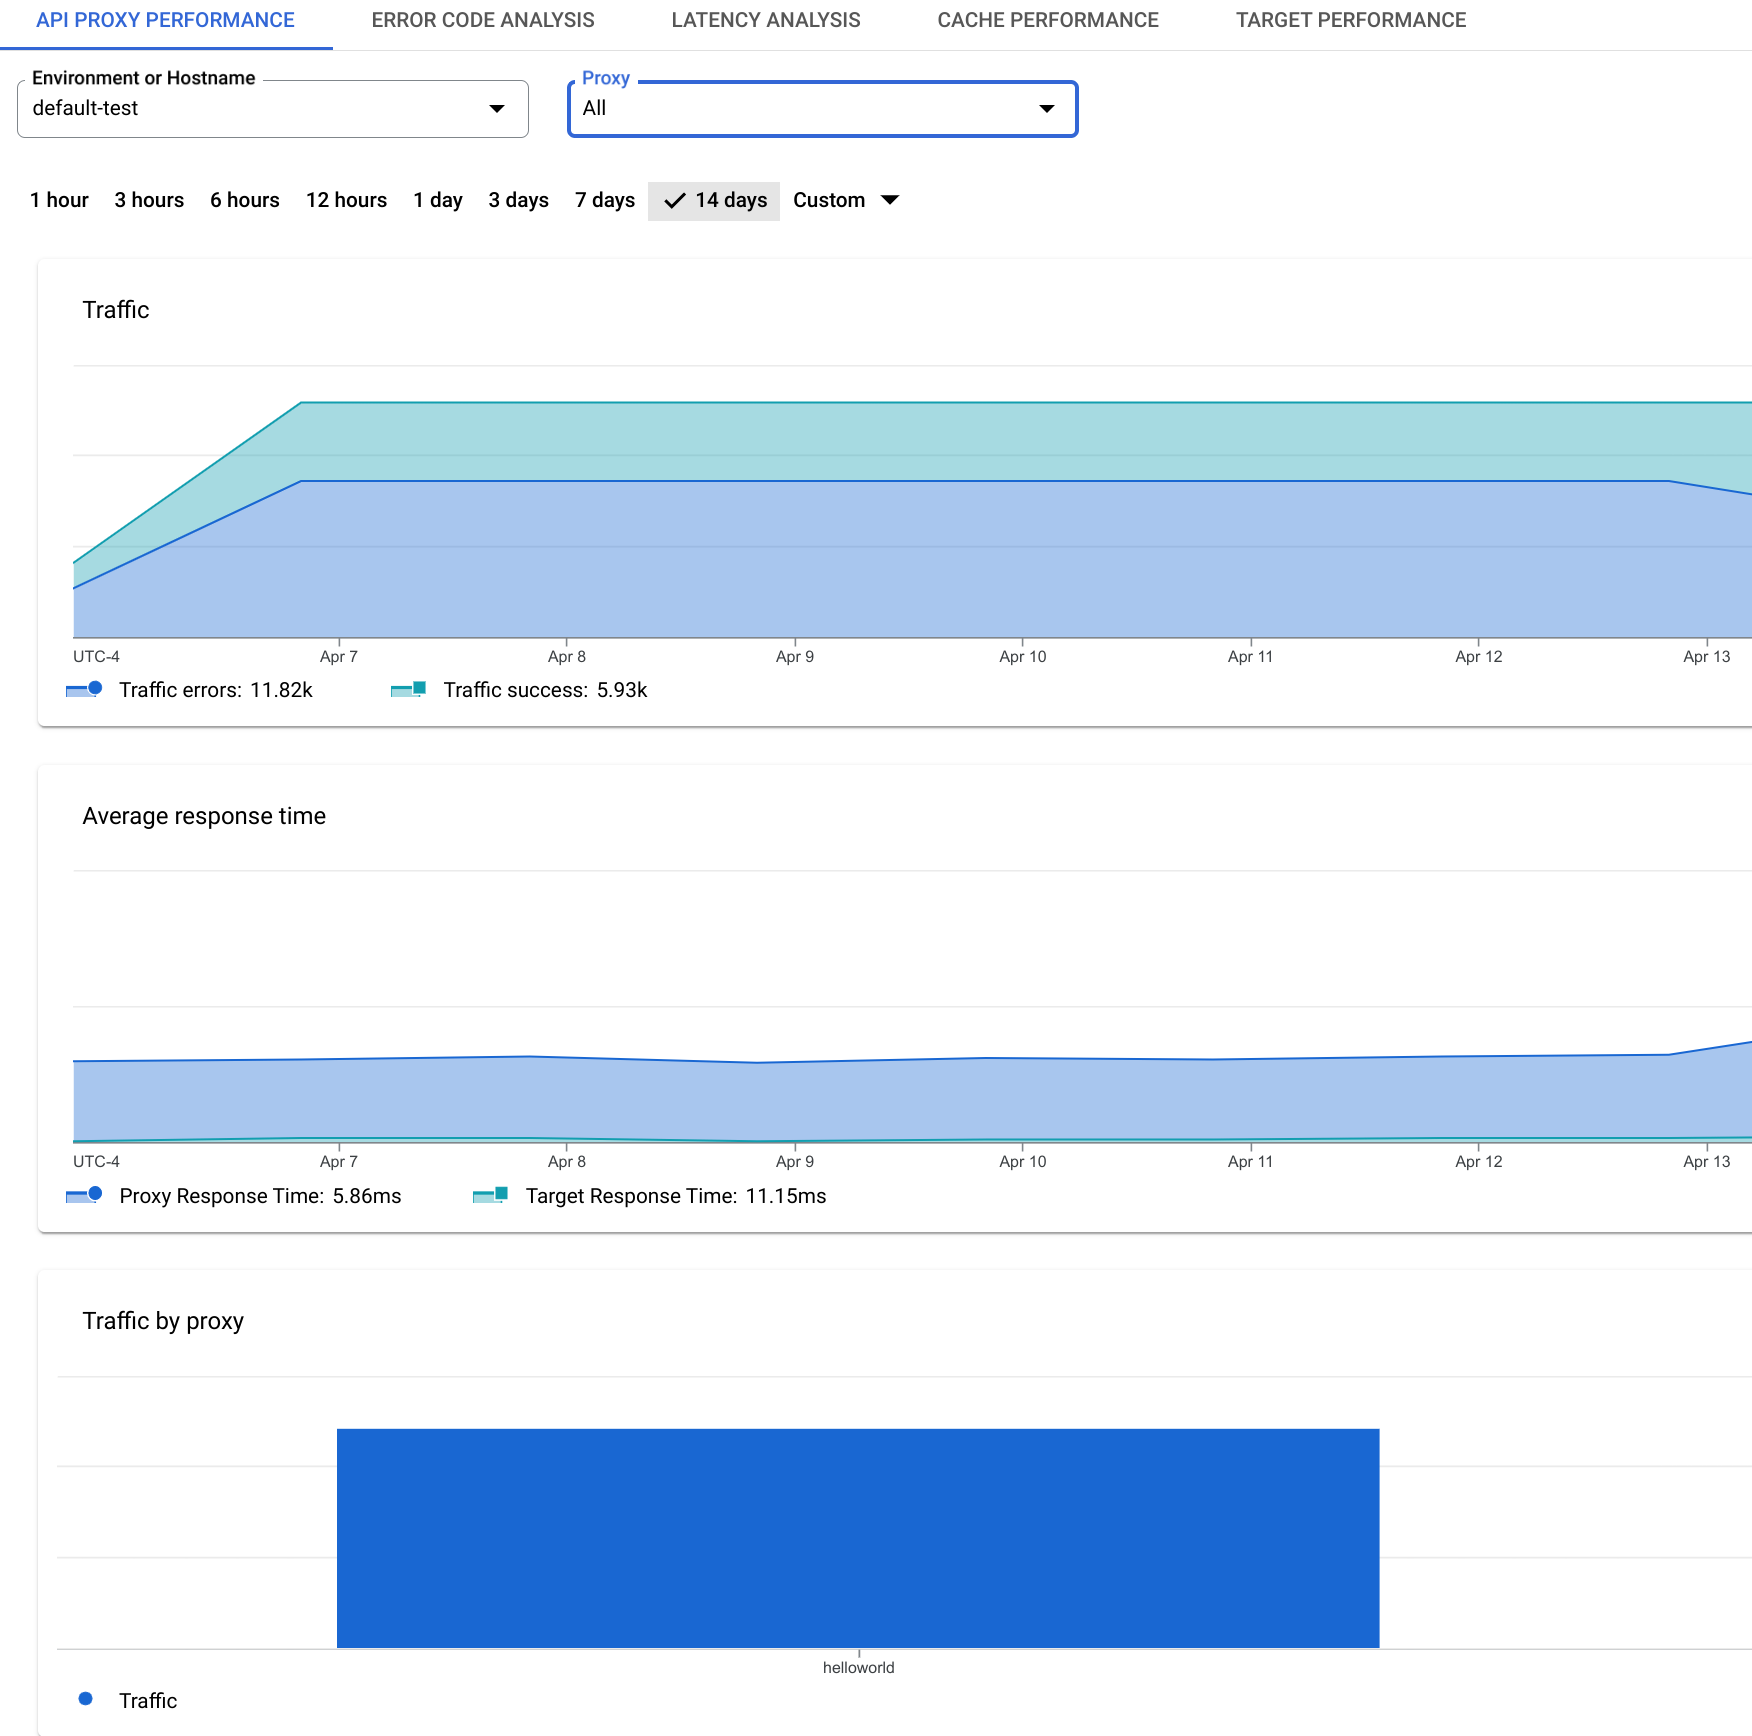
API 프록시 성능 대시보드
프록시 성능 대시보드에 액세스하려면 다음 안내를 따르세요.
Google Cloud 콘솔에서 분석 > API 측정항목 > API 프록시 성능 페이지로 이동합니다.
Apigee 조직 환경에 발신한 모든 API 호출에 대해 측정한 총 응답 시간의 평균입니다. 총 응답 시간은 Apigee에 발신한 API 호출이 반환되는 데 걸리는 시간(밀리초 단위)입니다.
즉, 총 응답 시간은 Apigee에서 전체 API 호출이 수신된 시점부터 Apigee가 클라이언트 앱에 응답을 반환하기 시작할 때까지 측정한 시간입니다.
이 차트에서는 모든 프록시의 평균을 측정합니다. 개별 프록시의 경우 다음 프록시별 평균 응답 시간 차트를 참조하세요.
평균 프록시 응답 시간
이 값은 Apigee 조직 환경에 대한 모든 API 호출의 총 응답 시간에서 대상 응답 시간을 빼서 평균을 계산한 것입니다.
기본적으로 API 호출이 Apigee 자체를 통과하는 데 걸리는 시간(밀리초 단위)입니다.
평균 대상 응답 시간
요청의 마지막 바이트가 Apigee에서 백엔드 대상으로 전송된 시점부터 Apigee가 응답의 마지막 바이트를 수신한 시점까지 걸리는 평균 시간(밀리초 단위)입니다.
기본적으로 API 호출이 대상 시스템에서 보내는 시간을 측정합니다.
평균 프록시 응답 시간은 총 응답 시간의 평균과 대응 목표 시간의 차이로 계산됩니다. 예상치는 총 응답 시간이 항상 대응 목표 시간보다 큽니다. 그러나 백엔드 시스템에 도달하지 않는 프리플라이트 요청, 캐시된 응답, Oauth 토큰 등 프록시 자체에서 처리하는 호출도 있습니다. 이렇듯 프록시에 의한 '더 빠른' 호출은 대응 목표 시간을 줄이지 않고 평균 총 응답 시간을 줄입니다. 따라서 평균 총 응답 시간이 항상 평균 대응 목표 시간보다 크지 않을 수 있으며 이로 인해 프록시 응답 시간에 음의 값이 표시될 수 있습니다. 시간 척도를 너무 많이 확대하지 않은 상태에서 더 큰 TPS를 보는 경우 이러한 예외에서 너무 큰 가중치를 견디지 못하므로 보다 정확하고 실행 가능한 데이터를 제공합니다.
짧은 시간 동안 수집된 몇 개의 요청이 아니라 많은 수의 요청이 장시간에 걸쳐 수집될 때 가장 의미 있는 평균 응답 데이터를 얻을 수 있습니다. 짧은 시간 동안 들어오는 적은 수의 요청만 관찰할 경우 대상으로 이동하지 않는 한 번의 호출로도 평균 프록시 응답 시간이 음수가 될 가능성이 있습니다. 평균 응답 시간을 평가할 때는 트래픽이 많은 시간 프레임을 더 길게 보는 것이 좋습니다.
프록시별 트래픽
측정항목
설명
<프록시 이름>
지정된 API 프록시의 경우 기록한 API 요청 및 응답 수입니다.
프록시별 평균 응답 시간
측정항목
설명
<프록시 이름>
지정된 API 프록시의 경우 Apigee 환경에 발신한 모든 API 호출에 대해 측정한 총 응답 시간의 평균입니다. 총 응답 시간은 Apigee에 발신한 API 호출이 반환되는 데 걸리는 시간(밀리초 단위)입니다.
그래프 위로 마우스를 가져가면 프록시 측과 대상 측에 소요된 총 시간과 평균을 확인할 수 있습니다.
[[["이해하기 쉬움","easyToUnderstand","thumb-up"],["문제가 해결됨","solvedMyProblem","thumb-up"],["기타","otherUp","thumb-up"]],[["이해하기 어려움","hardToUnderstand","thumb-down"],["잘못된 정보 또는 샘플 코드","incorrectInformationOrSampleCode","thumb-down"],["필요한 정보/샘플이 없음","missingTheInformationSamplesINeed","thumb-down"],["번역 문제","translationIssue","thumb-down"],["기타","otherDown","thumb-down"]],["최종 업데이트: 2025-08-19(UTC)"],[[["\u003cp\u003eThe Proxy Performance dashboard in Apigee and Apigee hybrid allows users to visualize API traffic patterns and the time it takes for API calls to be processed, from receipt to response.\u003c/p\u003e\n"],["\u003cp\u003eThe dashboard includes charts for Average Transactions Per Second (TPS), Total Traffic, Traffic Success/Errors, Average Response Time, Traffic by Proxy, and Average Response Time by Proxy.\u003c/p\u003e\n"],["\u003cp\u003eThe dashboard's metrics, such as Average Response Time, consider the total time it takes for an API call to return, including the time spent within Apigee and at the target system.\u003c/p\u003e\n"],["\u003cp\u003eData displayed on the dashboard may have a delay of up to 10 minutes after API calls are made.\u003c/p\u003e\n"],["\u003cp\u003eThe most relevant average response times are gathered by observing a higher number of requests over a larger period of time.\u003c/p\u003e\n"]]],[],null,["# API Proxy Performance\n\n*This page\napplies to **Apigee** and **Apigee hybrid**.*\n\n\n*View [Apigee Edge](https://docs.apigee.com/api-platform/get-started/what-apigee-edge) documentation.*\n\nWhat does this dashboard tell me?\n---------------------------------\n\nThe Proxy Performance dashboard helps you see API proxy traffic patterns and processing times.\nUse is to visualize how much traffic your APIs generate and how long it takes for API calls\nto be processed, from the time they are received by Apigee until they are returned to the\nclient app.\n\n\n| **Note:** **Data delay interval** \n| After API calls are made to proxies, it may take up to **10 minutes** for the data to appear in dashboards, custom reports, and management API calls.\n\n\u003cbr /\u003e\n\nThe API Proxy Performance dashboard\n-----------------------------------\n\nTo access the Proxy Performance dashboard:\n\n1. In the Google Cloud console, go to the **Analytics \\\u003e API metrics \\\u003e API Proxy Performance** page.\n\n [Go to API Proxy Performance](https://console.cloud.google.com/apigee/analytics/proxy-performance)\n2. Select an **Environment or Hostname** and one or **All** proxies in the **Proxy** list. Selecting **All** shows charts for all proxies including aggregated data for proxies. Selecting a single proxy shows charts with data for that proxy only.\n3. If desired, change the default time range. For example, you can view data for the last day or the last 14 days.\n\nThe **API Proxy Performance** view is shown. Aggregate metrics for each chart, such as the\naverage transactions per second (**Average TPS**) are shown to the right of the chart\n\nWhat does this dashboard measure?\n---------------------------------\n\nThis dashboard includes these charts:\n\n- [Average transactions per second (TPS)](#averagetraffic)\n- [Traffic](#traffic)\n- [Average Response Time](#averageresponsetime)\n- [Traffic by Proxy](#trafficbyproxy)\n- [Average Response Time by Proxy](#averagebyproxy)\n\n| **Note:** This `client.received.start.timestamp` time value is used to calculate traffic metrics for API proxies in the analytics dashboards. For more information, see the [client](/apigee/docs/api-platform/reference/variables-reference#client) flow variable reference.\n\n### Average transactions per second (TPS)\n\n### Traffic\n\n### Average Response Time\n\nSee also this interesting article on the Apigee Community site:\n[When can the Average Total Response Time be less than the Average Target Response Time?](https://community.apigee.com/articles/2695/when-can-the-average-total-response-time-be-less-t.html)\n\nAverage proxy response time is calculated as the difference between the averages of total response time and target response time. The expectation is that total response time is always greater than the target response time. However, there are also calls which are handled by the proxy itself - preflight requests, cached responses, Oauth tokens etc which do not reach the backend system. These \"faster\" calls by the proxy reduce the average Total Response time without reducing the Target response time. Hence the average total response time may not always be greater than the average target response time which could result in negative values being seen for proxy response time. When you look at larger TPS without zooming in the time scale too much, these exceptions will not hold much weight and hence give you more accurate and actionable data.\n\nYou obtain the most meaningful average response data when a large number of requests are collected over a long period of time, rather than from just a few requests collected over a short period of time. If you only observe a small number of requests that come in over a short time period, there's a chance that even one call that does not go to the target will result in a negative average proxy response time. When evaluating average response times, it's best to view longer time frames that have high traffic.\n\n### Traffic by Proxy\n\n### Average Response Time by Proxy"]]