本页面适用于 Apigee 和 Apigee Hybrid。
查看 Apigee Edge 文档。

API Monitoring 时间轴视图显示近期 API 流量的时间轴,可帮助您诊断和调查问题。
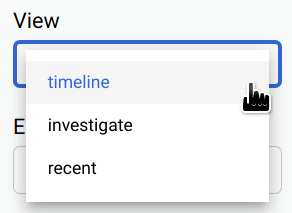
要访问时间轴视图,请按照访问 API Monitoring 中的步骤操作,并选择时间轴。
下图显示了已选定时间轴之后的界面。
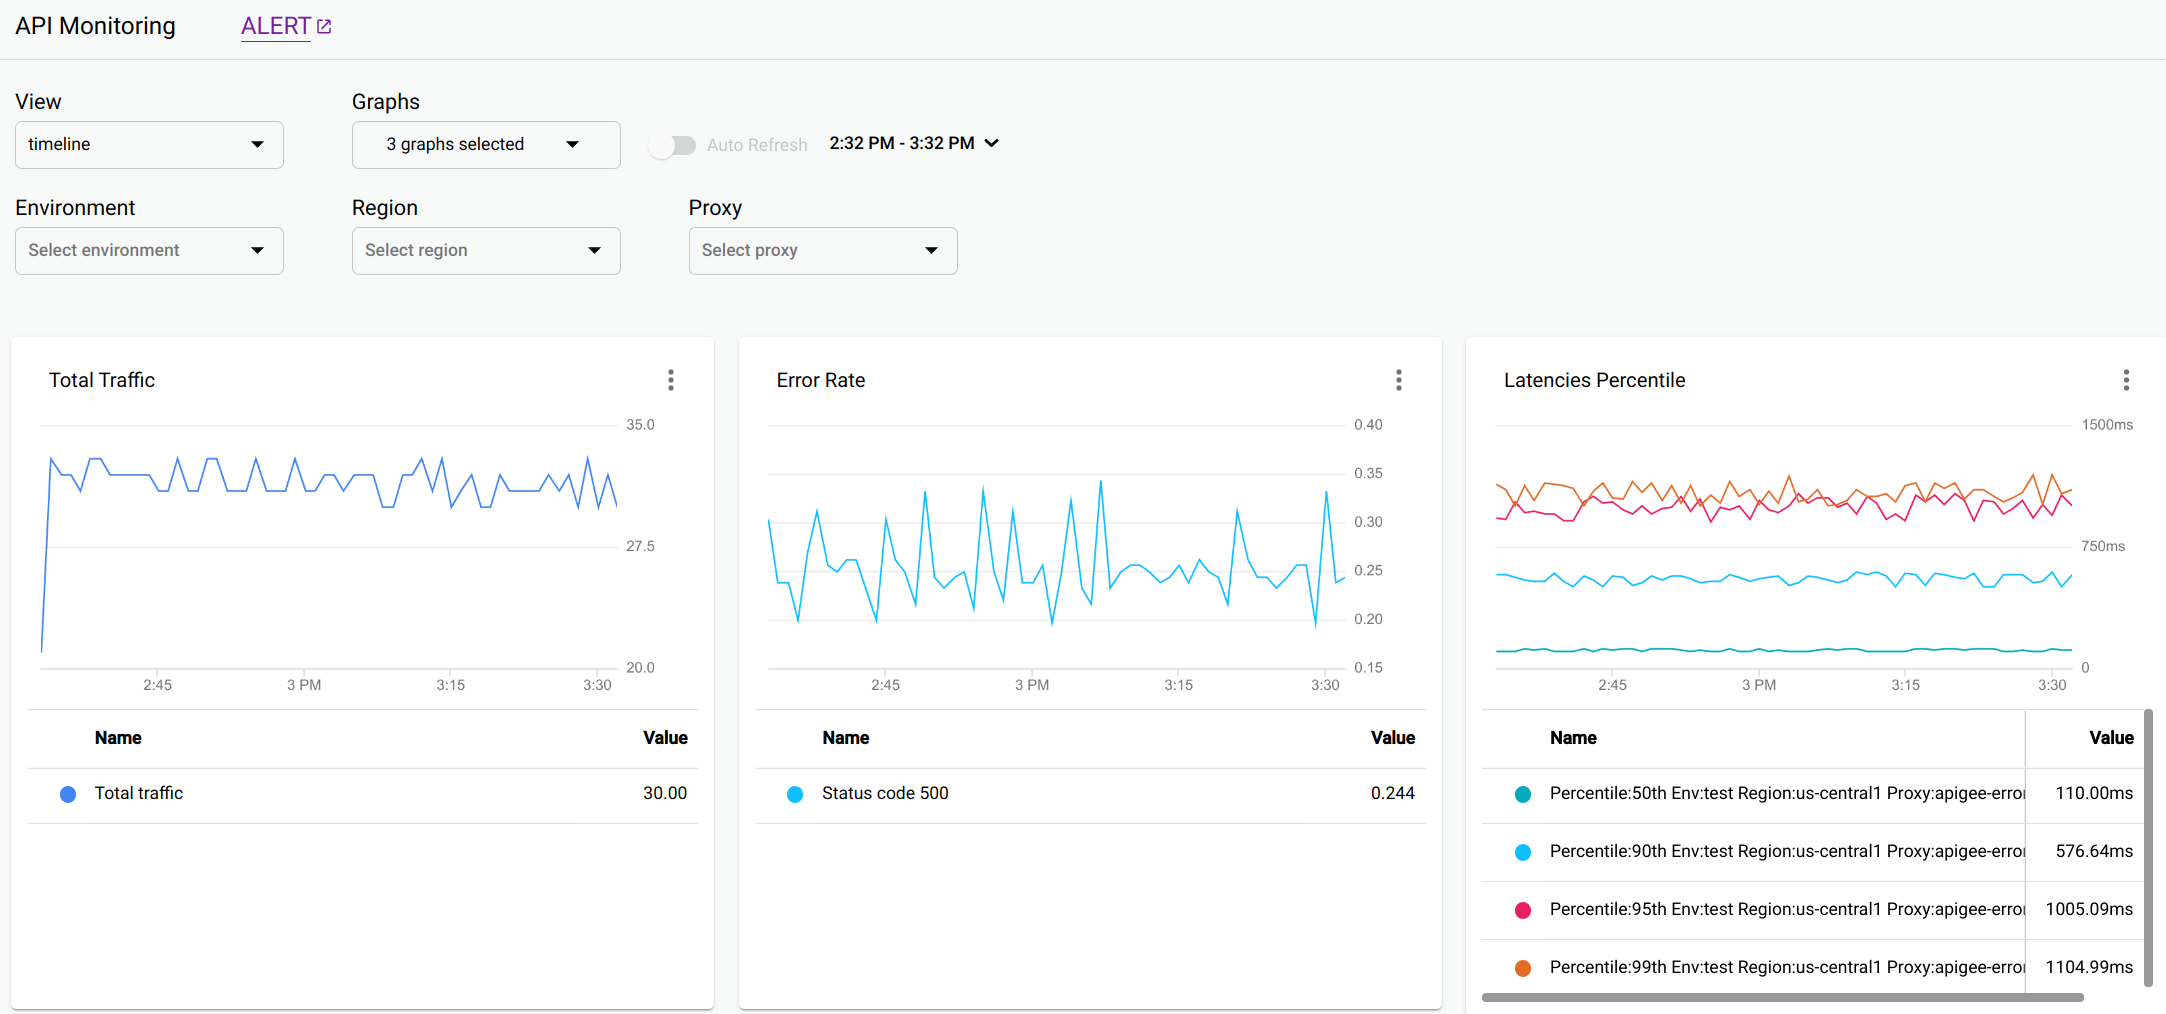
时间轴视图显示以下图表:
- 代理总流量:在相应时间范围 1 分钟时间段内的请求数。
- 代理错误率:错误总数(4xx 和 5xx)除以每个时间间隔的总流量。
- 代理延迟时间百分位:API 延迟时间的百分位。该图表显示了以下百分位:第 50 百分位(中位数)、第 90 百分位、第 95 百分位和第 99 百分位。
- 目标总流量
- 目标错误率
- 目标延迟时间百分位
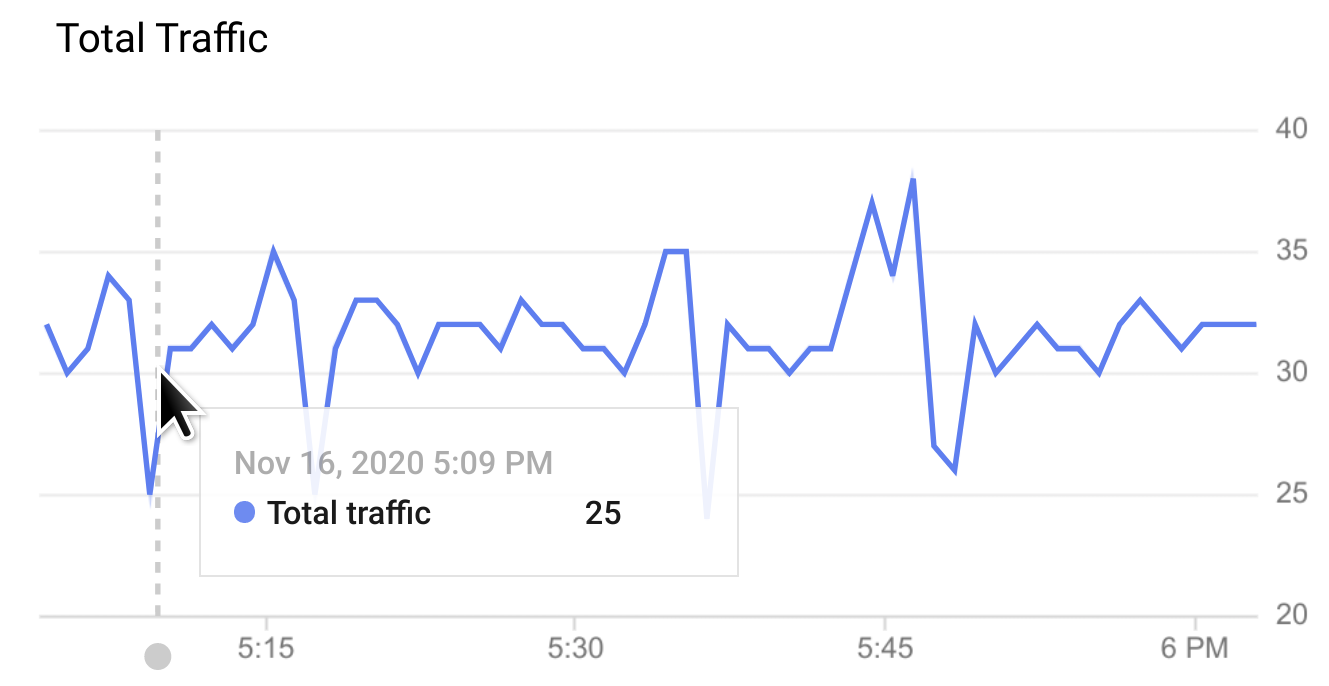
将鼠标悬停在图表中的任一点,即可显示该点的值。
您可以在图表下拉菜单中选择要显示的图表。
所有视图的图表选项
以下三种视图视图中都提供了以下图表选项:时间轴、调查和最近:
- 提醒:点击提醒可设置事件的提醒和通知,例如流量高峰或延迟。
视图:选择以下任一 API 监控视图:
- 时间轴(如上所示)
- 调查
- 近期
图表:从下拉列表中选择要显示的图表。
选择图表时,图表会按您选定的图表顺序显示,从最新选择的开始。
时间范围:选择图表的时间范围跨度。
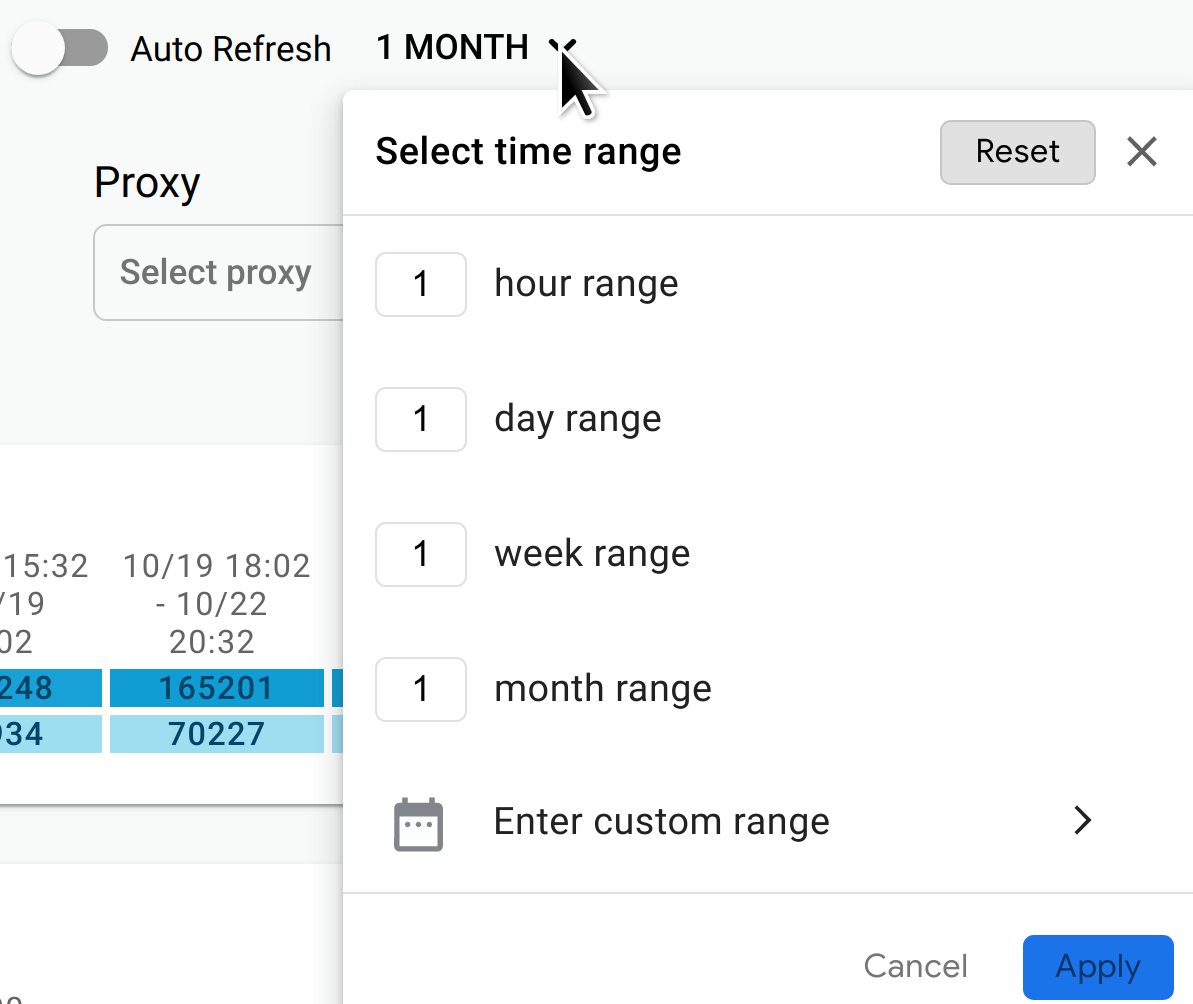
您还可以开启自动刷新,每分钟自动刷新一次数据。
环境:选择 API 的环境。
区域(仅限时间轴和调查视图):选择 API 区域。
代理(仅限时间轴和调查视图):选择 API 代理。