이 페이지는 Apigee 및 Apigee Hybrid에 적용됩니다.
Apigee Edge 문서 보기

API Monitoring 조사 뷰에는 모든 API 트래픽의 측정항목 및 속성의 피벗 테이블이 표시되므로 여러 측정항목의 활동을 비교할 수 있습니다.
조사 뷰에 액세스하려면 API 모니터링 액세스의 단계를 따르고 조사를 선택합니다.
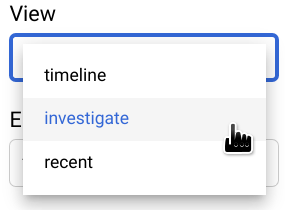
아래 그림은 조사가 선택된 UI를 보여줍니다.
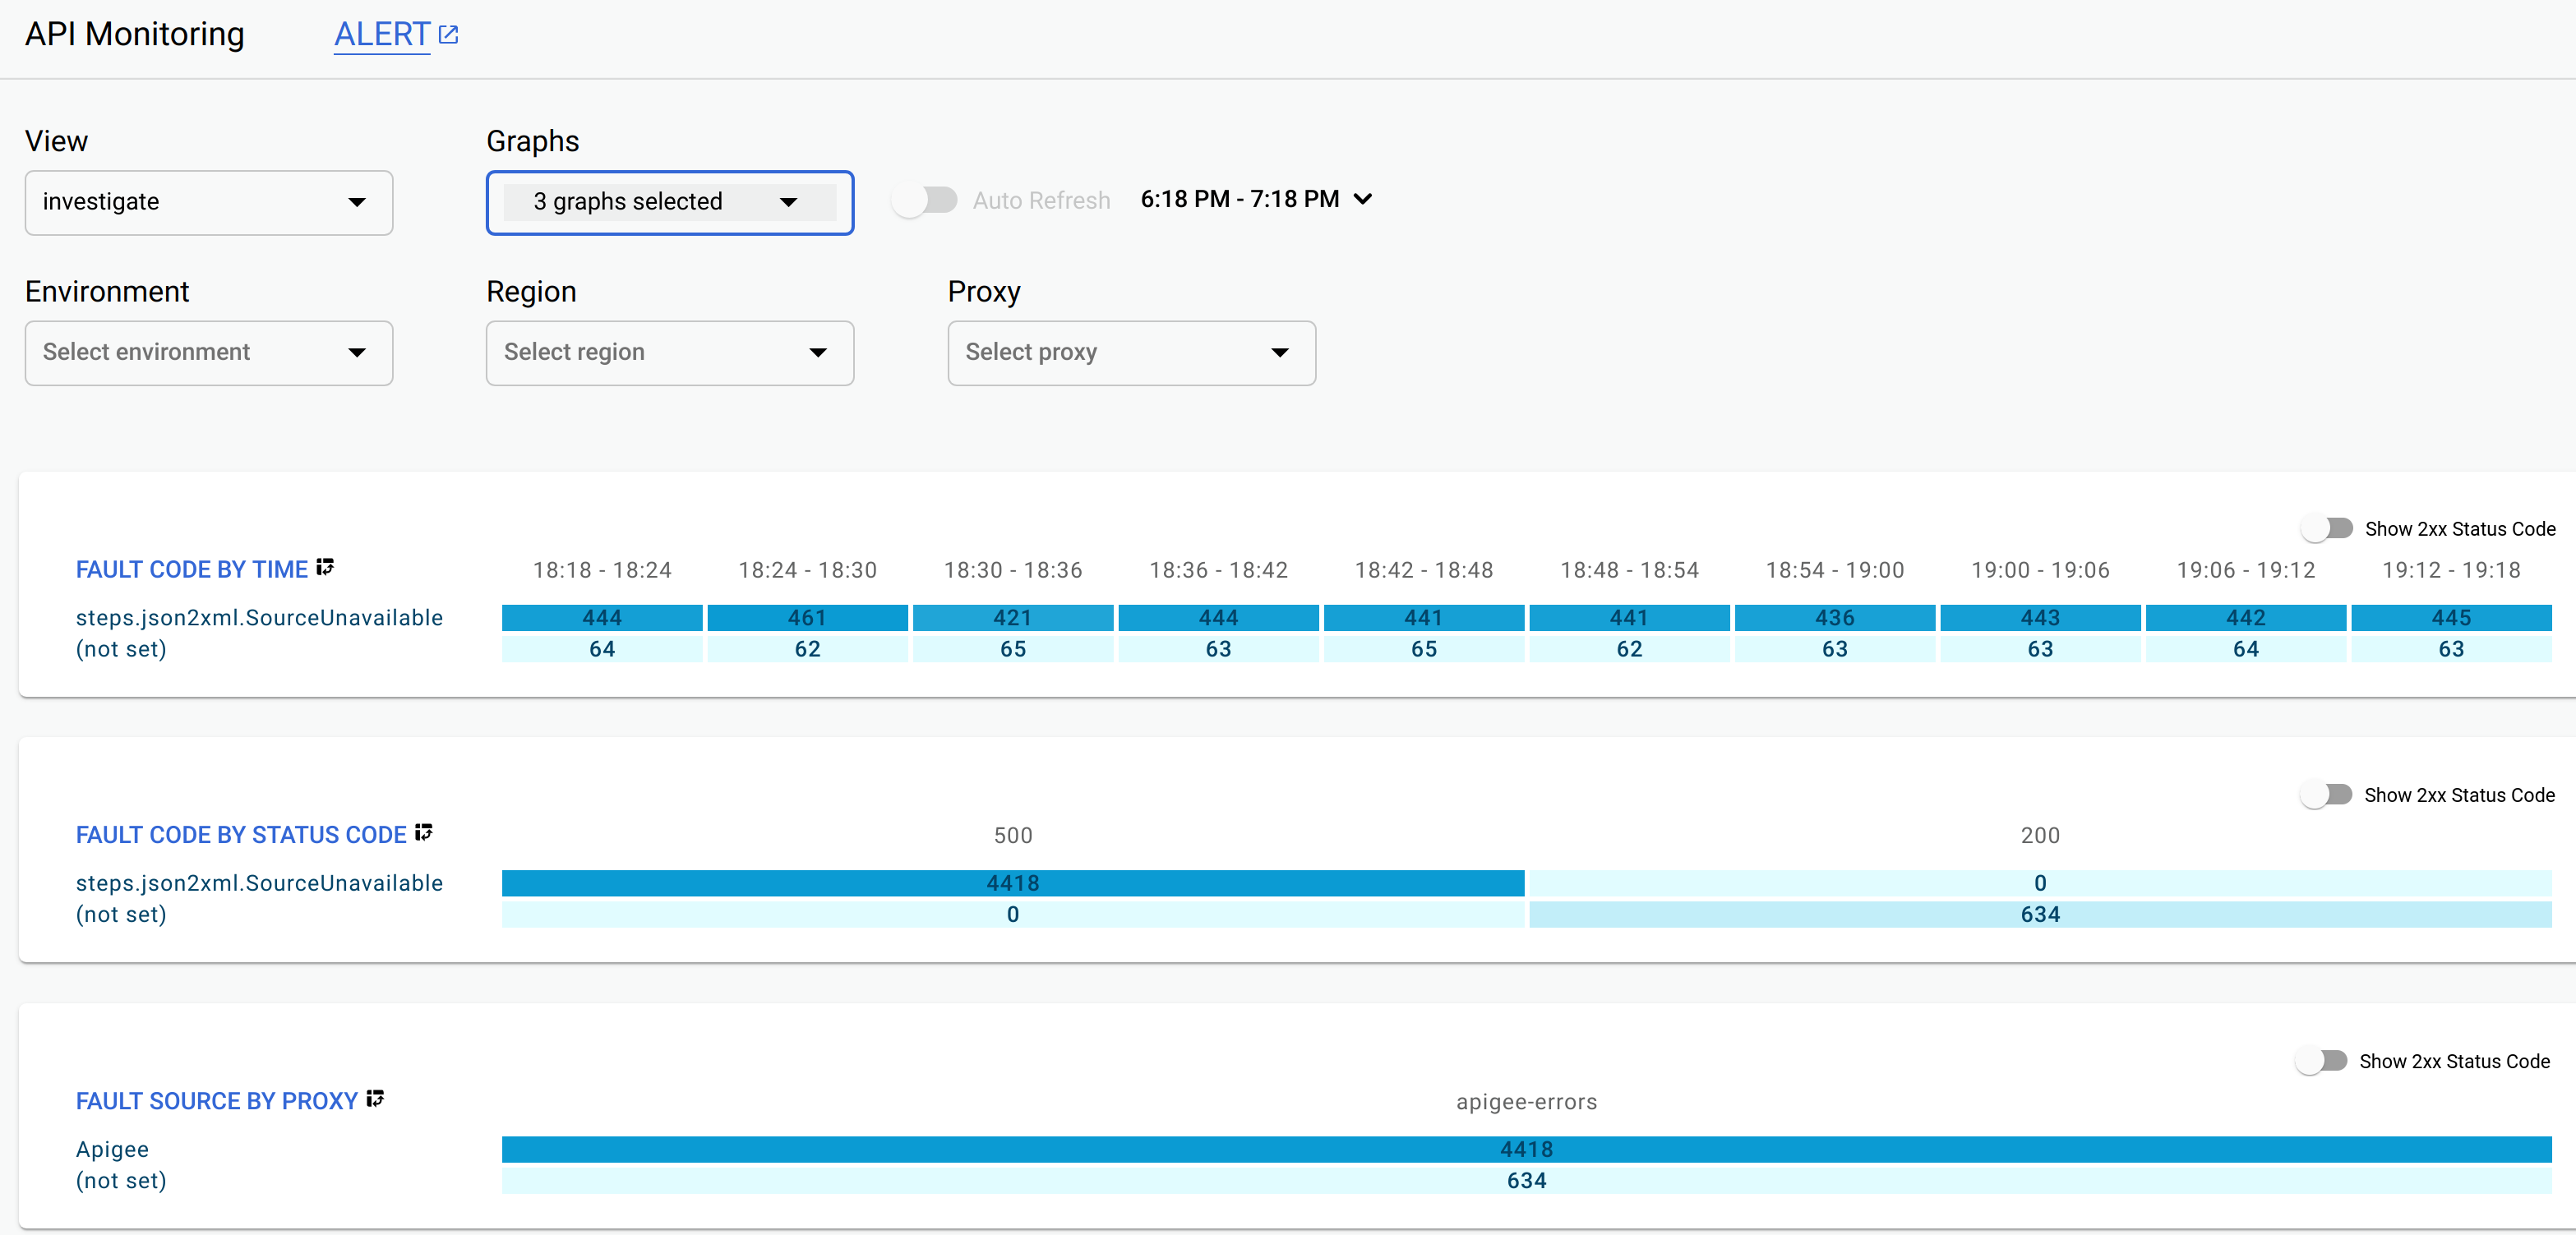
기본적으로 조사 뷰에는 세 개의 테이블이 표시됩니다.
- Fault Code by Time
- Fault Code by Status Code
- Fault Source by Proxy
타임라인 뷰와 마찬가지로 그래프 메뉴에서 표시할 테이블 조합을 선택할 수 있습니다. 다른 모든 그래프 옵션은 타임라인 뷰와 동일합니다.
테이블의 각 셀에는 데이터 하위 집합의 응답 수가 표시됩니다. 예를 들어 Fault Code by Time 테이블의 처음 3개 열을 살펴 봅니다.
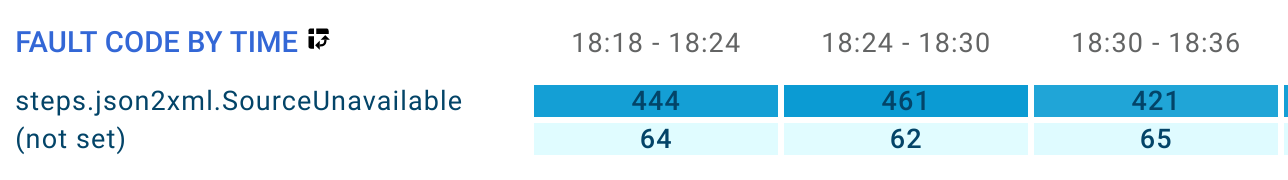
행 1의 첫 번째 셀에는 선택된 날짜의 18:18 - 18:24에서 반환된 오류 코드 steps.json2xml.SourceUnavailable이 있는 응답 수(444)가 표시됩니다.
행 2의 첫 번째 셀에는 어떤 이유로든 오류 코드가 설정되지 않은 동일한 시간 간격의 응답 수(64)가 표시됩니다.
이 특정 오류 코드에 대한 자세한 내용은 JSON-XML 정책 런타임 오류 문제 해결을 참조하세요.
2xx 상태 코드
2xx 상태 코드를 반환하는 요청이 성공적으로 수신되고 이해됩니다. 일반적으로 대부분의 요청은 2xx 상태 코드를 반환합니다. 실패한 요청의 데이터를 확인하려면 데이터를 더 쉽게 해석할 수 있도록 표시된 데이터를 2xx 이외의 상태 코드를 가진 요청으로 제한해야 할 수 있습니다. 이렇게 하려면 조사 뷰의 오른쪽 상단에 있는 2xx 상태 코드 표시 버튼을 왼쪽(사용 중지)으로 전환합니다.

이 설정을 사용하면 조사 뷰에 2xx 외의 응답 코드가 있는 요청의 데이터만 표시됩니다.
셀 데이터 분포 보기
셀을 클릭하면 개별 테이블 셀의 데이터를 보다 세부적으로 볼 수 있습니다. 이렇게 하면 여러 가지 속성별로 셀 데이터 분포가 표시됩니다.
이 예시를 보려면 먼저 그래프 메뉴에서 리전을 선택하여 아래에 나와 있는 테이블을 표시합니다.

이 예시의 데이터에는 us-central1 리전 하나만 있습니다.
다른 리전의 데이터가 있으면 테이블에 추가 행이 표시됩니다.
이제 테이블의 첫 번째 셀을 클릭합니다.

그러면 조사 뷰의 오른쪽 창에 여러 테이블이 표시됩니다. 첫 번째 테이블은 다음과 같습니다.
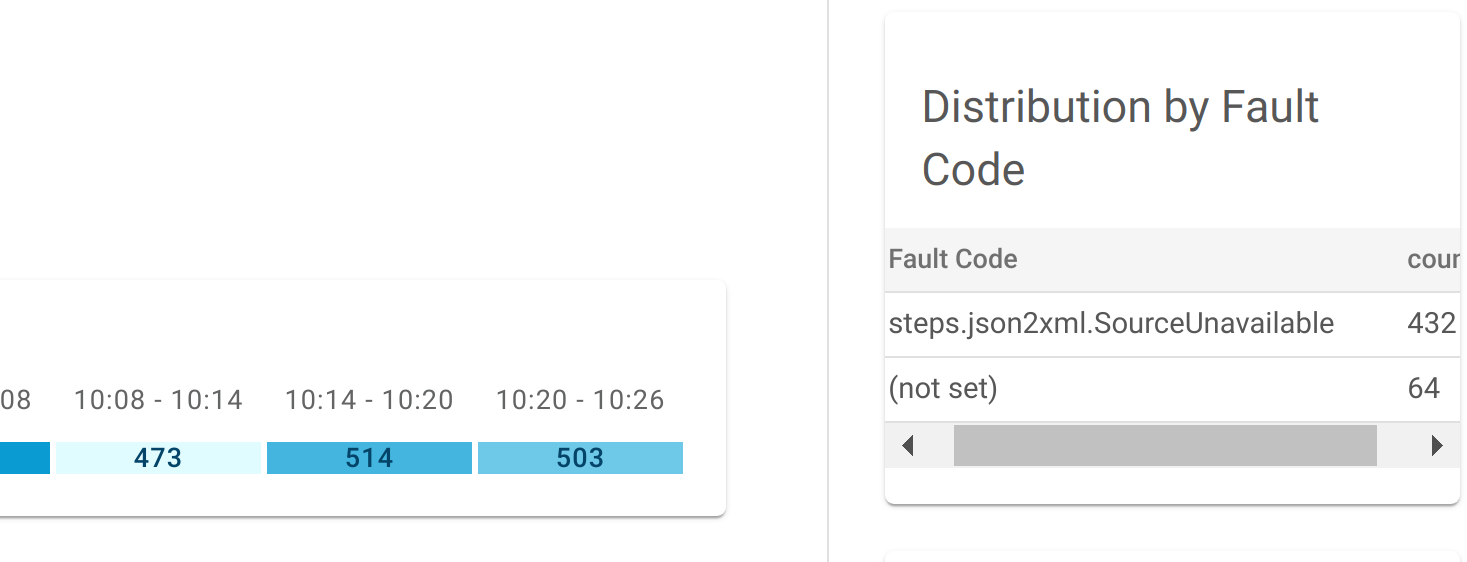
창의 상단에는 셀 데이터를 지정하는 조건이 표시됩니다(이 경우 리전 및 시간 간격).
그 아래에 있는 '오류 코드별 배포' 테이블에는 데이터의 각 오류 코드에 대한 응답 수가 표시됩니다. 이 예시에서는 두 개의 오류 코드 값이 있습니다.
| 오류 코드 | 개수 |
|---|---|
steps.json2xml.SourceUnavailable |
432 |
not set |
64 |
오류 코드 개수는 셀의 총 개수인 496을 추가합니다.
또 다른 예로, 아래와 같이 '상태 코드별 배포'라는 레이블이 붙은 테이블이 나올 때까지 오른쪽 창에서 아래로 스크롤합니다.
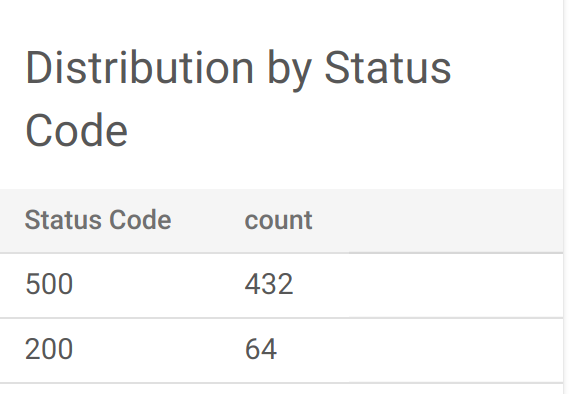
이 경우 데이터에 상태 코드 두 개가 있습니다.
500:432200:64
| 상태 코드 | 개수 |
|---|---|
500 |
432 |
200 |
64 |
다시 개수는 496이 됩니다.
조사 뷰를 사용하여 문제 진단
조사 뷰를 사용하여 API 문제를 진단할 수 있습니다. 예를 들어 5xx 오류 비율이 지정된 기준점을 초과한다는 알림이 수신되었다고 가정해보세요. 이 문제를 조사하기 위해서는 조사 뷰에서 다음 작업을 수행할 수 있습니다.
- FAULT CODE BY TIME 테이블에서 이전 1시간 동안의 오류 코드 활동을 확인합니다.
- FAULT CODE BY STATUS CODE 테이블에서 이전 단계에서 식별한 대로 최근 1시간 동안 수가 증가한 오류 코드와 연관된 특정 HTTP 상태 코드를 확인합니다.
- FAULT CODE BY PROXY 표에서 이전 단계에서 식별한 오류 코드를 트리거하는 API 프록시를 확인합니다.
- 문제를 진단하는 데 도움을 줄 수 있도록 알림을 설정합니다.