Apigee ti consente di creare avvisi attivati da pattern di traffico API specifici, ad esempio quando il tasso di errori di un'API raggiunge una soglia predeterminata. AAPI Ops estende questa funzionalità con gli avvisi di anomalie, che vengono attivati ogni volta che Apigee rileva dati di traffico API insoliti. Il vantaggio degli avvisi di anomalia è che non devi definire tu stesso le condizioni esatte
per ogni anomalia. AAPI Ops determina le condizioni di anomalia corrette utilizzando metodi statistici
e le aggiorna costantemente in base ai dati sul traffico recenti.
Utilizzando il rilevamento delle anomalie, consenti ad Apigee di rilevare problemi di traffico e rendimento, anziché
predeterminare tu stesso le condizioni di avviso.
Quando AAPI-Ops rileva un'anomalia, mostra l'evento nella dashboard Anomaly Events. Tuttavia, non genera automaticamente un avviso per
l'anomalia. Se esamini un'anomalia nella dashboard e decidi di ricevere un avviso in caso di eventi simili in futuro, puoi creare un avviso di anomalia e configurare una notifica che ti invia un messaggio ogni volta che viene rilevata l'anomalia.
Prima di creare un avviso di anomalia, assicurati di aver ricevuto i
ruoli richiesti
per AAPI Ops.
Per creare un avviso di anomalia nella dashboard dei criteri di avviso:
Nota:apri la dashboard Crea criterio di avviso in una nuova scheda se vuoi seguire
i passaggi riportati di seguito.
Fai clic su AGGIUNGI CONDIZIONE. Si apre una nuova finestra in cui puoi aggiungere la condizione di avviso.
(Facoltativo) Aggiungi un titolo alla
condizione nel campo Condizione senza titolo. Lasceremo il campo vuoto per
questo esempio, nel qual caso alla condizione viene assegnato un titolo predefinito.
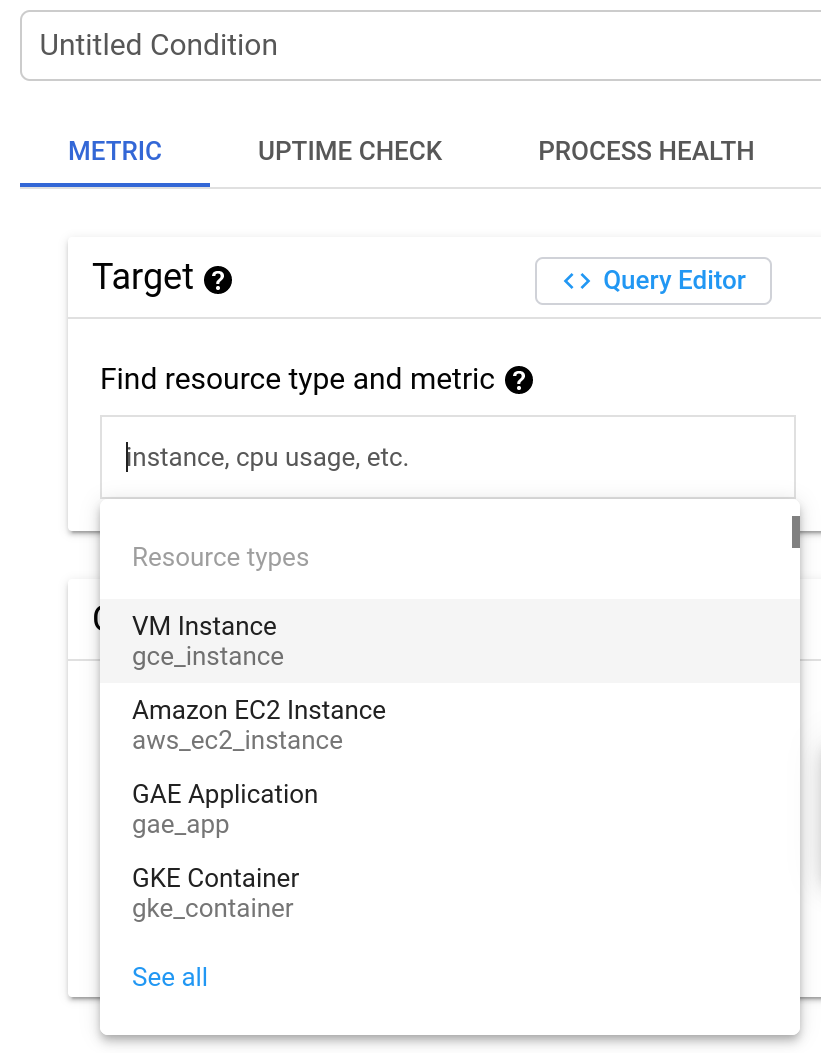
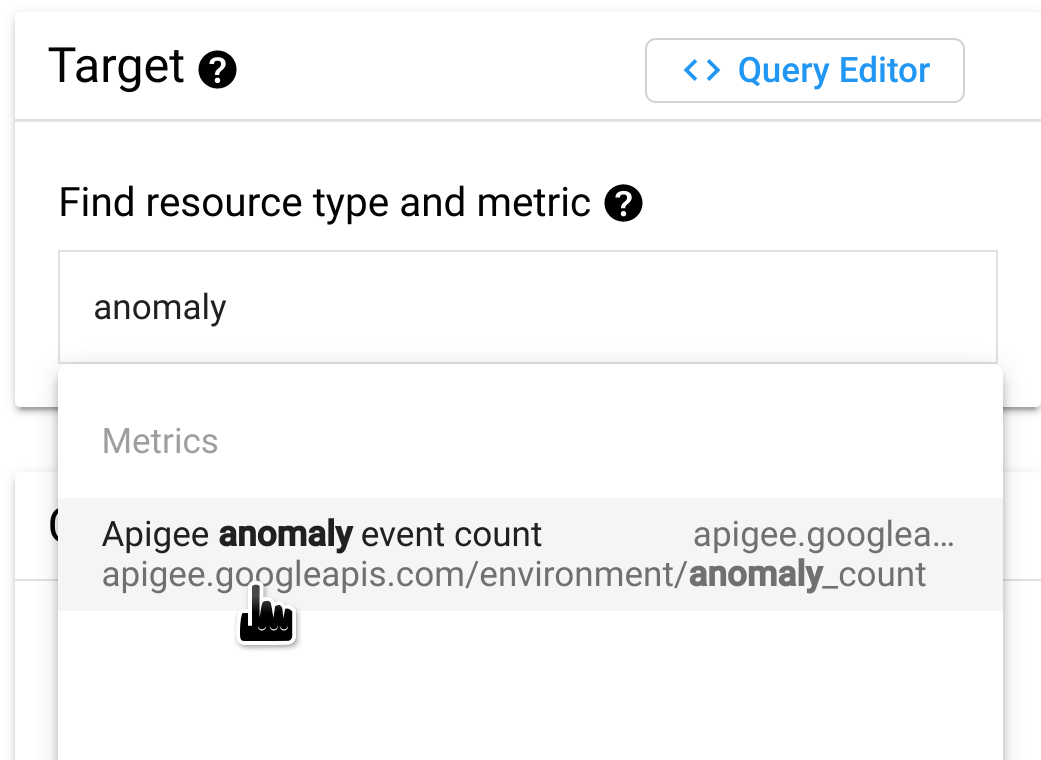
Nel campo Find resource type and metric (Trova tipo di risorsa e metrica), digita
anomaly
e poi seleziona Conteggio eventi anomali Apigee.
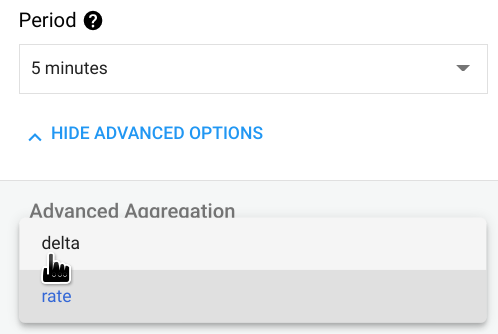
Fai clic su MOSTRA IMPOSTAZIONI AVANZATE e nel riquadro Aggregazione avanzata,
seleziona delta nel campo Allineatore. Specifica come vengono aggregati i dati in ogni periodo di tempo, che puoi impostare nel campo Periodo.
Con l'impostazione Delta, il valore aggregato è uguale al valore dei dati finali nel periodo di tempo meno il valore dei dati iniziali.
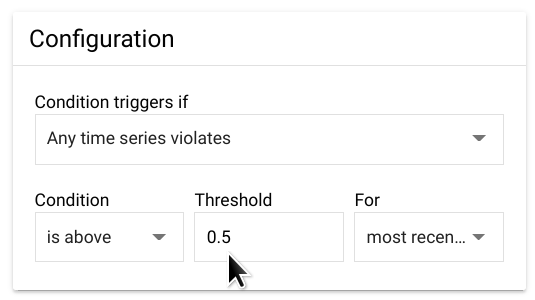
Nel riquadro Configurazione, imposta Soglia su 0,5.
Qualsiasi numero compreso tra 0 e 1 andrà bene per la soglia.
Con questo valore, una singola anomalia supera la soglia e attiva l'avviso.
Fai clic su Aggiungi. In questo modo tornerai alla pagina Crea policy di avviso, dove potrai visualizzare la condizione che hai appena creato.
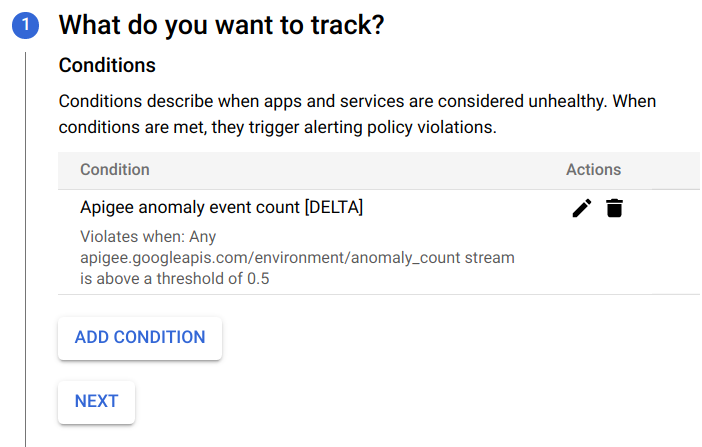
A questo punto puoi scegliere di:
Fai clic su AGGIUNGI condizione per creare un'altra condizione per l'avviso oppure
Fai clic su AVANTI per passare al passaggio successivo, in cui avrai la possibilità di
creare una notifica per l'avviso, come descritto nella sezione successiva.
Se non vuoi creare una notifica, fai clic su AVANTI due volte
senza inserire nulla per saltare i passaggi 2 e 3.
Fai clic su SALVA per salvare l'avviso.
Creazione di una notifica per un avviso
Se vuoi ricevere una notifica immediata quando si verifica un incidente, puoi creare
una notifica per l'avviso. Quando l'avviso viene attivato, Apigee ti invia
una notifica. Puoi scegliere uno dei seguenti canali per ricevere la notifica:
Email
PagerDuty
Slack
Webhook
Per creare una notifica per un avviso:
Se hai appena creato l'avviso (come mostrato nell'esempio precedente) e stai visualizzando la dashboard Crea criterio di avviso, vai al passaggio successivo.
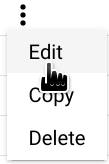
In caso contrario, apri il
riquadro Criteri nel dashboard Avvisi della console Cloud e, nella
riga dell'avviso che hai creato, fai clic sull'icona con tre puntini alla fine
della riga e seleziona Modifica.
Si apre la dashboard Modifica policy di avviso:
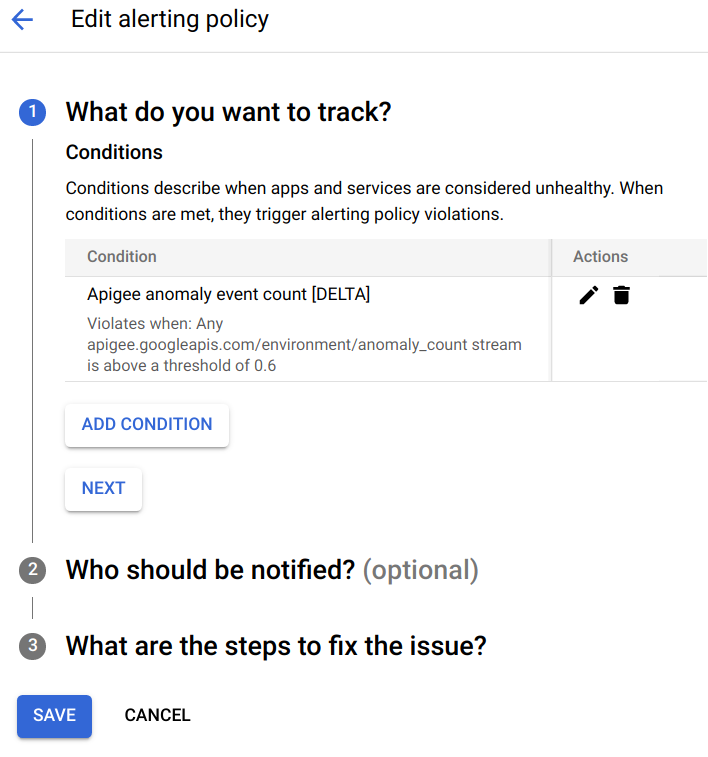
Nella sezione Che cosa vuoi monitorare?, fai clic su AVANTI.
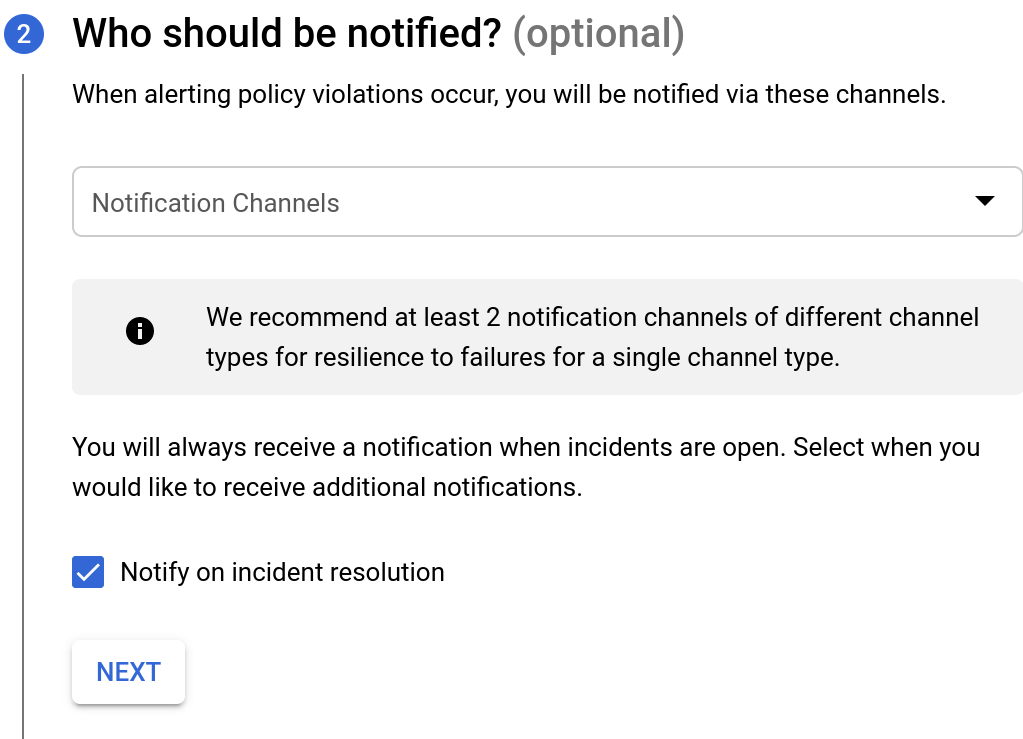
Nella sezione Chi dovrebbe ricevere le notifiche?, seleziona
Canali di notifica, dove puoi scegliere tra i canali esistenti per ricevere
le notifiche.
Se vuoi creare un nuovo
canale di notifica, seleziona GESTISCI CANALI DI NOTIFICA. Si apre la dashboard Canali di notifica nella console Cloud, dove puoi aggiungere canali. Per saperne di più, consulta la pagina
Crea e gestisci canali di notifica.
Fai clic su AVANTI. Vengono visualizzate le opzioni mostrate di seguito.
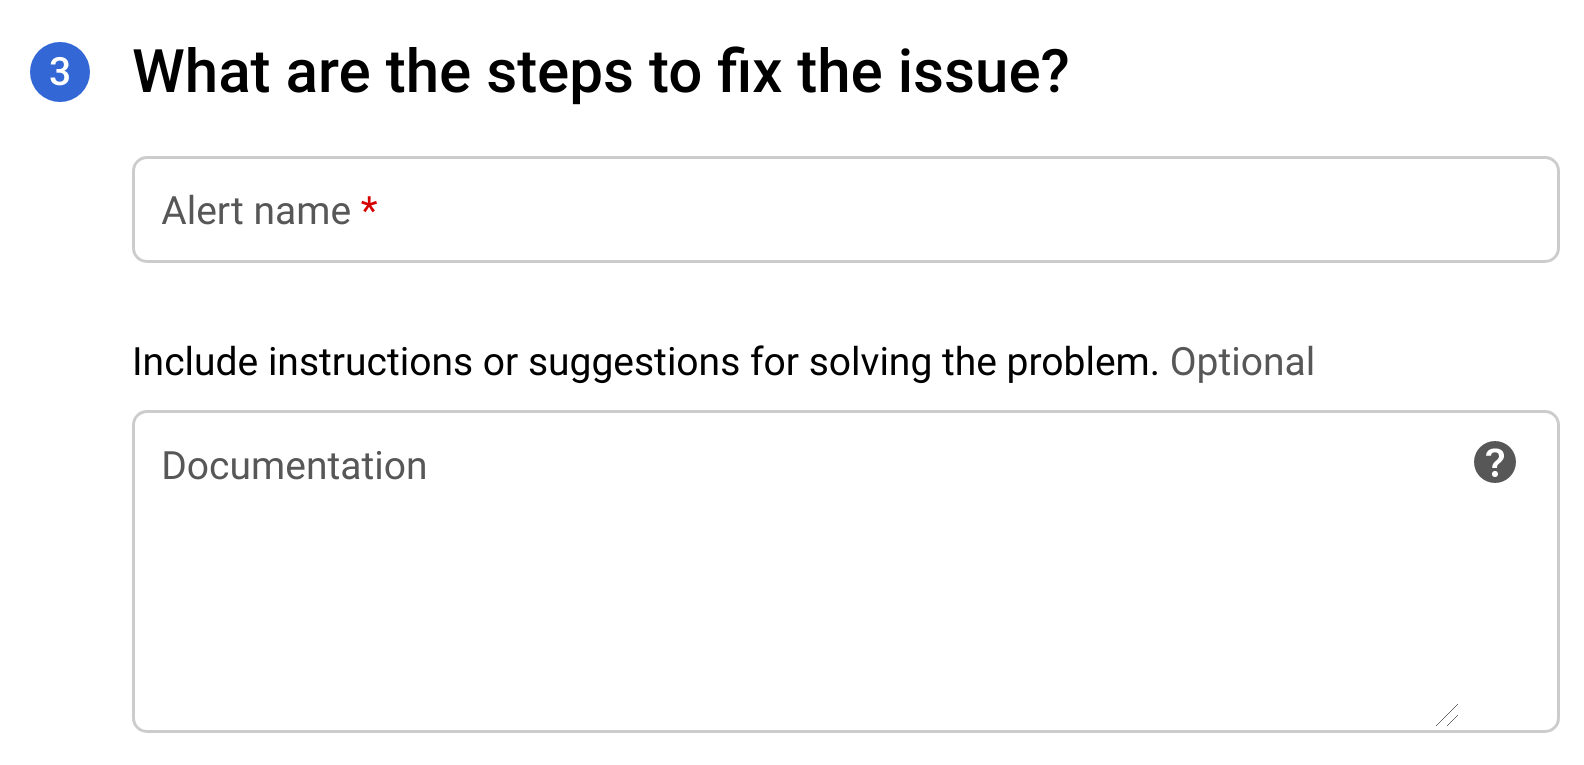
Nel campo Nome avviso, inserisci un nome per l'avviso.
Nel campo Documentazione, inserisci l'URL di una pagina web
che fornisce informazioni su come risolvere il problema che ha causato l'avviso. L'URL verrà incluso nella notifica.
Fai clic su Salva per creare l'avviso.
Quando viene attivato un avviso, riceverai una notifica
con un riepilogo dell'incidente e della data in cui si è verificato. La notifica
contiene anche due link per aiutarti a esaminare l'incidente:
VISUALIZZA INCIDENTE: visualizza l'incidente nella console Cloud.
VISUALIZZA IN APIGEE: visualizza un grafico cronologico del traffico API e delle tabelle di dati correlate
nella dashboard Esamina di API Monitoring.
[[["Facile da capire","easyToUnderstand","thumb-up"],["Il problema è stato risolto","solvedMyProblem","thumb-up"],["Altra","otherUp","thumb-up"]],[["Difficile da capire","hardToUnderstand","thumb-down"],["Informazioni o codice di esempio errati","incorrectInformationOrSampleCode","thumb-down"],["Mancano le informazioni o gli esempi di cui ho bisogno","missingTheInformationSamplesINeed","thumb-down"],["Problema di traduzione","translationIssue","thumb-down"],["Altra","otherDown","thumb-down"]],["Ultimo aggiornamento 2025-09-04 UTC."],[[["\u003cp\u003eApigee offers anomaly alerts that automatically detect unusual API traffic patterns without requiring users to manually define specific anomaly conditions.\u003c/p\u003e\n"],["\u003cp\u003eAnomaly detection events are displayed on the Anomaly Events dashboard, and users can choose to set up anomaly alerts with notifications for similar future events.\u003c/p\u003e\n"],["\u003cp\u003eTo create an anomaly alert, users must navigate to the "Create alerting policy" dashboard in the Google Cloud console and select "Apigee anomaly event count" as the metric.\u003c/p\u003e\n"],["\u003cp\u003eUsers can configure notifications for anomaly alerts to be sent via email, PagerDuty, Slack, or webhooks when an anomaly is detected.\u003c/p\u003e\n"],["\u003cp\u003eWhen an anomaly alert is triggered, notifications include links to view the incident in the Cloud console and an API traffic timeline graph in the API Monitoring Investigate dashboard.\u003c/p\u003e\n"]]],[],null,["# Creating anomaly alerts\n\n*This page\napplies to **Apigee** and **Apigee hybrid**.*\n\n\n*View [Apigee Edge](https://docs.apigee.com/api-platform/get-started/what-apigee-edge) documentation.*\n\nApigee enables you to create alerts that are triggered by specific API traffic patterns---\nfor example, when an API's\nerror rate reaches a predetermined threshold. AAPI Ops extends this capability with\n*anomaly alerts*, which are triggered whenever Apigee detects unusual API traffic\ndata. The advantage of anomaly alerts is that you don't have to define the exact conditions\nfor each anomaly yourself. AAPI Ops determines the right anomaly conditions using statistical methods,\nand constantly updates them based on recent traffic data.\nUsing anomaly detection, you let Apigee detect traffic and performance issues, rather than\npredetermining the alert conditions yourself.\n| **Important:** \"Anomaly Detection\" describes the Advanced API Operations Anomaly Detection functionality, which is available in the Classic Apigee UI. This functionality is comparable to the \"Operations Anomalies\" functionality in [Apigee UI in Cloud console](https://console.cloud.google.com/apigee). Both are available at this time. See [Operations Anomalies overview](/apigee/docs/api-platform/analytics/operations-anomalies-overview) for information on the Operations Anomalies functionality.\n\nWhen AAPI-Ops detects an anomaly, it displays the event in the Anomaly Events\ndashboard. However, it doesn't automatically raise an alert for\nthe anomaly. If you examine an anomaly in the dashboard and decide you want to be alerted about\nsimilar event in future, you can create an anomaly alert\nand set up a notification, which sends you a message whenever the anomaly is detected.\n\nBefore creating an anomaly alert, make sure you have been assigned the\n[required roles](/apigee/docs/aapi-ops#required-roles-for-aapi-ops)\nfor AAPI Ops.\n\nTo create an anomaly alert in the Alerting policy dashboard, do the following:\n\n1. Open the\n [Create alerting policy](https://console.cloud.google.com/monitoring/alerting/policies/create?) dashboard in the Google Cloud console.\n\n **Note:** Open the Create alerting policy dashboard in a new tab if you want to follow\n the steps below.\n2. Click **ADD CONDITION** . This opens a new window where you can add the alert condition.\n\n\n3. Optional: Add a title for the condition in the **Untitled Condition** field. We'll leave it blank for this example, in which case the condition is given a default title.\n4. In the **Find resource type and metric** field, type\n\n ```\n anomaly\n ```\n\n and then select **Apigee anomaly event count**.\n5. Click **SHOW ADVANCED SETTINGS** and in the **Advanced Aggregation** pane,\n select **delta** in the **Aligner** field. This specifies how the data is\n aggregated over each time period, which you can set in the **Period** field.\n With the **delta** setting, the aggregated value equals the\n final data value in the time period minus the initial data value.\n\n6. In the **Configuration** pane, set the **Threshold** to **0.5**.\n (Any number between 0 and 1 will work for the threshold.)\n With this value, a single anomaly exceeds the threshold and triggers the alert.\n\n7. Click **Add** . This takes you back to the **Create alerting policy** page\n where you can see the condition you just created.\n\nAt this point you can choose to either:\n\n- Click **ADD Condition** to create another condition for the alert, or\n- Click **NEXT** to go to the next step, where you will have the option to [create a notification for the\n alert](#creating-a-notification-for-an-alert), as described in the next section.\n\nIf you don't want to create a notification, click **NEXT** twice\nwithout entering anything to bypass Steps 2 and 3.\n\nClick **SAVE** to save the alert.\n\nCreating a notification for an alert\n------------------------------------\n\nIf you want to be notified immediately when an incident occurs, you can create\na notification for the alert. When the alert is triggered, Apigee sends you\na notification. You can choose any of the following channels to receive\nthe notification:\n\n- Email\n- PagerDuty\n- Slack\n- Webhooks\n\n| **Note:** Currently, to receive a notification, you must add **org** to the **Group by** field in the alert. This requirement will be removed in a future release.\n\nTo create a notification for an alert:\n\n1. If you just created the alert (as shown in the\n preceding example) and are currently viewing the\n **Create alerting policy** dashboard, skip to the next step.\n\n Otherwise, open the\n [**Policies** pane](https://console.cloud.google.com/monitoring/alerting/policies) in the Cloud console Alerting dashboard, and in\n the row for the alert you created, click the three dots icon at the end\n of the row and select **Edit**.\n\n This opens the **Edit alerting policy** dashboard:\n2. In the **What do you want to track?** section, click **NEXT**.\n\n3. In the **Who should be notified** section, select\n **Notification Channels**, where you can choose from existing channels for receiving\n notifications.\n\n If you want to create a new\n notification channel, select **MANAGE NOTIFICATION CHANNELS** . This\n opens the Notification channels dashboard in the Cloud console, where you can\n add channels. See\n [Create and manage notification channels](https://cloud.google.com/monitoring/support/notification-options) for more details.\n4. Click **NEXT**. This displays the options shown below.\n\n5. In the **Alert name** field, enter a name for the alert.\n6. In the **Documentation** field, enter the URL for a web page that provides information on how to fix the issue that caused the alert. The URL will be included in the notification.\n7. Click **Save** to create the alert.\n\nWhen an alert is triggered, you will receive a notification\nproviding a summary of the incident and when it occurred. The notification\nalso contains two links to help you investigate the incident:\n\n- **VIEW INCIDENT**: View the incident in the Cloud console.\n- **VIEW IN APIGEE** : View a timeline graph of API traffic and related data tables in the [API Monitoring Investigate dashboard](/apigee/docs/api-monitoring/investigate)."]]