本页面适用于 Apigee 和 Apigee Hybrid。
查看 Apigee Edge 文档。

Apigee 界面中的异常值事件信息中心是检测到的 API 异常值的主要信息来源。信息中心会显示最近的异常值列表。
在打开信息中心之前,请确保您已分配有 AAPI Ops 所需角色。
如需打开异常信息中心,请执行以下操作:
Cloud 控制台中的 Apigee
-
在 Google Cloud 控制台中,前往操作异常页面。
- 切换到您要监控的组织。
默认情况下,信息中心会显示过去一小时内出现的异常值。如果在这段时间内未检测到任何异常值,则信息中心中将不显示任何行。在这种情况下,您可以从信息中心右上角的时间范围菜单中选择一个更大的时间范围。
表格中的每一行对应一个检测到的异常值,并显示以下信息:
- 异常值的日期和时间。
- 异常值的简要摘要,包括发生异常的代理和触发它的故障代码。
- 出现异常值的环境。
- 出现异常值的区域。
- 异常值的严重程度:轻微、中等或严重。严重程度的界定基于事件发生可能性的统计测量结果(p 值)。事件发生的可能性越大,严重程度越高。
您可以进一步调查异常值,以确定应采取什么应对措施(如有)。要开始调查,最适合的位置是 API Monitoring 信息中心,您可以在其中查看最近的 API 流量数据的各种图表。下一部分调查异常值介绍了具体操作。
经典版界面
登录 Apigee 界面。
注意:如果要执行以下步骤,请在新标签页中打开 Apigee 界面。
- 切换到您要监控的组织。
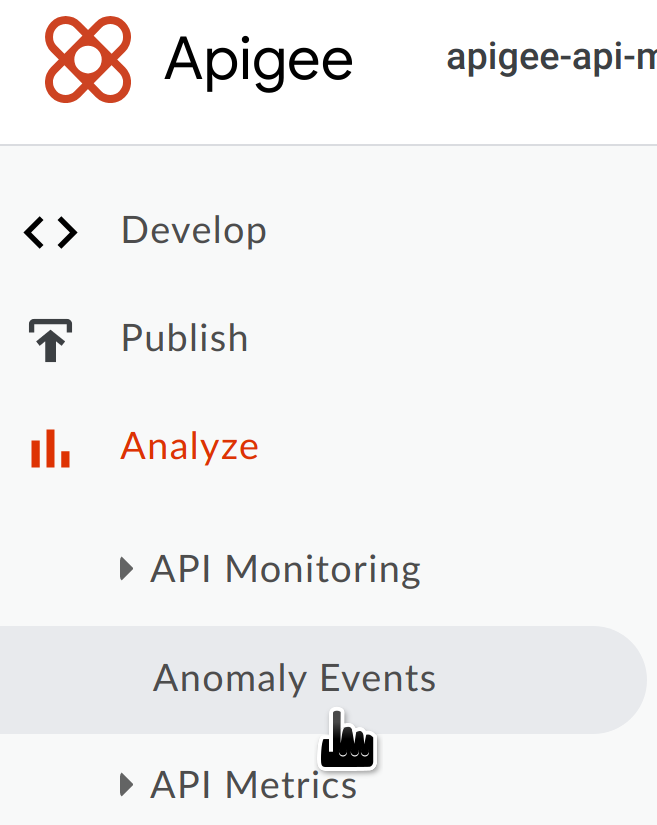
- 在导航窗格中,依次选择 分析 > 异常值事件 (Anomaly Events)。
此时将显示异常值事件信息中心。

默认情况下,信息中心会显示过去一小时内出现的异常值。如果在这段时间内未检测到任何异常值,则信息中心中将不显示任何行。在这种情况下,您可以从信息中心右上角的时间范围菜单中选择一个更大的时间范围。

如果此时间范围内存在异常值,则会按以下方式显示。
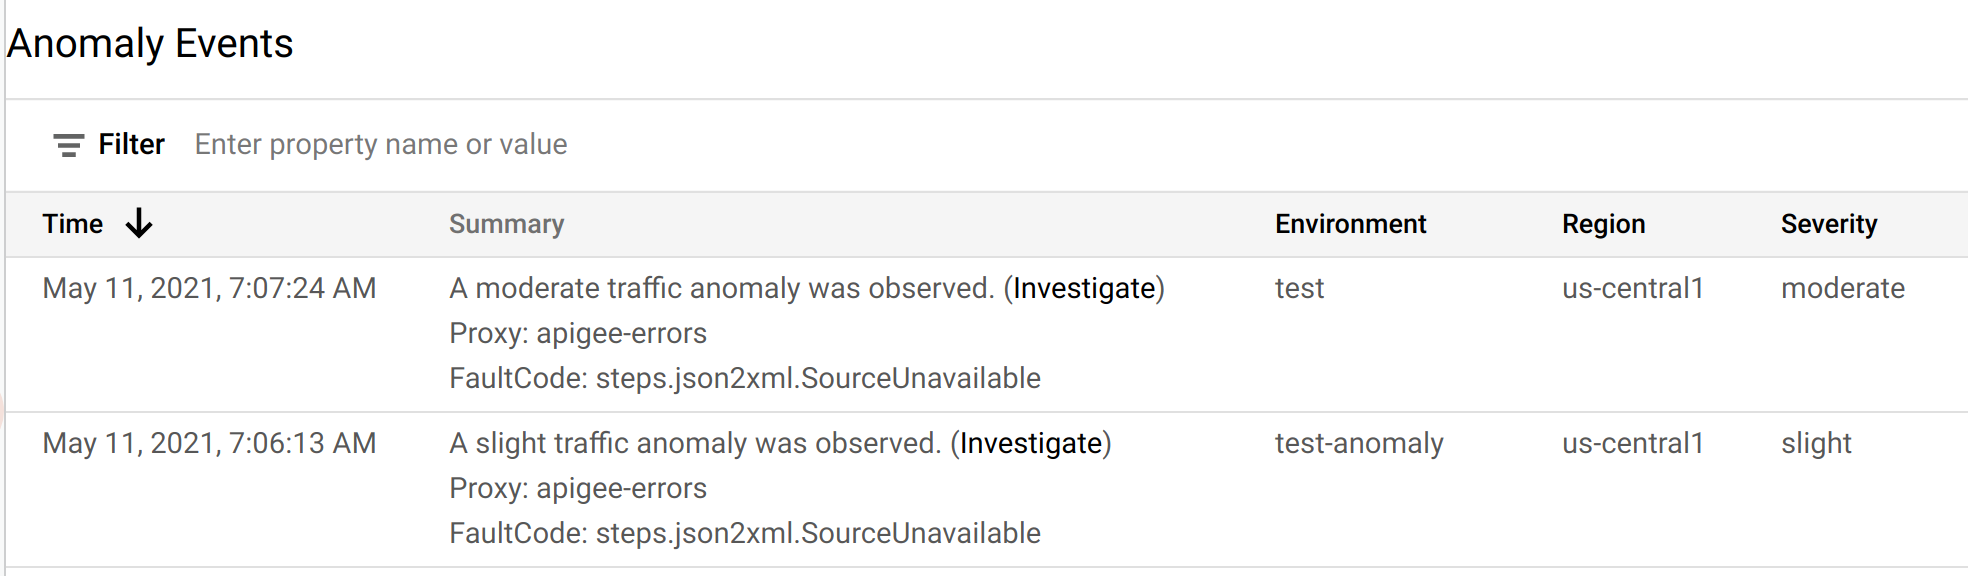
表格中的每一行对应一个检测到的异常值,并显示以下信息:
- 异常值的日期和时间。
- 异常值的简要摘要,包括发生异常的代理和触发它的故障代码。
- 出现异常值的环境。
- 出现异常值的区域。
- 异常值的严重程度:轻微、中等或严重。严重程度的界定基于事件发生可能性的统计测量结果(p 值)。事件发生的可能性越大,严重程度越高。
您可以进一步调查异常值,以确定应采取什么应对措施(如有)。要开始调查,最适合的位置是 API Monitoring 信息中心,您可以在其中查看最近的 API 流量数据的各种图表。下一部分调查异常值介绍了具体操作。