This guide shows you how to configure Google Cloud's Agent for SAP to collect the SAP HANA monitoring metrics from your SAP HANA systems.
For information about this feature, see Monitoring SAP HANA using Google Cloud's Agent for SAP.
Before you begin
- Validate your installation of Google Cloud's Agent for SAP. For instructions, see the installation guide for your scenario.
- If you have installed the agent on a Bare Metal Solution server, then make sure that you have completed the required prerequisites and set up a service account. For instructions, see Configure Google Cloud's Agent for SAP on Linux.
Required IAM roles
To ensure that the service account has the necessary permissions to let Google Cloud's Agent for SAP collect SAP HANA monitoring metrics, ask your administrator to grant the service account the following IAM roles on your project:
-
Compute Viewer (
roles/compute.viewer): to collect the SAP HANA monitoring metrics from the Compute Engine instance that hosts your SAP system. -
Monitoring Metric Writer (
roles/monitoring.metricWriter): to write the collected metrics to Cloud Monitoring. -
(Optional) Secret Manager Secret Accessor (
roles/secretmanager.secretAccessor): if you are using Secret Manager to store the password to connect to the SAP HANA database.
For more information about granting roles, see Manage access to projects, folders, and organizations.
These predefined roles contain the permissions required to let Google Cloud's Agent for SAP collect SAP HANA monitoring metrics. To see the exact permissions that are required, expand the Required permissions section:
Required permissions
The following permissions are required to let Google Cloud's Agent for SAP collect SAP HANA monitoring metrics:
-
To collect the SAP HANA monitoring metrics from the host Compute Engine instance and write them to Cloud Monitoring:
-
monitoring.timeSeries.create -
compute.nodeGroups.get -
compute.nodeGroups.list
-
-
If you are using Secret Manager to store the password to connect to the SAP HANA database, then to access the secret:
secretmanager.versions.access
Your administrator might also be able to give the service account these permissions with custom roles or other predefined roles.
Required SAP HANA roles
To let the agent collect metrics from your SAP HANA database, make sure that the SAP HANA user
that you specify in the agent's configuration file has the MONITORING role.
For information about this role, see the SAP document Standard Database Roles.
Enable SAP HANA Monitoring metrics collection
To enable the collection of SAP HANA Monitoring metrics using Google Cloud's Agent for SAP, follow these steps:
Establish an SSH connection with your Compute Engine instance or Bare Metal Solution server.
Open the agent's configuration file:
/etc/google-cloud-sap-agent/configuration.json
Alternatively, you can also perform this configuration by running commands. For more information, see Configuration commands for Google Cloud's Agent for SAP.
In the
hana_monitoring_configurationsection, perform the following:- For the parameter
enabled, set the valuetrue. - In the
hana_instancessection, specify the SAP HANA instances that you want the agent to monitor. - Optionally, define custom queries. For information about defining custom queries and see examples, see Defining custom queries.
Optionally, disable the built-in or default queries. For instructions, see Disable a SQL query.
For information about the configuration parameters, see Configuration parameters.
- For the parameter
Optionally, under the
cloud_propertiessection, you can update the parameter values that are set automatically. To do so, add thecloud_propertiessection to your configuration file, and then specify the required parameters and their values.Save the configuration file.
Restart the agent for the new settings to take effect:
sudo systemctl restart google-cloud-sap-agent
Example configuration files
Compute Engine instance
The following examples are completed configuration files of
Google Cloud's Agent for SAP running on a
Compute Engine instance,
where the collection of SAP HANA monitoring metrics is enabled. Note that the
custom query included in these examples, named custom_query,
follows the custom query definition guidelines specified in
Defining custom
queries.
The following example uses a
Secure user store (hdbuserstore) key for
SAP HANA authentication:
{
  "provide_sap_host_agent_metrics": true,
  "bare_metal": false,
  "log_level": "INFO",
  "log_to_cloud": true,
  "collection_configuration": {
    "collect_workload_validation_metrics": true,
    "collect_process_metrics": false
  },
  "discovery_configuration": {
    "enable_discovery": true,
    "enable_workload_discovery": true
  },
  "hana_monitoring_configuration": {
    "enabled": true,
    "sample_interval_sec": 60,
    "query_timeout_sec": 30,
    "execution_threads": 20,
    "hana_instances": [
      {
        "name": "local",
        "sid": "DEH",
        "user": "system",
        "hdbuserstore_key": "user_store_key"
      },
      {
        "name": "remote",
        "sid": "DEH",
        "user": "system",
        "hdbuserstore_key": "user_store_key"
      }
    ],
    "queries": [
      {
        "name": "custom_query",
        "enabled": true,
        "sql": "SELECT * FROM MyTable;",
        "columns": [
          {
            "name": "string",
            "metric_type": "METRIC_LABEL",
            "value_type": "VALUE_STRING"
          },
          {
            "name": "bool",
            "metric_type": "METRIC_GAUGE",
            "value_type": "VALUE_BOOL"
          },
          {
            "name": "int",
            "metric_type": "METRIC_GAUGE",
            "value_type": "VALUE_INT64"
          },
          {
            "name": "double",
            "metric_type": "METRIC_GAUGE",
            "value_type": "VALUE_DOUBLE"
          }
        ]
      },
      {
        "name": "default_host_queries",
        "enabled": false
      }
    ]
  }
}
The following example uses a username and Secret Manager secret for SAP HANA authentication:
{
  "provide_sap_host_agent_metrics": true,
  "bare_metal": false,
  "log_level": "INFO",
  "log_to_cloud": true,
  "collection_configuration": {
    "collect_workload_validation_metrics": true,
    "collect_process_metrics": false
  },
  "discovery_configuration": {
    "enable_discovery": true,
    "enable_workload_discovery": true
  },
  "hana_monitoring_configuration": {
    "enabled": true,
    "sample_interval_sec": 60,
    "query_timeout_sec": 30,
    "execution_threads": 20,
    "hana_instances": [
      {
        "name": "local",
        "sid": "DEH",
        "host": "localhost",
        "port": "30015",
        "user": "system",
        "secret_name": "password-secret-name"
      },
      {
        "name": "remote",
        "sid": "DEH",
        "host": "10.123.0.12",
        "port": "30015",
        "user": "system",
        "secret_name": "password-secret-name"
      }
    ],
    "queries": [
      {
        "name": "custom_query",
        "enabled": true,
        "sql": "SELECT * FROM MyTable;",
        "columns": [
          {
            "name": "string",
            "metric_type": "METRIC_LABEL",
            "value_type": "VALUE_STRING"
          },
          {
            "name": "bool",
            "metric_type": "METRIC_GAUGE",
            "value_type": "VALUE_BOOL"
          },
          {
            "name": "int",
            "metric_type": "METRIC_GAUGE",
            "value_type": "VALUE_INT64"
          },
          {
            "name": "double",
            "metric_type": "METRIC_GAUGE",
            "value_type": "VALUE_DOUBLE"
          }
        ]
      },
      {
        "name": "default_host_queries",
        "enabled": false
      }
    ]
  }
}
The following example uses a username and password for SAP HANA
authentication. We recommend that you instead use a
Secret Manager secret or
Secure user store (hdbuserstore) key for
SAP HANA authentication.
{
  "provide_sap_host_agent_metrics": true,
  "bare_metal": false,
  "log_level": "INFO",
  "log_to_cloud": true,
  "collection_configuration": {
    "collect_workload_validation_metrics": true,
    "collect_process_metrics": false
  },
  "discovery_configuration": {
    "enable_discovery": true,
    "enable_workload_discovery": true
  },
  "hana_monitoring_configuration": {
    "enabled": true,
    "sample_interval_sec": 60,
    "query_timeout_sec": 30,
    "execution_threads": 20,
    "hana_instances": [
      {
        "name": "local",
        "sid": "DEH",
        "host": "localhost",
        "port": "30015",
        "user": "system",
        "password": "TempPa55word"
      },
      {
        "name": "remote",
        "sid": "DEH",
        "host": "10.123.0.12",
        "port": "30015",
        "user": "system",
        "password": "TempPa55word"
      }
    ],
    "queries": [
      {
        "name": "custom_query",
        "enabled": true,
        "sql": "SELECT * FROM MyTable;",
        "columns": [
          {
            "name": "string",
            "metric_type": "METRIC_LABEL",
            "value_type": "VALUE_STRING"
          },
          {
            "name": "bool",
            "metric_type": "METRIC_GAUGE",
            "value_type": "VALUE_BOOL"
          },
          {
            "name": "int",
            "metric_type": "METRIC_GAUGE",
            "value_type": "VALUE_INT64"
          },
          {
            "name": "double",
            "metric_type": "METRIC_GAUGE",
            "value_type": "VALUE_DOUBLE"
          }
        ]
      },
      {
        "name": "default_host_queries",
        "enabled": false
      }
    ]
  }
}
Bare Metal Solution server
The following examples are completed configuration files of
Google Cloud's Agent for SAP running on a
Bare Metal Solution server,
where the collection of SAP HANA monitoring metrics is enabled. Note that the
custom query included in these examples, named custom_query,
follows the custom query definition guidelines specified in
Defining custom
queries.
The following example uses a
Secure user store (hdbuserstore) key for
SAP HANA authentication:
{
  "provide_sap_host_agent_metrics": true,
  "bare_metal": true,
  "log_level": "INFO",
  "log_to_cloud": true,
  "collection_configuration": {
    "collect_workload_validation_metrics": true,
    "collect_process_metrics": false
  },
  "cloud_properties": {
    "project_id": "my-project",
    "instance_name": "bms-machine-1",
    "region": "us-central1",
    "image": "rhel-8"
  },
  "discovery_configuration": {
    "enable_discovery": true,
    "enable_workload_discovery": true
  },
  "hana_monitoring_configuration": {
    "enabled": true,
    "sample_interval_sec": 60,
    "query_timeout_sec": 30,
    "execution_threads": 20,
    "hana_instances": [
      {
        "name": "local",
        "sid": "DEH",
        "user": "system",
        "hdbuserstore_key": "user_store_key"
      },
      {
        "name": "remote",
        "sid": "DEH",
        "user": "system",
        "hdbuserstore_key": "user_store_key"
      }
    ],
    "queries": [
      {
        "name": "custom_query",
        "enabled": true,
        "sql": "SELECT * FROM MyTable;",
        "columns": [
          {
            "name": "string",
            "metric_type": "METRIC_LABEL",
            "value_type": "VALUE_STRING"
          },
          {
            "name": "bool",
            "metric_type": "METRIC_GAUGE",
            "value_type": "VALUE_BOOL"
          },
          {
            "name": "int",
            "metric_type": "METRIC_GAUGE",
            "value_type": "VALUE_INT64"
          },
          {
            "name": "double",
            "metric_type": "METRIC_GAUGE",
            "value_type": "VALUE_DOUBLE"
          }
        ]
      },
      {
        "name": "default_host_queries",
        "enabled": false
      }
    ]
  }
}
The following example uses a username and Secret Manager secret for SAP HANA authentication:
{
  "provide_sap_host_agent_metrics": true,
  "bare_metal": true,
  "log_level": "INFO",
  "log_to_cloud": true,
  "collection_configuration": {
    "collect_workload_validation_metrics": true,
    "collect_process_metrics": false
  },
  "cloud_properties": {
    "project_id": "my-project",
    "instance_name": "bms-machine-1",
    "region": "us-central1",
    "image": "rhel-8"
  },
  "discovery_configuration": {
    "enable_discovery": true,
    "enable_workload_discovery": true
  },
  "hana_monitoring_configuration": {
    "enabled": true,
    "sample_interval_sec": 60,
    "query_timeout_sec": 30,
    "execution_threads": 20,
    "hana_instances": [
      {
        "name": "local",
        "sid": "DEH",
        "host": "localhost",
        "port": "30015",
        "user": "system",
        "secret_name": "password-secret-name"
      },
      {
        "name": "remote",
        "sid": "DEH",
        "host": "10.123.0.12",
        "port": "30015",
        "user": "system",
        "secret_name": "password-secret-name"
      }
    ],
    "queries": [
      {
        "name": "custom_query",
        "enabled": true,
        "sql": "SELECT * FROM MyTable;",
        "columns": [
          {
            "name": "string",
            "metric_type": "METRIC_LABEL",
            "value_type": "VALUE_STRING"
          },
          {
            "name": "bool",
            "metric_type": "METRIC_GAUGE",
            "value_type": "VALUE_BOOL"
          },
          {
            "name": "int",
            "metric_type": "METRIC_GAUGE",
            "value_type": "VALUE_INT64"
          },
          {
            "name": "double",
            "metric_type": "METRIC_GAUGE",
            "value_type": "VALUE_DOUBLE"
          }
        ]
      },
      {
        "name": "default_host_queries",
        "enabled": false
      }
    ]
  }
}
The following example uses a username and password for SAP HANA
authentication. We recommend that you instead use a
Secret Manager secret or
Secure user store (hdbuserstore) key for
SAP HANA authentication.
{
  "provide_sap_host_agent_metrics": true,
  "bare_metal": true,
  "log_level": "INFO",
  "log_to_cloud": true,
  "collection_configuration": {
    "collect_workload_validation_metrics": true,
    "collect_process_metrics": false
  },
  "cloud_properties": {
    "project_id": "my-project",
    "instance_name": "bms-machine-1",
    "region": "us-central1",
    "image": "rhel-8"
  },
  "discovery_configuration": {
    "enable_discovery": true,
    "enable_workload_discovery": true
  },
  "hana_monitoring_configuration": {
    "enabled": true,
    "sample_interval_sec": 60,
    "query_timeout_sec": 30,
    "execution_threads": 20,
    "hana_instances": [
      {
        "name": "local",
        "sid": "DEH",
        "host": "localhost",
        "port": "30015",
        "user": "system",
        "password": "TempPa55word"
      },
      {
        "name": "remote",
        "sid": "DEH",
        "host": "10.123.0.12",
        "port": "30015",
        "user": "system",
        "password": "TempPa55word"
      }
    ],
    "queries": [
      {
        "name": "custom_query",
        "enabled": true,
        "sql": "SELECT * FROM MyTable;",
        "columns": [
          {
            "name": "string",
            "metric_type": "METRIC_LABEL",
            "value_type": "VALUE_STRING"
          },
          {
            "name": "bool",
            "metric_type": "METRIC_GAUGE",
            "value_type": "VALUE_BOOL"
          },
          {
            "name": "int",
            "metric_type": "METRIC_GAUGE",
            "value_type": "VALUE_INT64"
          },
          {
            "name": "double",
            "metric_type": "METRIC_GAUGE",
            "value_type": "VALUE_DOUBLE"
          }
        ]
      },
      {
        "name": "default_host_queries",
        "enabled": false
      }
    ]
  }
}
Define a custom SQL query
Google Cloud's Agent for SAP collects the SAP HANA monitoring metrics by running SQL queries on your SAP HANA instances. In addition to these default queries, you can define and run custom SQL queries by completing the following steps:
Establish an SSH connection with your Compute Engine instance or Bare Metal Solution server.
Open the agent's configuration file:
/etc/google-cloud-sap-agent/configuration.json
Under the
hana_monitoring_configuration.queriessection, define your custom query.For information about defining custom queries and see examples, see Defining custom queries.
To enable a custom query, set its
enabledparameter totrue.If you're using version 3.7 of the agent, then for SAP HANA HA systems deployed with the Active/Active (Read Enabled) configuration, you can specify if the query is to be run on the primary, secondary, or both nodes of your HA system:
- To run a query on the primary node, include
"run_on": "PRIMARY". - To run a query on the primary node, include
"run_on": "SECONDARY". - To run a query on the primary node, include
"run_on": "ALL".
For more information, see Set up node-specific monitoring for an SAP HANA HA system.
- To run a query on the primary node, include
Save the configuration file.
Restart the agent for the new settings to take effect:
sudo systemctl restart google-cloud-sap-agent
Disable a SQL query
If you don't want to run any of the built-in SQL queries that Google Cloud's Agent for SAP provides by default, or any of the custom queries that you define, then you can disable the SQL query by completing the following steps:
Establish an SSH connection with your Compute Engine instance or Bare Metal Solution server.
Open the agent's configuration file:
/etc/google-cloud-sap-agent/configuration.json
To disable a built-in or default query, include the following under the
hana_monitoring_configuration.queriessection:{ "name": "default_QUERY_NAME", "enabled": false }Replace
QUERY_NAMEwith the name of the default query. For information about the default queries, see Default query reference.To disable a custom query, set the
enabledparameter tofalsefor that custom query.Save the configuration file.
Restart the agent for the new settings to take effect:
sudo systemctl restart google-cloud-sap-agent
Set up tenant-specific monitoring for a multi-tenant SAP HANA database
From version 3.7 of Google Cloud's Agent for SAP, you can set up tenant-specific monitoring for multi-tenant SAP HANA databases. To do this, complete the following steps:
- Make sure that you're using version 3.7 or later of Google Cloud's Agent for SAP.
- Establish an SSH connection with your Compute Engine instance or Bare Metal Solution server.
Open the agent's configuration file:
/etc/google-cloud-sap-agent/configuration.json
In the
hana_monitoring_configuring.hana_instancessection, for each SAP HANA that you've defined, apply the appropriate configuration:- To run a specific set of queries on an SAP HANA instance, include the
queries_to_run.query_nameparameter as follows. - To run all queries on an SAP HANA instance, include
queries_to_run.run_allparameter as follows.
The following snippet shows examples of these options:
"hana_monitoring_configuration": { "enabled": true, ... "hana_instances": [ { "name": "TENANT_DB_1_NAME", "sid": "SID", ... "queries_to_run": { "query_name": ["QUERY_NAME_1", "QUERY_NAME_2", ...] } }, { "name": "TENANT_DB_2_NAME", "sid": "SID", ... "queries_to_run": { "run_all": true } } ... ] }- To run a specific set of queries on an SAP HANA instance, include the
Save the configuration file.
Within the next 30 seconds, the new configuration takes effect. Alternatively, you can manually restart the agent.
Set up node-specific monitoring for an SAP HANA HA system
From version 3.7 of Google Cloud's Agent for SAP, for SAP HANA HA systems deployed with the Active/Active (Read Enabled) configuration, you can specify if the queries defined in your agent's configuration file are to be run on the primary node, the secondary node, or both. To do this, complete the following steps:
- Make sure that you're using version 3.7 or later of Google Cloud's Agent for SAP.
- Establish an SSH connection with your Compute Engine instance or Bare Metal Solution server.
Open the agent's configuration file:
/etc/google-cloud-sap-agent/configuration.json
In the
hana_monitoring_configuring.queriessection, for each query that you've defined, apply the appropriate configuration:- To run a query on the primary node, include
"run_on": "PRIMARY". - To run a query on the primary node, include
"run_on": "SECONDARY". - To run a query on the primary node, include
"run_on": "ALL".
- To run a query on the primary node, include
In the
hana_monitoring_configuration.hana_instancessection, for each SAP HANA instance that you've defined, specify theinstance_numandis_localparameters.The following snippet shows examples of all scenarios:
 "hana_monitoring_configuration": {
   "enabled": true,
   ...
   "hana_instances": [
     {
        "name": "INSTANCE_NAME",
        "sid": "SID",
        "instance_num": "10",
        "is_local": true,
        "hdbuserstore_key": "USER_STORE_KEY"
     },
     {
        "name": "INSTANCE_NAME",
        "sid": "SID",
        "instance_num": "11"
        "is_local": true,
        "hdbuserstore_key": "USER_STORE_KEY"
     },
     ...
   ],
   ...
   "queries": [
     {
        "name": "QUERY_NAME_1",
        "enabled": true,
        "run_on": "PRIMARY",
        ...
     },
     {
        "name": "QUERY_NAME_2",
        "enabled": true,
        "run_on": "SECONDARY",
        ...
     },
     {
        "name": "QUERY_NAME_3",
        "enabled": true,
        "run_on": "ALL",
        ...
     }
     ...
   ]
 }
Save the configuration file.
Within the next 30 seconds, the new configuration takes effect. Alternatively, you can manually restart the agent.
Configuration parameters
The following table explains the configuration parameters of Google Cloud's Agent for SAP that are specific to the collection of the SAP HANA Monitoring metrics.
| Parameters | |
|---|---|
provide_sap_host_agent_metrics |
To enable the collection of the metrics required by the
SAP Host Agent, specify |
bare_metal |
When the agent is installed on a Bare Metal Solution server, specify
|
log_level |
To set the logging level of the agent, set the required value. The available log levels are as follows:
Default is |
log_to_cloud |
To redirect the agent's logs to
Cloud Logging, specify
|
cloud_properties.project_id |
If your SAP system is running on a Bare Metal Solution server, then
specify the project ID of the Google Cloud project that you are
using with Bare Metal Solution. |
cloud_properties.instance_name
|
If your SAP system is running on a Compute Engine instance, then specify the name that compute instance. The agent automatically detects the compute instance name upon installation. If your SAP system is running on a Bare Metal Solution server, then specify the name of that server. |
cloud_properties.region |
If your SAP system is running on a Bare Metal Solution server,
then specify the region of the Bare Metal Solution server. |
cloud_properties.zone |
When the agent runs on a compute instance, by default, the agent uses the zone where the compute instance is deployed. |
cloud_properties.image |
Specify the OS image name of the instance. |
cloud_properties.numeric_project_id |
Specify the numeric ID of the Google Cloud project where the SAP system
is running. |
discovery_configuration.enable_workload_discovery |
To let the agent collect the names and versions of the SAP products
running on the host, specify For more information, see the agent's codebase in the
|
discovery_configuration.enable_discovery |
To send to Cloud Logging the information that the agent collects about
the SAP products running on the host, specify If you specify the value |
hana_monitoring_configuration.enabled |
Optional. To enable Google Cloud's Agent for SAP to collect the SAP HANA
monitoring metrics, specify hana_monitoring_configuration.enabled: true.
|
hana_monitoring_configuration.sample_interval_sec |
Optional. Specify the sample interval, in seconds, which determines the frequency at which Google Cloud's Agent for SAP queries your SAP HANA instances to collect the SAP HANA monitoring metrics. The default value is 300 seconds. For each query defined in the configuration file of
Google Cloud's Agent for SAP, you can overwrite the global sample interval
by specifying the required interval to the parameter
|
hana_monitoring_configuration.query_timeout_sec |
Optional. Specify the timeout for each query made to the SAP HANA instances. The default value is 300 seconds. |
hana_monitoring_configuration.execution_threads |
Optional. Specify the number of threads used to send queries to the SAP HANA instances. Each query runs on its own thread. The default value is 10. |
hana_monitoring_configuration.send_query_response_time |
Optional. Specify |
hana_monitoring_configuration.hana_instances.name |
Specify the name identifier for your SAP HANA instance. |
hana_monitoring_configuration.hana_instances.sid |
Specify the SID of your SAP HANA instance. This string is added as a label to all the metrics resulting from querying your SAP HANA instances. |
hana_monitoring_configuration.hana_instances.host |
Specify the identifier for the machine, either local or remote, that hosts your SAP HANA instance. The following are the supported values:
|
hana_monitoring_configuration.hana_instances.port |
Specify the port on which your SAP HANA instance accepts queries. For
the first or only tenant database instance, the port is
|
hana_monitoring_configuration.hana_instances.user |
Specify the user account that is used to query the SAP HANA instance. Make sure that this user has the privilege to read the monitoring views in your SAP HANA database. If this privilege is not granted, then the SAP HANA monitoring metrics related to the monitoring views contain no data. |
hana_monitoring_configuration.hana_instances.password |
Optional. Specify the password, as plain text, that authenticates the user account for querying the SAP HANA instance. For authentication, you must specify one of the following:
For SAP HANA authentication, the agent uses the following order of
preference: if specified, the |
hana_monitoring_configuration.hana_instances.secret_name |
Optional. Specify the name of the secret in Secret Manager that stores the user account's password. For SAP HANA authentication, the agent uses the following order of
preference: if specified, the |
hana_monitoring_configuration.hana_instances.hdbuserstore_key
|
To securely connect to an SAP HANA system, specify a
Secure user store ( To use an
This configuration parameter is supported from version 3.3 of the agent. If you specify |
hana_monitoring_configuration.hana_instances.is_local
|
For monitoring HA systems, specify The default value for this parameter is This parameter is supported from version 3.7 of the agent. |
hana_monitoring_configuration.hana_instances.instance_num
|
Specify the instance number that you've set for your SAP HANA instance. This information is required for the agent to discover your SAP HANA instance. This parameter is supported from version 3.7 of the agent. |
hana_monitoring_configuration.hana_instances.queries_to_run.run_all
|
Optional. Specify |
hana_monitoring_configuration.hana_instances.queries_to_run.query_name
|
Optional. Specify the queries that you want to run on the specified SAP HANA instance. If you're running a multi-tenant SAP HANA database, then you can set up
tenant specific monitoring by using this configuration parameter. In the
following example configuration, two queries are run on
    "hana_instances": [
      {
        "name": "HANA_TENANT_1,
        "queries_to_run": {
          "query_name": ["QUERY_NAME_1", "QUERY_NAME_2"]
        }
      },
      {
        "name": "HANA_TENANT_2,
        "queries_to_run": {
          "run_all": true
        }
      }
      ...
] |
hana_monitoring_configuration.hana_instances.enable_ssl |
Optional. Specifies whether or not SSL is enabled in your SAP HANA
instance. The default value is |
hana_monitoring_configuration.hana_instances.host_name_in_certificate |
If you specify |
hana_monitoring_configuration.hana_instances.tls_root_ca_file |
If you specify |
hana_monitoring_configuration.queries.enabled |
Optional. To enable a SQL query for all your SAP HANA instances,
specify the value |
hana_monitoring_configuration.queries.name |
If you have defined custom queries in your configuration file, then you must specify a unique name for each custom query. The query name must be unique because it is used to build the metric's default URL in Monitoring. |
hana_monitoring_configuration.queries.run_on |
Optional. Specify this parameter if you're monitoring an SAP HANA HA
system and want to run the SAP HANA monitoring queries on either the
primary or the secondary node. Supported values: This parameter is supported from version 3.7 of the agent. Also, to run the queries on the secondary node, make sure that your HA system is deployed with the Active/Active (Read Enabled) configuration. |
hana_monitoring_configuration.queries.sql |
Specify the SQL statement that the agent issues to your SAP HANA instances. The SQL statement must conform to the SQL syntax defined by SAP in SAP HANA SQL and System Views Reference. |
hana_monitoring_configuration.queries.sample_interval_sec |
Optional. Specify the sample interval for the SQL query. This overrides the global sample interval. The value must be 5 seconds or longer. |
hana_monitoring_configuration.queries.columns.name |
Specify a name that uniquely identifies each column. The column name must be unique because it is used to build the metric's default URL in Monitoring. |
hana_monitoring_configuration.queries.columns.metric_type |
For handling by Monitoring, specify one of the following
metric types: Metrics of type |
hana_monitoring_configuration.queries.columns.value_type |
For handling by Monitoring, specify a data type that is supported by the metric type. The supported data types are as follows: |
hana_monitoring_configuration.queries.columns.name_override |
Optional. For handling by Monitoring, specify the path that you want to show in the metric URL instead of the query and column names. For example:
|
Validate the setup for SAP HANA monitoring metrics collection
You can validate if you have the correct Google Cloud setup for the collection of the
SAP HANA Monitoring metrics by running the agent's status command. This
command is supported from version 3.7 of the agent.
To do this, complete the following steps:
- Establish an SSH connection with your Compute Engine instance or Bare Metal Solution server.
Run the following command:
sudo /usr/bin/google_cloud_sap_agent statusIf your Google Cloud setup for SAP HANA Monitoring metrics collection is correct, then the output includes the following. Your configuration might have values other than the
defaultones.Agent Status: ... Systemd Service Enabled: True Systemd Service Running: True Cloud API Full Scopes: True Configuration File: /etc/google-cloud-sap-agent/configuration.json Configuration Valid: True ... ---------------------------------------------------------------------------- HANA Monitoring Metrics: Enabled Status: Fully Functional IAM Permissions: All granted Configuration: connection_timeout: 120 (default) enabled: true (configuration file) execution_threads: 10 (default) max_connect_retries: 1 (default) query_timeout_sec: 300 (default) sample_interval_sec: 300 (default) send_query_response_time: false (default) ...If your output conveys that some setup is missing, then review the information provided in the preceding sections, perform the required actions, and then re-run the
statuscommand to re-validate the setup.
View the collected metrics
To visualize the SAP HANA Monitoring metrics that the agent collects, you can use the following custom dashboards that Google Cloud provides:
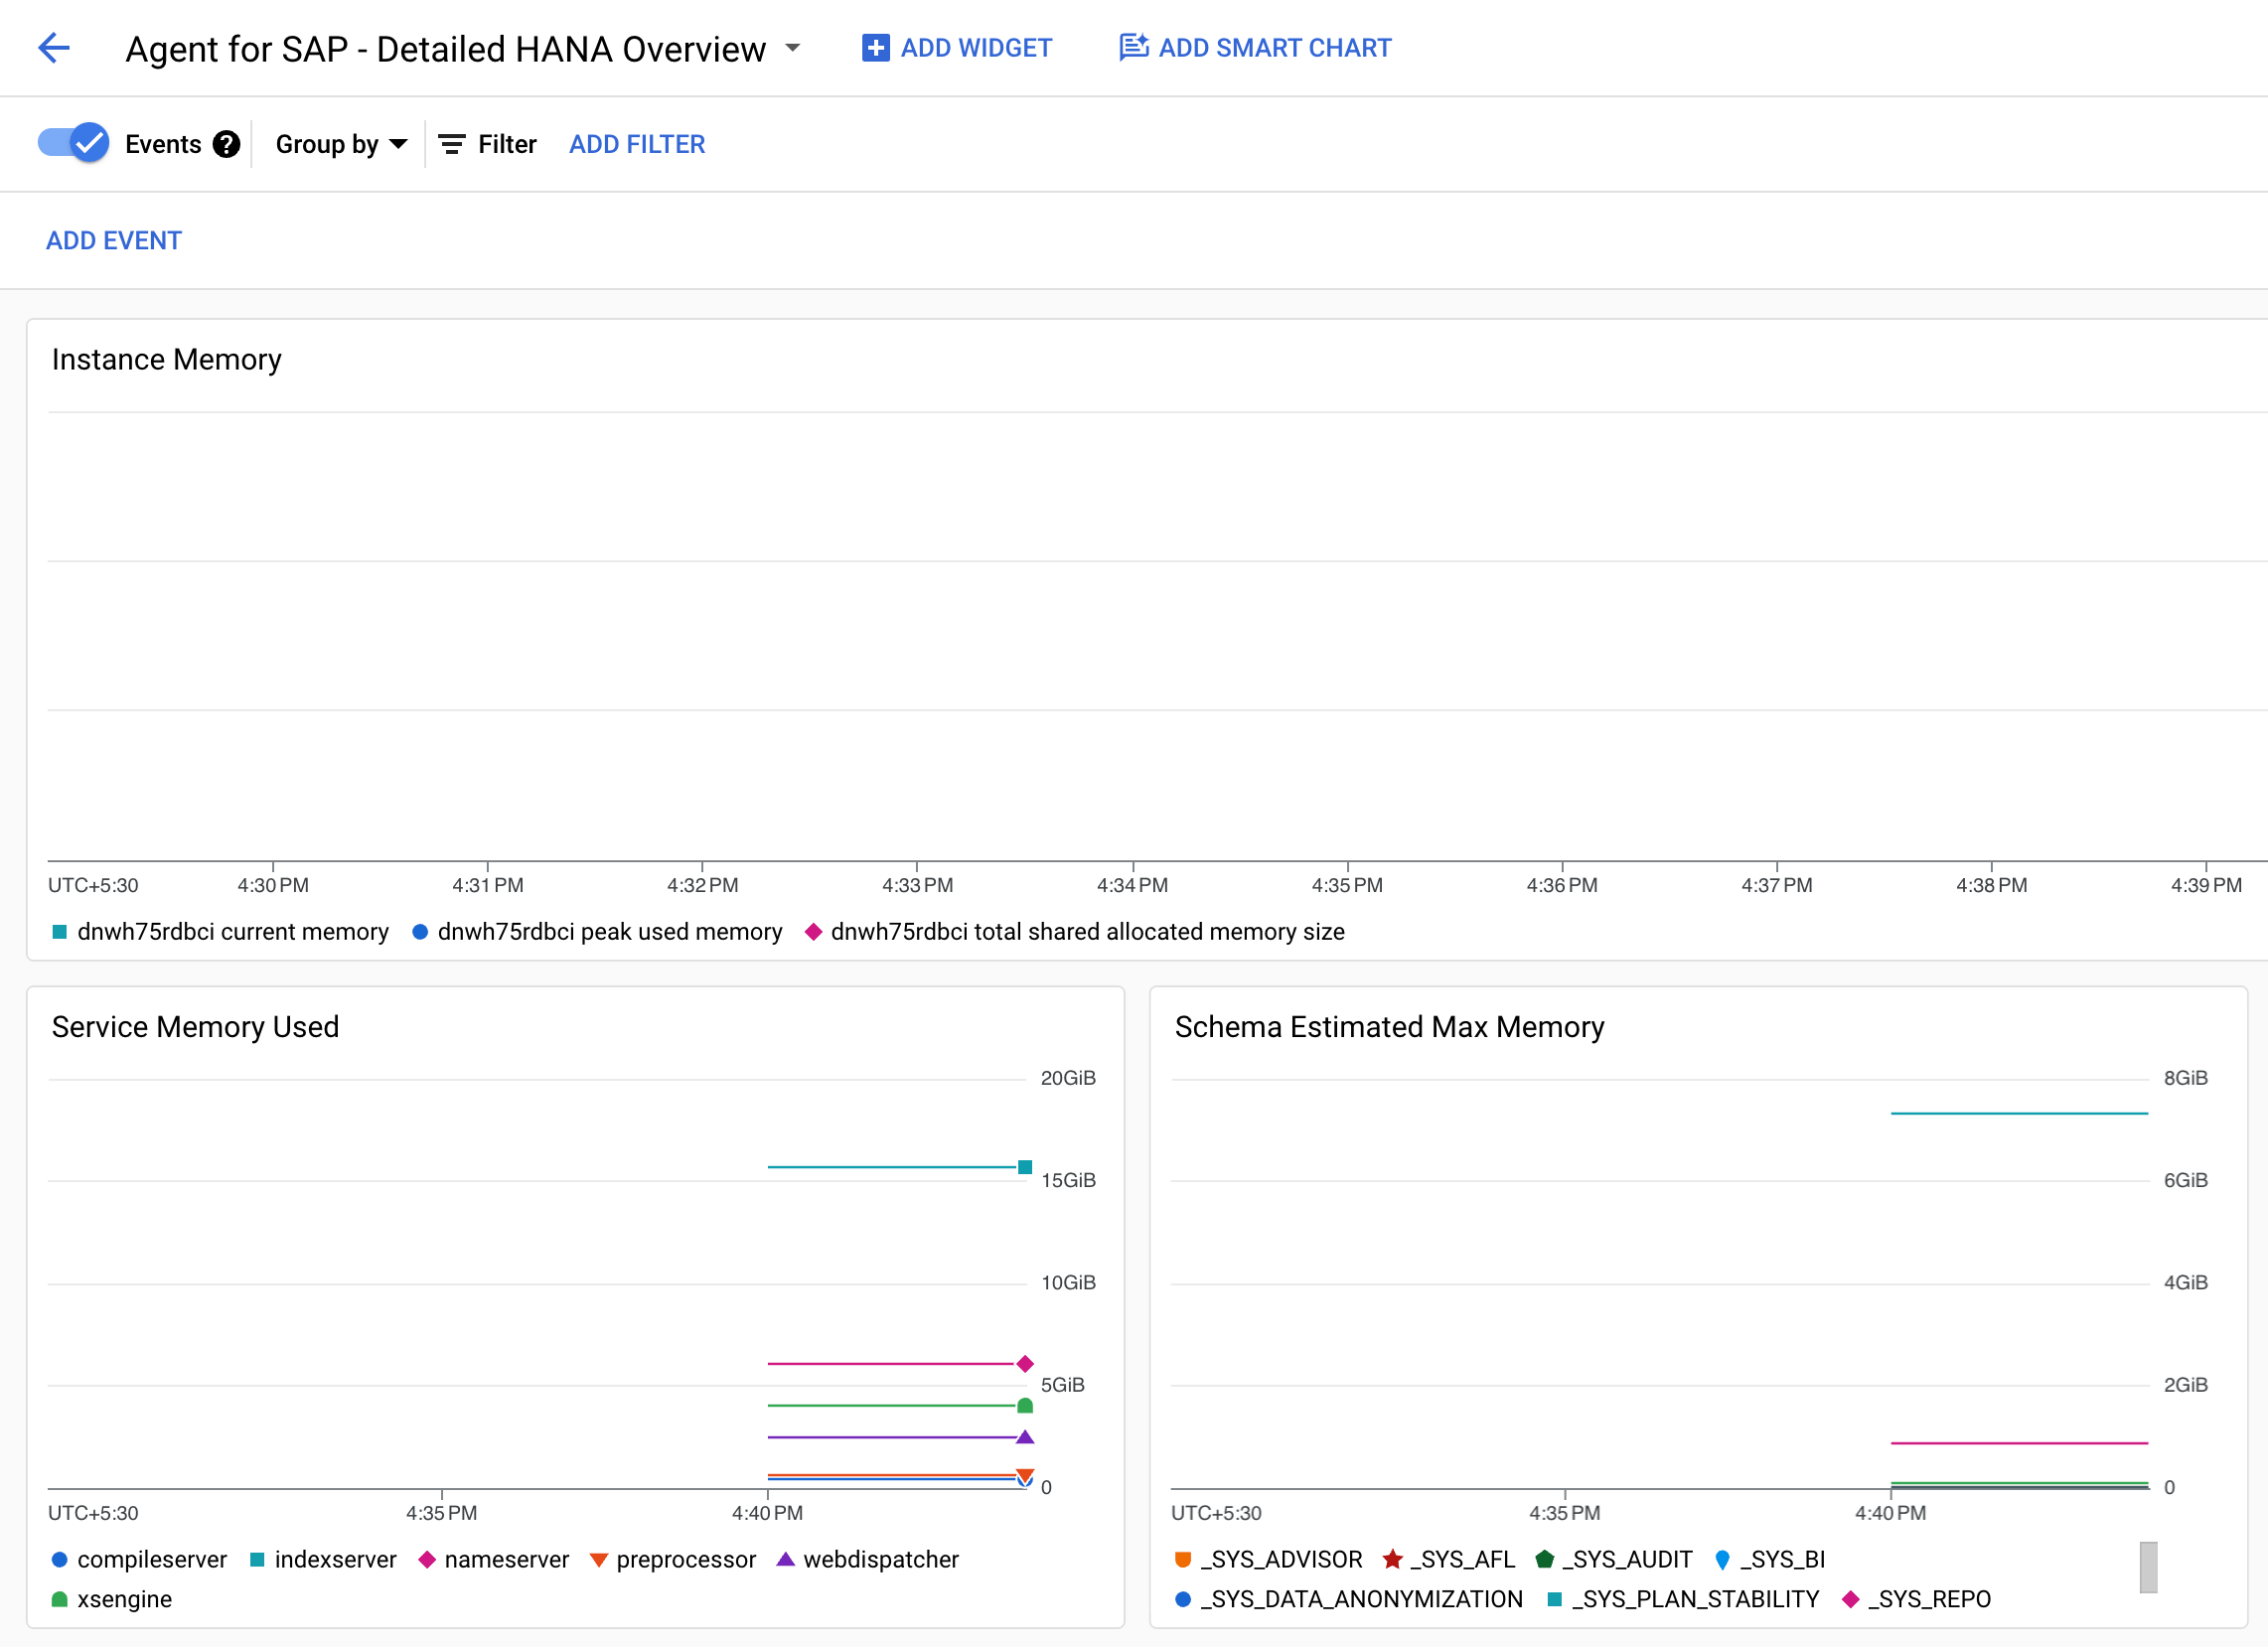
Agent for SAP - Detailed HANA Overview: This dashboard provides charts that display status overview for the following metrics: Instance memory, service memory used, schema estimated maximum memory, rowstore memory total size, schema read outliers, schema write outliers, schema last compressed record count outliers, system connections, alerts, CPU percentage for the top 5 compute instances, memory percentage for the top 5 compute instances, and the hosts by region.
The JSON file for this dashboard is
agent-for-sap-hana-detailed-overview.json.Agent for SAP - HANA performance: This dashboard provides charts that display raw metric values for the following metrics: Instance memory, schema read and write outliers, schema performance, memory usage, schema record count outliers, service total memory used, rowstore memory size, system idle and running connections, connection and rowstore memory, schema total records, and the schema estimated maximum total size.
The JSON file for this dashboard is
agent-for-sap-hana-performance.json.
Install dashboards
To install a custom dashboard, complete the following steps:
Google Cloud console
In the Google Cloud console, go to the Monitoring page:
In the Monitoring navigation panel, click Dashboards.
Click the Sample library tab.
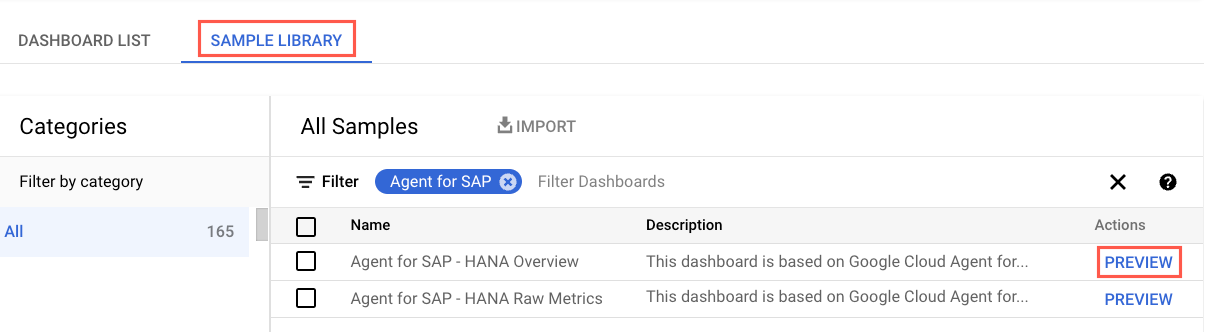
To filter the agent-specific custom dashboards, in the Filter field, type
Agent for SAP.(Optional) To view details about a dashboard or to preview its contents, click Preview.
Select the dashboard that you want to install.
Click Import, and then click Confirm.
The dashboard is added to the available dashboards in your Google Cloud project. To see your dashboard, follow the instructions in View the installed dashboard.
Google Cloud CLI
Open the Cloud Shell:
In the Cloud Shell, clone or download the repository:
git clone https://github.com/GoogleCloudPlatform/monitoring-dashboard-samples/
In the Cloud Shell, install the required dashboard using the corresponding JSON file:
gcloud monitoring dashboards create --config-from-file=CONFIG_FROM_FILE
Replace
CONFIG_FROM_FILEwith the path to the JSON file that contains the dashboard configuration. Dashboard configuration files can be located at path:monitoring-dashboard-samples/dashboards/google-cloud-agent-for-sap.The dashboard is added to the available dashboards in your Google Cloud project. To see your dashboard, follow the instructions in View the installed dashboard.
View the installed dashboards
To view the installed dashboards, follow these steps:
In the Google Cloud console, go to the Monitoring page:
In the Monitoring navigation panel, click Dashboards.
Click the dashboard name in the list.
If you have a lot of dashboards, then you can filter for custom dashboards or for the name of the new dashboard. For information on filtering this list, see View custom dashboards.
The following image is an example that shows a part of the custom dashboard for SAP HANA metrics in Monitoring.