When an application is rewritten to use microservices, the number of components and endpoints that are involved in a single user transaction increases. Therefore, observability is critical in order to operate user services reliably. This reference architecture shows how to capture trace information on microservice applications using OpenTelemetry and Cloud Trace.
This document is intended for developers, SREs, and DevOps engineers who want to understand the fundamentals of distributed tracing and who want to apply those principles to their services to improve service observability.
Architecture
The following diagram shows the architecture of an application that implements this architecture.

As illustrated in the preceding diagram, this architecture includes two GKE clusters. You deploy an application to each of the clusters. User traffic is sent to the frontend application on the frontend cluster. The frontend pod on the frontend cluster communicates to the backend pod on the backend cluster. The backend pod calls an external API endpoint.
Observability data is exported to Cloud Trace, which tracks how requests propagate through the applications.
Design considerations
For services that run on Kubernetes, you can use a service mesh like Istio to enable distributed tracing of service-to-service traffic without the need for dedicated instrumentation. However, you might have any of the following requirements:
- You want to have more control over the traces than what Istio provides.
- You might need to capture application internals in the trace information.
- You might need to trace code that's not running on Kubernetes.
For these use cases, you can use OpenTelemetry, which is an open source library that can add instrumentation to distributed microservice applications to collect traces, metrics, and logs across a wide variety of languages, platforms, and environments.
Understanding traces, spans, and context
The concept of distributed tracing is described in the Dapper research paper that's published by Google. As described in the paper, the following diagram shows five spans in a trace.
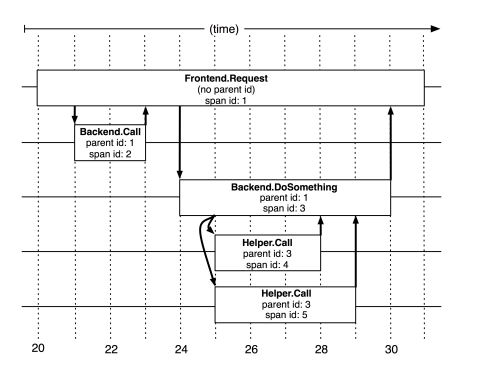
A trace is the total of information that describes how a distributed system responds to a user request. Traces are composed of spans, where each span represents a specific request and response pair that's involved in serving the user request. The parent span describes the latency as observed by the end user. Each of the child spans describes how a particular service in the distributed system was called and responded to, with latency information captured for each.
The diagram shows a single frontend request that makes two backend requests. The second backend call requires two helper calls to complete. Each call is labeled with its span ID and the ID of the parent span.
A challenge with tracing in distributed systems is that information about the original frontend request isn't automatically or inherently carried forward when subsequent requests are made to various backend services.
With some tools (for example, in the Go language), you can make requests with context—the cluster IP address and credentials. OpenTelemetry extends the concept of context to include span context, meaning that additional information is loaded in the HTTP header. Information about the parent span can then be included with each subsequent request. You can append child spans to compose the overall trace, so you can see how the user request traversed the system and was eventually served back to the user.
Deployment
To deploy this architecture, see Deploy distributed tracing to observe microservice latency.
What's next
- Learn about OpenTelemetry.
- Learn more about the DevOps capabilities that are related to this architecture:
- Take the DevOps quick check to understand where you stand in comparison with the rest of the industry.
- For more reference architectures, diagrams, and best practices, explore the Cloud Architecture Center.