This document describes a reference architecture that helps you create a production-ready, scalable, fault-tolerant, log export mechanism that streams logs and events from your resources in Google Cloud into Splunk. Splunk is a popular analytics tool that offers a unified security and observability platform. In fact, you have the choice of exporting the logging data to either Splunk Enterprise or Splunk Cloud Platform. If you're an administrator, you can also use this architecture for either IT operations or security use cases. To deploy this reference architecture, see Deploy log streaming from Google Cloud to Splunk.
This reference architecture assumes a resource hierarchy that is similar to the following diagram. All the Google Cloud resource logs from the organization, folder, and project levels are gathered into an aggregated sink. Then, the aggregated sink sends these logs to a log export pipeline, which processes the logs and exports them to Splunk.

Architecture
The following diagram shows the reference architecture that you use when you deploy this solution. This diagram demonstrates how log data flows from Google Cloud to Splunk.

This architecture includes the following components:
- Cloud Logging–To start the process, Cloud Logging collects the logs into an organization-level aggregated log sink and sends the logs to Pub/Sub.
- Pub/Sub–The Pub/Sub service then creates a single topic and subscription for the logs and forwards the logs to the main Dataflow pipeline.
- Dataflow–There are two
Dataflow pipelines in this reference architecture:
- Primary Dataflow pipeline–At the center of the process, the main Dataflow pipeline is a Pub/Sub to Splunk streaming pipeline which pulls logs from the Pub/Sub subscription and delivers them to Splunk.
- Secondary Dataflow pipeline–Parallel to the primary Dataflow pipeline, the secondary Dataflow pipeline is a Pub/Sub to Pub/Sub streaming pipeline to replay messages if a delivery fails.
- Splunk–At the end of the process, Splunk Enterprise or Splunk Cloud Platform acts as an HTTP Event Collector (HEC) and receives the logs for further analysis. You can deploy Splunk on-premises, in Google Cloud as SaaS, or through a hybrid approach.
Use case
This reference architecture uses a cloud, push-based approach. In this push-based method, you use the Pub/Sub to Splunk Dataflow template to stream logs to a Splunk HTTP Event Collector (HEC) . The reference architecture also discusses Dataflow pipeline capacity planning and how to handle potential delivery failures when there are transient server or network issues.
While this reference architecture focuses on Google Cloud logs, the same architecture can be used to export other Google Cloud data, such as real-time asset changes and security findings. By integrating logs from Cloud Logging, you can continue to use existing partner services like Splunk as a unified log analytics solution.
The push-based method to stream Google Cloud data into Splunk has the following advantages:
- Managed service. As a managed service, Dataflow maintains the required resources in Google Cloud for data processing tasks such as log export.
- Distributed workload. This method lets you distribute workloads across multiple workers for parallel processing, so there is no single point of failure.
- Security. Because Google Cloud pushes your data to Splunk HEC, there's none of the maintenance and security burden associated with creating and managing service account keys.
- Autoscaling. The Dataflow service autoscales the number of workers in response to variations in incoming log volume and backlog.
- Fault-tolerance. If there are transient server or network issues, the push-based method automatically tries to resend the data to the Splunk HEC. It also supports unprocessed topics (also known as dead-letter topics) for any undeliverable log messages to avoid data loss.
- Simplicity. You avoid the management overhead and the cost of running one or more heavy forwarders in Splunk.
This reference architecture applies to businesses in many different industry verticals, including regulated ones such as pharmaceutical and financial services. When you choose to export your Google Cloud data into Splunk, you might choose to do so for the following reasons:
- Business analytics
- IT operations
- Application performance monitoring
- Security operations
- Compliance
Design alternatives
An alternative method for log export to Splunk is one where you pull logs from Google Cloud. In this pull-based method, you use Google Cloud APIs to fetch the data through the Splunk Add-on for Google Cloud. You might choose to use the pull-based method in the following situations:
- Your Splunk deployment does not offer a Splunk HEC endpoint.
- Your log volume is low.
- You want to export and analyze Cloud Monitoring metrics, Cloud Storage objects, Cloud Resource Manager API metadata, Cloud Billing data, or low-volume logs.
- You already manage one or more heavy forwarders in Splunk.
- You use the hosted Inputs Data Manager for Splunk Cloud.
Also, keep in mind the additional considerations that arise when you use this pull-based method:
- A single worker handles the data ingestion workload, which does not offer autoscaling capabilities.
- In Splunk, the use of a heavy forwarder to pull data might cause a single point of failure.
- The pull-based method requires you to create and manage the service account keys that you use to configure the Splunk Add-on for Google Cloud.
Before using the Splunk Add-on, log entries must first be routed to Pub/Sub using a log sink. To create a log sink with Pub/Sub topic as the destination,
follow these steps. Make
sure to grant the Pub/Sub Publisher role (roles/pubsub.publisher) to the sink's writer identity over that Pub/Sub topic destination. For more
information about configuring sink destination permissions, see Set destination permissions.
To enable the Splunk Add-on, perform the following steps:
- In Splunk, follow the Splunk instructions to install the Splunk Add-on for Google Cloud.
- Create a Pub/Sub pull subscription for the Pub/Sub topic where the logs are routed to, if you do not have one already.
- Create a service account.
- Create a service account key for the service account that you just created.
- Grant the Pub/Sub Viewer (
roles/pubsub.viewer) and Pub/Sub Subscriber (roles/pubsub.subscriber) roles to the service account to let the account receive messages from the Pub/Sub subscription. In Splunk, follow the Splunk instructions to configure a new Pub/Sub input in the Splunk Add-on for Google Cloud.
The Pub/Sub messages from the log export appear in Splunk.
To verify that the add-on is working, perform the following steps:
- In Cloud Monitoring, open Metrics Explorer.
- In the Resources menu, select
pubsub_subscription. - In the Metric categories, select
pubsub/subscription/pull_message_operation_count. - Monitor the number of message-pull operations for one to two minutes.
Design considerations
The following guidelines can help you to develop an architecture that meets your organization's requirements for security, privacy, compliance, operational efficiency, reliability, fault tolerance, performance, and cost optimization.
Security, privacy, and compliance
The following sections describe the security considerations for this reference architecture:
- Use private IP addresses to secure the VMs that support the Dataflow pipeline
- Enable Private Google Access
- Restrict Splunk HEC ingress traffic to known IP addresses used by Cloud NAT
- Store the Splunk HEC token in Secret Manager
- Create a custom Dataflow worker service account to follow least privilege best practices
- Configure SSL validation for an internal root CA certificate if you use a private CA
Use private IP addresses to secure the VMs that support the Dataflow pipeline
You should restrict access to the worker VMs that are used in the Dataflow pipeline. To restrict access, deploy these VMs with private IP addresses. However, these VMs also need to be able to use HTTPS to stream the exported logs into Splunk and access the internet. To provide this HTTPS access, you need a Cloud NAT gateway which automatically allocates Cloud NAT IP addresses to the VMs that need them. Make sure to map the subnet that contains the VMs to the Cloud NAT gateway.
Enable Private Google Access
When you create a Cloud NAT gateway, Private Google Access becomes enabled automatically. However, to allow Dataflow workers with private IP addresses to access the external IP addresses that Google Cloud APIs and services use, you must also manually enable Private Google Access for the subnet.
Restrict Splunk HEC ingress traffic to known IP addresses used by Cloud NAT
If you want to restrict traffic into the Splunk HEC to a subset of known IP addresses, you can reserve static IP addresses and manually assign them to the Cloud NAT gateway. Depending on your Splunk deployment, you can then configure your Splunk HEC ingress firewall rules using these static IP addresses. For more information about Cloud NAT, see Set up and manage network address translation with Cloud NAT.
Store the Splunk HEC token in Secret Manager
When you deploy the Dataflow pipeline, you can pass the token value in one of the following ways:
- Plaintext
- Ciphertext encrypted with a Cloud Key Management Service key
- Secret version encrypted and managed by Secret Manager
In this reference architecture, you use the Secret Manager option because this option offers the least complex and most efficient way to protect your Splunk HEC token. This option also prevents leakage of the Splunk HEC token from the Dataflow console or the job details.
A secret in Secret Manager contains a collection of secret versions. Each secret version stores the actual secret data, such as the Splunk HEC token. If you later choose to rotate your Splunk HEC token as an added security measure, you can add the new token as a new secret version to this secret. For general information about the rotation of secrets, see About rotation schedules.
Create a custom Dataflow worker service account to follow least privilege best practices
Workers in the Dataflow pipeline use the Dataflow worker service account to access resources and execute operations. By default, the workers use your project's Compute Engine default service account as the worker service account, which grants them broad permissions to all resources in your project. However, to run Dataflow jobs in production, we recommend that you create a custom service account with a minimum set of roles and permissions. You can then assign this custom service account to your Dataflow pipeline workers.
The following diagram lists the required roles that you must assign to a service account to enable Dataflow workers to run a Dataflow job successfully.
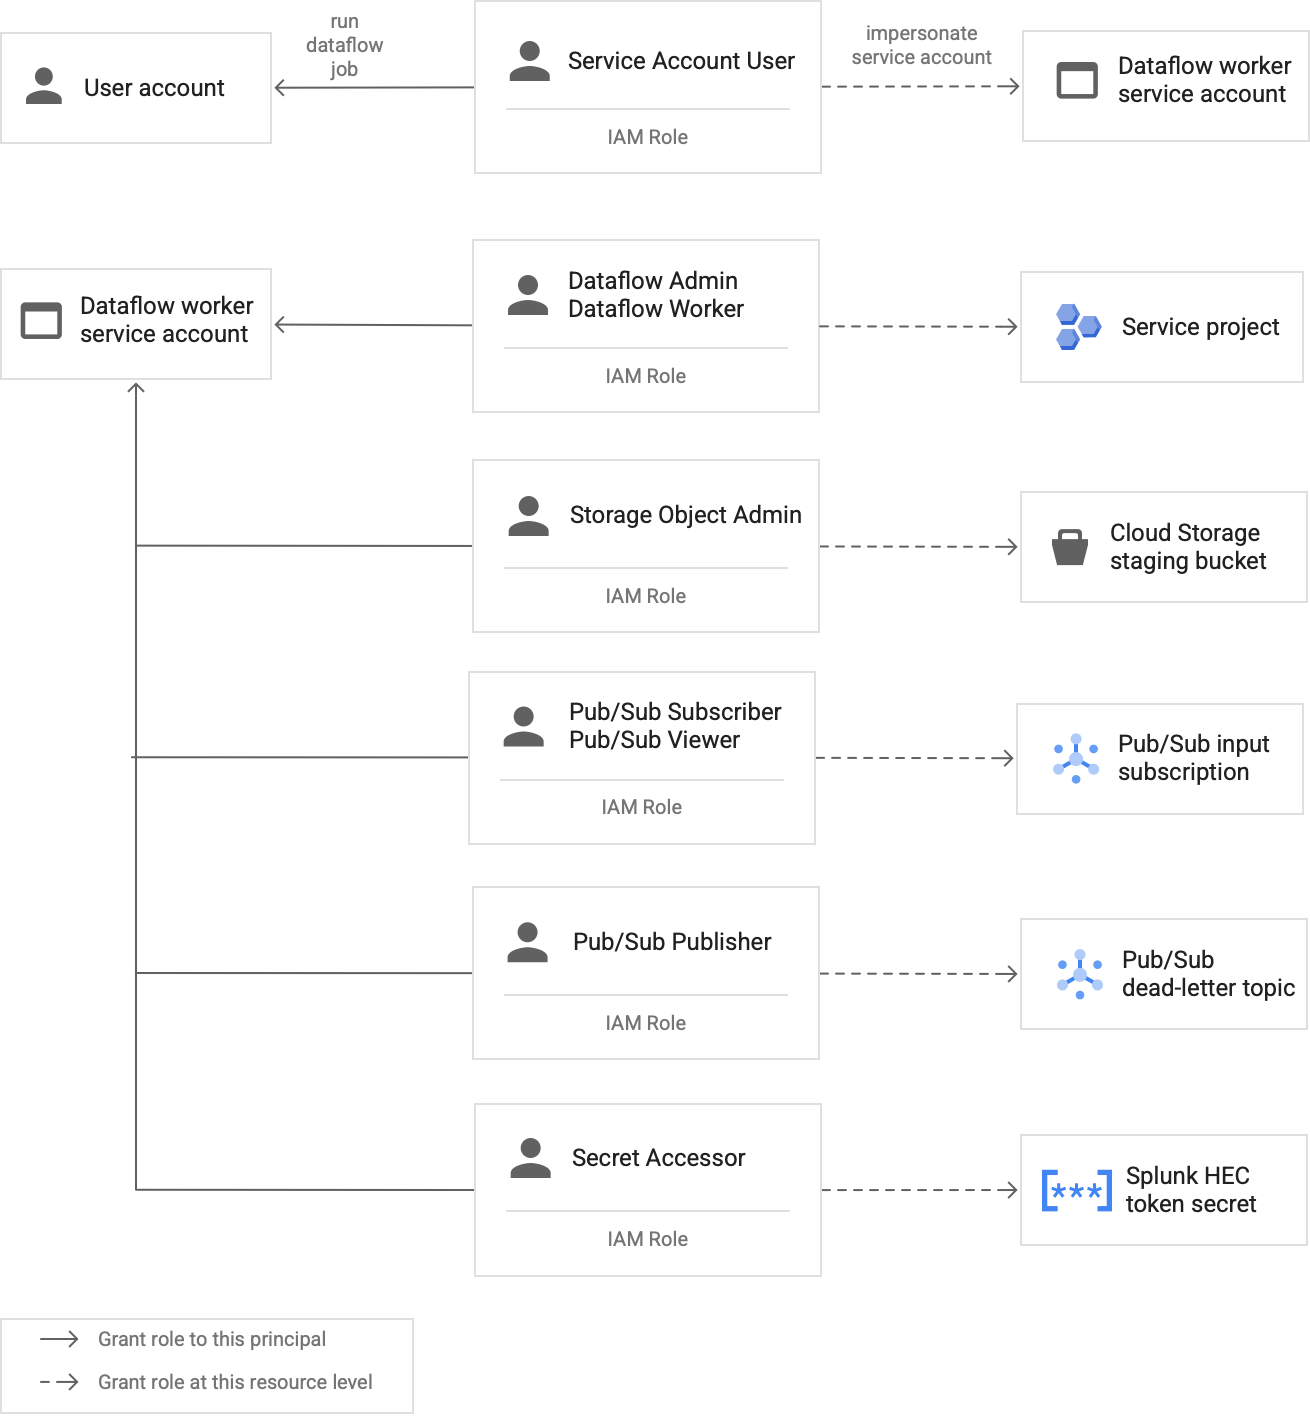
As shown in the diagram, you need to assign the following roles to the service account for your Dataflow worker:
- Dataflow Admin
- Dataflow Worker
- Storage Object Admin
- Pub/Sub Subscriber
- Pub/Sub Viewer
- Pub/Sub Publisher
- Secret Accessor
For more details on the roles that you need to assign to the Dataflow worker service account, see the Grant roles and access to the Dataflow worker service account section of the deployment guide.
Configure SSL validation with an internal root CA certificate if you use a private CA
By default, the Dataflow pipeline uses the Dataflow worker’s default trust store to validate the SSL certificate for your Splunk HEC endpoint. If you use a private certificate authority (CA) to sign an SSL certificate that is used by the Splunk HEC endpoint, you can import your internal root CA certificate into the trust store. The Dataflow workers can then use the imported certificate for SSL certificate validation.
You can use and import your own internal root CA certificate for Splunk deployments with self-signed or privately signed certificates. You can also disable SSL validation entirely for internal development and testing purposes only. This internal root CA method works best for non-internet facing, internal Splunk deployments.
For more information, see the Pub/Sub to Splunk
Dataflow template
parameters
rootCaCertificatePath and disableCertificateValidation.
Operational efficiency
The following sections describe the operational efficiency considerations for this reference architecture:
Use UDF to transform logs or events in-flight
The Pub/Sub to Splunk Dataflow template supports user-defined functions (UDF) for custom event transformation. Example use cases include enriching records with additional fields, redacting some sensitive fields, or filtering out undesired records. UDF enables you to change the Dataflow pipeline's output format without having to re-compile or to maintain the template code itself. This reference architecture uses a UDF to handle messages that the pipeline isn't able to deliver to Splunk.
Replay unprocessed messages
Sometimes, the pipeline receives delivery errors and doesn't try to deliver the message again. In this case, Dataflow sends these unprocessed messages to an unprocessed topic as shown in the following diagram. After you fix the root cause of the delivery failure, you can then replay the unprocessed messages.
The following steps outline the process shown in the previous diagram:
- The main delivery pipeline from Pub/Sub to Splunk automatically forwards undeliverable messages to the unprocessed topic for user investigation.
The operator or site reliability engineer (SRE) investigates the failed messages in the unprocessed subscription. The operator troubleshoots and fixes the root cause of the delivery failure. For example, fixing an HEC token misconfiguration might enable the messages to be delivered.
The operator triggers the replay failed message pipeline. This Pub/Sub to Pub/Sub pipeline (highlighted in the dotted section of the preceding diagram) is a temporary pipeline that moves the failed messages from the unprocessed subscription back to the original log sink topic.
The main delivery pipeline re-processes the previously failed messages. This step requires the pipeline to use the sample UDF for correct detection and decoding of failed messages payloads. The following code shows the part of the function that implements this conditional decoding logic, including a tally of delivery attempts for tracking purposes:
// If the message has already been converted to a Splunk HEC object
// with a stringified obj.event JSON payload, then it's a replay of
// a previously failed delivery.
// Unnest and parse the obj.event. Drop the previously injected
// obj.attributes such as errorMessage and timestamp
if (obj.event) {
 try {
   event = JSON.parse(obj.event);
   redelivery = true;
 } catch(e) {
   event = obj;
 }
} else {
 event = obj;
}

// Keep a tally of delivery attempts
event.delivery_attempt = event.delivery_attempt || 1;
if (redelivery) {
 event.delivery_attempt += 1;
}
Reliability and fault tolerance
In regard to reliability and fault tolerance, the following table, Table 1,
lists some possible Splunk delivery errors. The table also lists the
corresponding errorMessage attributes that the pipeline records with each
message before forwarding these messages to the unprocessed topic.
Table 1: Splunk delivery error types
| Delivery error type | Automatically retried by pipeline? | Example errorMessage attribute |
|---|---|---|
Transient network error |
Yes |
or
|
Splunk server 5xx error |
Yes |
|
Splunk server 4xx error |
No |
|
Splunk server down |
No |
|
Splunk SSL certificate invalid |
No |
|
JavaScript syntax error in the user-defined function (UDF) |
No |
|
In some cases, the pipeline applies exponential
backoff and
automatically tries to deliver the message again. For example, when the Splunk
server generates a 5xx error code, the pipeline needs to redeliver the
message. These error codes occur when the Splunk HEC endpoint is overloaded.
Alternatively, there could be a persistent issue that prevents a message from being submitted to the HEC endpoint. For such persistent issues, the pipeline does not try to deliver the message again. The following are examples of persistent issues:
- A syntax error in the UDF function.
- An invalid HEC token that causes the Splunk server to generate a
4xx"Forbidden" server response.
Performance and cost optimization
In regard to performance and cost optimization, you need to determine the maximum size and throughput for your Dataflow pipeline. You must calculate the correct size and throughput values so that your pipeline can handle peak daily log volume (GB/day) and log message rate (events per second, or EPS) from the upstream Pub/Sub subscription.
You must select the size and throughput values so that the system doesn't incur either of the following issues:
- Delays caused by message backlogging or message throttling.
- Extra costs from overprovisioning a pipeline.
After you perform the size and throughput calculations, you can use the results to configure an optimal pipeline that balances performance and cost. To configure your pipeline capacity, you use the following settings:
- The Machine type and Machine count flags are part of the gcloud command that deploys the Dataflow job. These flags let you define the type and number of VMs to use.
- The Parallelism and Batch count parameters are part of the Pub/Sub to Splunk Dataflow template. These parameters are important to increase EPS while avoiding overwhelming the Splunk HEC endpoint.
The following sections provide an explanation of these settings. When applicable, these sections also provide formulas and example calculations that use each formula. These example calculations and resulting values assume an organization with the following characteristics:
- Generates 1 TB of logs daily.
- Has an average message size of 1 KB.
- Has a sustained peak message rate that is two times the average rate.
Because your Dataflow environment is unique, substitute the example values with values from your own organization as you work through the steps.
Machine type
Best practice: Set the
--worker-machine-type flag to n2-standard-4 to
select a machine size that provides the best performance to cost ratio.
Because the n2-standard-4 machine type can handle 12k EPS, we recommend that
you use this machine type as a baseline for all of your Dataflow
workers.
For this reference architecture, set the --worker-machine-type flag to a value
of n2-standard-4.
Machine count
Best practice: Set the
--max-workers flag to control the maximum number of
workers needed to handle expected peak EPS.
Dataflow autoscaling allows the service to adaptively change the
number of workers used to execute your streaming pipeline when there are changes
to resource usage and load. To avoid overprovisioning when autoscaling, we
recommend that you always define the maximum number of virtual machines that are
used as Dataflow workers. You define the maximum number of
virtual machines with the --max-workers flag when you deploy the
Dataflow pipeline.
Dataflow statically provisions the storage component as follows:
An autoscaling pipeline deploys one data persistent disk for each potential streaming worker. The default persistent disk size is 400 GB, and you set the maximum number of workers with the
--max-workersflag. The disks are mounted to the running workers at any point in time, including startup.Because each worker instance is limited to 15 persistent disks, the minimum number of starting workers is
⌈--max-workers/15⌉. So, if the default value is--max-workers=20, the pipeline usage (and cost) is as follows:- Storage: static with 20 persistent disks.
- Compute: dynamic with minimum of 2 worker instances (⌈20/15⌉ = 2), and a maximum of 20.
This value is equivalent to 8 TB of a Persistent Disk. This size of Persistent Disk could incur unnecessary cost if the disks are not fully used, especially if only one or two workers are running the majority of the time.
To determine the maximum number of workers that you need for your pipeline, use the following formulas in sequence:
Determine the average events per second (EPS) using the following formula:
\( {AverageEventsPerSecond}\simeq\frac{TotalDailyLogsInTB}{AverageMessageSizeInKB}\times\frac{10^9}{24\times3600} \)Example calculation: Given the example values of 1 TB of logs per day with an average message size of 1 KB, this formula generates an average EPS value of 11.5k EPS.
Determine the sustained peak EPS by using the following formula, where the multiplier N represents the bursty nature of logging:
\( {PeakEventsPerSecond = N \times\ AverageEventsPerSecond} \)Example calculation: Given an example value of N=2 and the average EPS value of 11.5k that you calculated in the previous step, this formula generates a sustained peak EPS value of 23k EPS.
Determine the maximum required number of vCPUs by using the following formula:
\( {maxCPUs = ⌈PeakEventsPerSecond / 3k ⌉} \)Example calculation: Using the sustained peak EPS value of 23k that you calculated in the previous step, this formula generates a maximum of ⌈23 / 3⌉ = 8 vCPU cores.
Determine the maximum number of Dataflow workers by using the following formula:
\( maxNumWorkers = ⌈maxCPUs / 4 ⌉ \)Example calculation: Using the example maximum vCPUs value of 8 that was calculated in the previous step, this formula [8/4] generates a maximum number of 2 for an
n2-standard-4machine type.
For this example, you would set the --max-workers flag to a value of 2
based on the previous set of example calculations. However, remember to use your
own unique values and calculations when you deploy this reference architecture
in your environment.
Parallelism
Best practice: Set the
parallelism parameter
in the Pub/Sub to Splunk Dataflow template to twice
the number of vCPUs used by the maximum number of Dataflow
workers.
The parallelism parameter helps maximize the number of parallel Splunk HEC
connections, which in turn maximizes the EPS rate for your pipeline.
The default parallelism value of 1 disables parallelism and limits the
output rate. You need to override this default setting to account for 2 to 4
parallel connections per vCPU, with the maximum number of workers deployed. As a
rule, you calculate the override value for this setting by multiplying the
maximum number of Dataflow workers by the number of vCPUs per
worker, and then doubling this value.
To determine the total number of parallel connections to the Splunk HEC across all Dataflow workers, use the following formula:
Example calculation: Using the example maximum vCPUs of 8 that was previously calculated for machine count, this formula generates the number of parallel connections to be 8 x 2 = 16.
For this example, you would set the parallelism parameter to a value of 16
based on the previous example calculation. However, remember to use your own
unique values and calculations when you deploy this reference architecture in
your environment.
Batch count
Best practice: To enable the Splunk HEC
to process events in batches rather than one at a time, set the
batchCount parameter to a value between 10 to 50 events/request for logs.
Configuring the batch count helps to increase EPS and reduce the load on the
Splunk HEC endpoint. The setting combines multiple events into a single batch
for more efficient processing. We recommend that you set the batchCount
parameter to a value between 10 to 50 events/request for logs, provided the max
buffering delay of two seconds is acceptable.
Because the average log message size is 1 KB in this example, we recommend that
you batch at least 10 events per request. For this example, you would set the
batchCount parameter to a value of 10. However, remember to use your own
unique values and calculations when you deploy this reference architecture in
your environment.
For more information about these performance and cost optimization recommendations, see Plan your Dataflow pipeline.
Deployment
To deploy this reference architecture, see Deploy log streaming from Google Cloud to Splunk.
What's next
- For a full list of Pub/Sub to Splunk Dataflow template parameters, see the Pub/Sub to Splunk Dataflow documentation.
- For the corresponding Terraform templates to help you deploy this
reference architecture, see the
terraform-splunk-log-exportGitHub repository. It includes a pre-built Cloud Monitoring dashboard for monitoring your Splunk Dataflow pipeline. - For more details on Splunk Dataflow custom metrics and logging to help you monitor and troubleshoot your Splunk Dataflow pipelines, refer to this blog New observability features for your Splunk Dataflow streaming pipelines.
- Explore reference architectures, diagrams, and best practices about Google Cloud. Take a look at our Cloud Architecture Center.