本页演示如何使用 dashboard.lkml 文件中的 LookML 信息中心参数添加和自定义 type: looker_grid 的 LookML 信息中心元素。
如需了解如何通过 Looker 界面构建表格图表,请参阅表格图表选项文档页面。
用法示例
## BASIC PARAMETERS
name: element_name
title: 'Element Title'
type: looker_grid
height: N
width: N
top: N
left: N
row: N
col: N
refresh: N (seconds | minutes | hours | days)
note_state: collapsed | expanded
note_display: above | below | hover
note_text: 'note text'

## QUERY PARAMETERS
model: model_name
explore: explore_name
fields: [view_name.field_name, view_name.field_name, …]
dimensions: [view_name.field_name, view_name.field_name, …]
measures: [view_name.field_name, view_name.field_name, …]
sorts: [view_name.field_name asc | desc, view_name.field_name, …]
pivots: [view_name.field_name, view_name.field_name, …]
fill_fields: [view_name.field_name, view_name.field_name, …]
subtotals: [view_name.field_name, view_name.field_name, …]
total: true | false
row_total: right | left | false
limit: N
column_limit: N
filters:
  view_name.field_name: 'Looker filter expression' | 'filter value'
filter_expression:  'Looker custom filter expression'
listen:
  dashboard_filter_name: view_name.field_name
query_timezone: 'specific timezone' | user_timezone
analysis_config: # can only be used when the Forecasting Labs feature is enabled
  forecasting:
  - confidence_interval: N
    field_name: view_name.field_name
    forecast_n: N
    forecast_interval: day | month | a time frame with dimension fill
    seasonality: N
merged_queries:
- 'primary query definition'
- 'next source query definition'
  join_fields:
  - field_name: view_name.field_name
    source_field_name: view_name.field_name

## COLUMN PARAMETERS
auto_size_all_columns: true | false
column_order: [view_name.field_name, view_name.field_name, …]
pinned_columns:
    view_name.field_name: left

## PLOT PARAMETERS
table_theme: editable | white | gray | transparent | unstyled
show_row_numbers: true | false
hide_totals: true | false
hide_row_totals: true | false
transpose: true | false
hidden_fields: [view_name.field_name, view_name.field_name, …]
limit_displayed_rows: true | false
limit_displayed_rows_values:
  show_hide: show | hide
  first_last: first | last
  num_rows: 'N'

## SERIES PARAMETERS
truncate_text: true | false
show_view_names: true | false
size_to_fit: true | false
dynamic_fields:
- table_calculation: {'table calculation definition'}
- measure: {'custom measure or custom filtered measure definition'}
- dimension: {'custom dimension definition'}
series_labels:
    view_name.field_name: 'Series Label'
series_column_widths:
    view_name.field_name: N
series_cell_visualizations:
    view_name.field_name:
        is_active: true | false
        palette:
            palette_id: 'palette ID'
            collection_id: 'collection ID'
            custom_colors:
            - 'color value'
        value_display: true | false
series_text_format:
    view_name.field_name:
        fg_color: 'color value'
        bg_color: 'color value'
        bold: true | false
        italic: true | false
        align: left | center | right
series_collapsed:
    view_name.field_name: true | false
series_value_format:
    view_name.field_name:
        format_string: 'value formatting string'

## FORMATTING PARAMETERS
color_application:
    collection_id: 'collection ID'
    palette_id: 'palette ID'
header_font_color: 'color value'
header_background_color: 'color value'
header_text_alignment: left | center | right
header_font_size: N
rows_font_size: N
enable_conditional_formatting: true | false
conditional_formatting_include_totals: true | false
conditional_formatting_include_nulls: true | false
conditional_formatting:
  {'desired conditional formatting'}
参数定义
| 参数名称 | 说明 | |
|---|---|---|
| 基本参数 | ||
name(适用于元素) |
创建元素 | |
title(适用于元素) |
更改元素名称向用户显示的方式 | |
type(适用于元素) |
确定要在元素中使用的可视化类型 | |
height(适用于元素) |
为 layout: tile 和 layout: static 信息中心定义了元素的高度(以 tile_size 为单位) |
|
width(适用于元素) |
以 layout: tile 和 layout: static 信息中心的形式以 tile_size 为单位定义元素的宽度 |
|
top |
以 layout: static 信息中心的 tile_size 为单位定义元素的自上至下位置。 |
|
left |
以 layout: static 信息中心的 tile_size 为单位定义元素的从左到右的位置 |
|
row |
以 layout: newspaper 信息中心行为单位定义元素从上到下的位置 |
|
col |
以 layout: newspaper 信息中心的列为单位定义元素的从左到右的位置 |
|
refresh(适用于元素) |
设置元素自动刷新的时间间隔 | |
note_state |
定义如果文字太大,无法容纳在元素宽度内,就会被收起或展开 | |
note_display |
定义元素上的备注位置 | |
note_text |
指定记事中显示的文本 | |
| 查询参数 | ||
model |
定义要用于元素查询的模型 | |
explore(适用于元素) |
定义要用于元素查询的探索 | |
fields |
定义要用于元素查询的字段。此字段可用于替代 dimensions 和 measures。 |
|
dimensions |
定义要用于元素查询的维度 | |
measures |
定义要用于元素查询的措施 | |
sorts |
定义要用于元素查询的排序 | |
pivots |
定义应该用于透视元素查询的维度 | |
fill_fields |
定义使用维度填充选项的维度 | |
subtotals |
定义小计费用的字段 | |
total |
指定是否针对表格可视化图表显示列总计 | |
row_total |
指定是否针对表格可视化图表显示行总计数据 | |
limit |
定义要用于元素查询的行数上限 | |
column_limit |
定义要用于元素查询的列限制 | |
filters(适用于元素) |
定义针对元素的查询不能更改的过滤条件 | |
filter_expression |
定义无法针对元素的查询更改的自定义过滤条件 | |
listen |
定义当元素创建 filters(针对信息中心)时,可以针对元素查询更改的过滤条件 |
|
query_timezone |
定义运行查询时应使用的时区 | |
analysis_config |
ADDED 21.14 定义应在运行查询时执行的预测分析。需要启用预测实验室功能。 | |
merged_queries |
定义合并结果查询 | |
| 列参数 | ||
auto_size_all_columns |
将每个表格列自动调整为符合列标题宽度或最长数据值的宽度(以较大者为准) | |
column_order |
对表格中的图表进行排序 | |
pinned_columns |
定义表格图表左侧的要固定(或冻结)的列 | |
| 图表参数 | ||
table_theme |
对表格可视化图表应用五个表格着色选项之一 | |
show_row_numbers |
设置是否在每个表格行开头显示行号 | |
hide_totals |
设置表格是否显示列总计数据 | |
hide_row_totals |
设置表格是否显示行总计值 | |
transpose |
设置是否将表格行转置到列 | |
hidden_fields |
指定要在查询中使用但对图表隐藏的所有字段 | |
limit_displayed_rows |
根据行在结果中的位置在可视化图表中显示或隐藏行 | |
| 系列参数 | ||
truncate_text |
使用省略号 (...) 缩短数据单元格内的列标题和文本 | |
show_view_names |
显示视图名称以及每个列标题的字段名称 | |
size_to_fit |
自动调整所有列的宽度,使表格能完美贴合被查看元素的宽度 | |
dynamic_fields |
包括表格图表中的表格计算或自定义字段 | |
series_labels |
为可视化图表中的每个列指定自定义标签 | |
series_column_widths |
指定可视化图表中的列的特定宽度 | |
series_cell_visualizations |
指定列是否使用单元格可视化可视化选项。此参数包含子参数 is_active、palette 和 value_display。 |
|
series_text_format |
指定每列的单元格文本布局。此参数包含子参数 fg_color、bg_color、bold、italic 和 align。 |
|
series_collapsed |
指定包含小计的列是否会显示收起 | |
series_value_format |
使用自定义格式定义列的值格式 | |
| 格式参数 | ||
color_application |
将颜色应用于单元格可视化图表和条件格式 | |
header_font_color |
对列标题应用字体颜色 | |
header_background_color |
对列标题的背景应用颜色 | |
header_text_alignment |
对列标题进行左对齐、右对齐或居中对齐 | |
header_font_size |
对字体大小应用字体大小 | |
rows_font_size |
为数据单元格中的文本设置字体大小 | |
enable_conditional_formatting |
设置为 true 可定义表可视化的颜色编码规则 |
|
conditional_formatting_include_totals |
指定颜色编码方案中是否包含总计 | |
conditional_formatting_include_nulls |
指定是否应将 null 值表示为 0 | |
conditional_formatting |
使用 conditional_formatting 及其子参数来定义用于对表可视化图表进行颜色编码的规则 |
|
基本参数
定义 LookML 信息中心元素时,您必须至少为 name 和 type 参数指定值。其他基本参数(例如 title、height 和 width)会影响元素在信息中心内的位置和外观。
name
本部分引用了信息中心元素中的
name参数。
name也可以用作信息中心过滤条件的一部分,如信息中心参数文档页面中所述。
每个 name 声明都会创建一个新的信息中心元素并为其命名。元素名称必须是唯一的。使用 layout: grid 信息中心时,elements 参数有时会引用名称。
- name: orders_by_date
title
本部分引用了信息中心元素中的
title参数。
title也可以用作信息中心的一部分,如信息中心参数文档页面中所述。
title也可以用作信息中心过滤条件的一部分,如信息中心参数文档页面中所述。
借助 title 参数,您可以更改元素名称向用户显示的方式。如果未指定,则标题默认为元素 name。
请参考下面的示例:
- name: sales_overview
  title: '1) Sales Overview'
如果您使用的是这种格式,它将显示为1) 销售概览,而不是显示为销售概览。
type
本部分引用了信息中心元素中的
type参数。
type也可以用作信息中心过滤条件的一部分,如信息中心参数文档页面中所述。
type也可用作联接的一部分,如type(针对联接)参数文档页面所述。
type也可以用作维度的一部分,如维度、过滤条件和参数类型文档页面中所述。
type也可以用作测量量的一部分,如测量类型文档页面所述。
type 参数决定了要在元素中使用的可视化图表类型。
- name: element_name
  type: text | looker_grid | table | single_value | looker_single_record |
        looker_column | looker_bar | looker_scatter | looker_line | looker_area |
        looker_pie | looker_donut_multiples | looker_funnel | looker_timeline |
        looker_map | looker_google_map | looker_geo_coordinates | looker_geo_choropleth | looker_waterfall | looker_wordcloud | looker_boxplot
如需简要了解不同类型的 LookML 信息中心元素,请参阅 type(适用于 LookML 信息中心)文档页面。
height
本部分引用了信息中心元素中的
height参数。
height也可以用作信息中心行的一部分,如信息中心参数文档页面中所述。
对于具有 tile 或 static 布局的信息中心
height 参数用于为 layout: tile 和 layout: static 信息中心定义元素的高度,以 tile_size(以像素为单位定义)为单位。
例如,以下代码会指定 tile_size: 100 和 height: 4,从而使 orders_by_date 元素的高度为 400 像素。
- dashboard: sales_overview
  tile_size: 100
  ...

  elements:
  - name: orders_by_date
    height: 4
    ...
对于具有 newspaper 布局的信息中心
height 参数用于定义 layout: newspaper 信息中心的元素高度(以 row 为单位)。
报纸版式的信息中心的默认元素高度为 6 行(约为 300 像素)。对于 preferred viewer 参数设置为 dashboards-next 的信息中心,最小高度为 1 行。对于 preferred viewer 参数设置为 dashboards 的信息中心,最小高度为 2 行。
例如,以下代码将一个元素的高度设置为 12 行,或者设置为其他元素的高度的两倍:
- dashboard: sales_overview
  layout: newspaper
  ...

  elements:
  - name: orders_by_date
    height: 12
    ...
width
本部分引用了信息中心元素中的
width参数。
width也可以用作信息中心的一部分,如信息中心参数文档页面中所述。
width 形参定义了 layout: tile 和 layout: static 信息中心元素的宽度(以 tile_size 为单位)。
例如,以下代码会指定 tile_size: 100 和 width: 4,使 orders_by_date 元素的宽度为 400 像素。
- dashboard: sales_overview
  tile_size: 100
  ...

  elements:
  - name: orders_by_date
    width: 4
    ...
width 参数用于为 layout: newspaper 信息中心定义元素的宽度(以列为单位)。
采用报纸布局的信息中心默认为 24 列宽。
例如,以下代码将元素设为信息中心宽度的一半:
- dashboard: sales_overview
  layout: newspaper
  ...

  elements:
  - name: orders_by_date
    width: 12
    ...
top
top 参数用于定义 layout: static 信息中心元素的元素自上而下的位置(以 tile_size 为单位)。
例如,以下代码会指定 tile_size: 100 和 top: 4,将 orders_by_date 元素的顶部边缘设为位于信息中心顶部 400 像素处。
- dashboard: sales_overview
  tile_size: 100
  ...

  elements:
  - name: orders_by_date
    top: 4
    ...
left
left 参数用于为 layout: static 信息中心定义元素的从左到右位置(以 tile_size 为单位)。
例如,以下代码会指定 tile_size: 100 和 left: 4,将 orders_by_date 元素的左边缘距离信息中心左侧 400 像素。
- dashboard: sales_overview
  tile_size: 100
  ...

  elements:
  - name: orders_by_date
    left: 4
    ...
row
对于 layout: newspaper 信息中心,row 参数用于定义元素顶部边缘所在的行。
信息中心从信息中心顶部的第 0 行开始。采用报纸布局的信息中心的默认元素高度为 6 行,这意味着信息中心顶部的信息中心元素 (row: 0) 将默认占用 0-5 行。
每行的高度为 50 像素,这意味着 6 行的默认元素高度为 300 像素。
例如,以下代码假定要设置在元素第二行的元素,假设元素设置为默认高度:
- dashboard: sales_overview
  layout: newspaper
  ...

  elements:
  - name: orders_by_date
    row: 6
    ...
col
对于 layout: newspaper 信息中心,col 参数定义了元素左侧边缘所在的列。
信息中心分为 24 列。信息中心位于信息中心左侧的 0 列。采用报纸布局的信息中心的默认元素宽度为 8 列,这意味着信息中心左侧的信息中心元素 (col: 0) 将默认占用 0-7 列。
例如,以下代码将设置要设置在信息中心第三列的元素:
- dashboard: sales_overview
  layout: newspaper
  ...

  elements:
  - name: orders_by_date
    col: 16
    ...
refresh
本部分引用了信息中心元素中的
refresh参数。
refresh也可以用作信息中心的一部分,如信息中心参数文档页面中所述。
refresh 参数允许元素定期自动重新加载,从而检索新鲜数据。在经常显示信息中心的设置(例如在办公室电视上)上,此设置通常很有用。请注意,要使该参数生效,必须在浏览器窗口中打开该信息中心。此设置不会在后台运行,无法“预热”信息中心缓存。
刷新率可以是任意秒数、不带小数的秒、分钟、小时数或天数。例如:
- name: orders_by_date
  refresh: 2 hours
设置较短的刷新间隔时,请务必谨慎小心。如果元素背后的查询是资源密集型查询,某些元素可能会让您的数据库产生超出预期的负载。
note_state
note_state 参数定义了如果备注过大,无法容纳在元素宽度范围内的任何一行时,是否会收起或展开。如果您选择 collapsed,而记事过长,则相应备注会以可点击的省略号 (...) 结尾,以用于阅读完整的备注。如果您选择 expanded,而记事很长,那么系统会在后面添加备注。
note_display
note_display 参数定义了备注在元素中的显示位置。above 会将备注放在元素顶部,below 会将备注放在元素底部,而 hover 会要求用户将鼠标悬停在 ? 图标上才能查看备注。
note_text
note_text 参数指定元素备注中显示的文本。
查询参数
定义 LookML 信息中心元素时,您必须至少为 model 和 explore 查询参数指定值,并且必须使用 dimensions 参数、measures 参数或 fields 参数指定至少一个字段。您还可以使用下述其他查询参数来控制信息中心元素中数据的显示方式。
model
model 参数用于定义要用于元素查询的模型。如果未指定,则默认为信息中心所在的模型。
- name: orders_by_date
  model: ecommerce
model 参数接受 LookML 常量。您可以在项目的清单文件中定义常量,然后使用语法 "@{constant_name}" 将该常量设置为 model 的值。使用常量可让您在一个位置定义模型的名称,如果您要更新多个信息中心元素使用的模型的名称,这尤其有用。
如需了解详情以及通过 LookML 信息中心使用常量的示例,请参阅 constant 参数文档页面。
explore
本部分引用了信息中心元素中的
explore参数。
explore也可以用作模型的一部分,如explore参数文档页面中所述。
explore也可以用作信息中心过滤条件的一部分,如信息中心参数文档页面中所述。
explore 参数定义了要用于元素查询的探索。
- name: orders_by_date
  explore: order
explore 参数接受 LookML 常量。您可以在项目的清单文件中定义常量,然后使用语法 "@{constant_name}" 将该常量设置为 explore 的值。使用常量可让您在一个位置定义探索的名称,在更新多个信息中心元素使用的探索的名称时,这尤其有用。
如需了解详情以及通过 LookML 信息中心使用常量的示例,请参阅 constant 参数文档页面。
fields
fields 参数用于定义元素查询要使用的字段。使用语法 view_name.dimension_name 指定字段。
## single field example
- name: orders_by_date
  fields: order.order_date

## multiple fields example
- name: orders_by_date
  fields: [order.order_date, order.order_count]
如果您使用 fields 参数,则无需使用 dimensions 和 measures 参数。
dimensions
dimensions 参数用于定义元素查询要使用的一个或多个维度。使用语法 view_name.dimension_name 指定维度。如果查询没有任何 dimensions,请勿添加。
## single dimension example
- name: orders_by_date
  dimensions: order.order_date

## multiple dimension example
- name: orders_by_date
  dimensions: [order.order_date, customer.name]
measures
measures 参数用于定义元素查询使用的一个或多个测量值。使用语法 view_name.measure_name 指定测量值。如果查询没有任何 measures,请勿添加。
## single measure example
- name: orders_by_date
  measures: order.count

## multiple measure example
- name: orders_by_date
  measures: [order.count, order_item.count]
sorts
sorts 形参定义了要用于元素查询的排序。系统会先列出主要排序,然后列出次要排序,以此类推。使用语法 view_name.field_name 指定维度或测量值。如果您想使用 Looker 的默认排序顺序,请勿添加 sorts。降序排序以 desc 为后缀;升序排序无需添加后缀。
## single sort example
- name: orders_by_date
  sorts: order.order_date desc

## multiple sort example
- name: orders_by_date
  sorts: [order.order_date desc, customer.name]
pivots
pivots 参数定义了应该为元素查询进行数据透视的维度。使用语法 view_name.dimension_name 指定维度。如果查询没有任何 pivots,请勿添加。
## single pivot example
- name: orders_by_date
  pivots: customer.gender

## multiple pivot example
- name: orders_by_date
  pivots: [customer.gender, customer.age_tier]
fill_fields
fill_fields 参数定义了使用维度填充选项的维度。使用语法 view_name.dimension_name 指定尺寸。
- name: orders_by_date
  fill_fields: [orders.created_date, orders.shipped_date]
subtotals
subtotals 参数定义了利用 Subtotals 选项的维度。使用语法 view_name.dimension_name 指定尺寸。
subtotals: [products.department, distribution_centers.name]
total
total 参数设置表格底部是否显示总计行。如需了解详情,请参阅显示总计。
total: true | false

## default value: false
row_total
row_total 参数设置表格的右侧或左侧是否显示总计列。仅当存在转轴时才有效。如需了解详情,请参阅显示总计。
row_total: right | left | false

## default value: false
limit
limit 参数定义了应该用于元素查询的行数上限。该限制适用于应用任何数据透视之前的行数。
- name: orders_by_date
  limit: 100
column_limit
column_limit 参数定义了元素查询应该使用的列限制。该限制适用于应用任何数据透视后的列数。
- name: orders_by_date
  column_limit: 100
filters
本部分引用了信息中心元素中的
filters参数。
filters也可以用作信息中心的一部分,如信息中心参数文档页面中所述。
filters也可以用作测量量的一部分,如filters参数文档页面所述。
filters 参数定义了应为元素查询使用的不可更改的过滤条件。如果您希望用户可以在信息中心内更改过滤条件,则应使用 filters 信息中心信息中心设置这些过滤条件,然后使用 listen 将其应用于元素。
filters 的语法为:
- name: element_name
  filters:
    orders.created_date: 2020/01/10 for 3 days
    orders.status: Shipped
    # You can create multiple filter statements
每个过滤条件都可以接受 Looker 过滤条件表达式或值常量。您还可以在过滤条件表达式中使用 _localization 或 _user_attributes 液体变量来设置灵活的过滤条件值。
filter_expression
filter_expression 参数为元素查询定义了不可更改的自定义过滤条件。如果您希望用户可以在信息中心内更改过滤条件,则应使用 filters 信息中心信息中心设置这些过滤条件,然后使用 listen 将其应用于元素。
- name: element_name
  filter_expression:
  - diff_days(${users.created_date},${user_order_facts.first_order_date}) > 60
Looker 过滤器表达式文档页面列出了 Looker 过滤器表达式。
listen
信息中心可以使用过滤条件来更改信息中心元素背后的数据。这些设置通过使用filters 信息中心参数进行设置。为了使影响某个元素的过滤条件,必须使用 listen 参数将该元素设为该监听器的“监听”。
listen 的语法为:
- name: element_name
  listen:
    filter_name_goes_here: dimension or measure on which to apply
                           the filter using view_name.field_name syntax
    # You can add more than one listen statement
例如,您可以创建一个名为 Date 的过滤条件,要求用户在界面中的过滤条件字段中输入日期。然后,您可以将用户输入的值应用到 orders_by_date 元素,如下所示:
- dashboard: sales_overview
  ...

  filters:
  - name: date
    type: date_filter

  elements:
 - name: orders_by_date
    listen:
      date: order.order_date
    ...
构建 LookML 信息中心文档页面对这一概念进行了更详细的说明。
query_timezone
query_timezone 参数指定查询将运行的时区。时区选项显示在 timezone 的值文档页面上。如果您要使用查看者的时区运行查询,可以将该值指定为 user_timezone。
- name: orders_by_date
  query_timezone: America/Los Angeles
- name: orders_by_customer
  query_timezone: user_timezone
analysis_config
从 Looker 21.14 开始,analysis_config 参数及其子参数会描述要用于可视化图表的任何查询分析。必须启用预测实验室功能,才能对可视化图表进行分析。
以下子参数可用于定义分析:
您可以使用以下语法创建预测:
  analysis_config:
    - forecasting:
      confidence_interval: 0.95
      field_name: orders.count
      forecast_n: 14
      forecast_interval: day
      seasonality: 7
forecasting
forecasting 是一种对可视化图表应用预测的分析类型。借助预测功能,分析师能够向新的或现有的“探索”查询快速添加数据预测,以帮助用户预测和监控特定数据点。
如需了解详情,请参阅可视化图表中的预测文档页面。
如需向可视化图表添加预测功能,必须启用预测实验室功能。
confidence_interval
confidence_interval 用于设置预测数据值的边界,这些值以小数表达式的形式输入。confidence_interval 是可选项,默认情况下为空。
confidence_interval: 0.99 | 0.98 | 0.95 | 0.90 | 0.80
请参阅可视化图表中的预测文档页面上的预测区间部分。
如需向可视化图表添加预测功能,必须启用预测实验室功能。
field_name
field_name 指定要添加到预测中的衡量名称(最多 5 个)。
field_name: view_name.field_name
forecast_n
forecast_n 指定预测的长度。
forecast_n: N # An integer that represents the length of the forecast
请参阅可视化图表中的预测文档页面上的长度部分。
如需向可视化图表添加预测功能,必须启用预测实验室功能。
forecast_interval
forecast_interval 设置预测数据值的持续时间间隔。系统会根据“探索”查询中的时间范围维度自动填充“forecast_interval”。
forecast_interval: day | month # a timeframe with dimension fill
请参阅长度文档页面。
如需向可视化图表添加预测功能,必须启用预测实验室功能。
seasonality
借助 seasonality,分析师可以在预测中考虑已知的周期或重复的数据趋势。seasonality 是可选项,默认情况下为空。
seasonality: N # An integer that represents the number of rows over which a cycle or pattern repeats
自动季节性设置以空 seasonality 值表示。
请参阅可视化中的预测文档页面上的季节性变化部分。
如需向可视化图表添加预测功能,必须启用预测实验室功能。
merged_queries
merged_queries 参数定义了如何从多个查询中合并结果。您可以在 merged_queries 参数下定义组件查询,并使用 join_fields 子参数来定义合并规则。
merged_queries 的语法为:
  merged_queries:
  - 'primary query definition'
  - 'next source query definition'
    join_fields:
    - field_name: 'field from the source query using the view_name.field_name syntax'
      source_field_name: 'joined field from the primary query using the
        view_name.field_name syntax'
    # more join_fields definitions as needed
  - 'next source query definition'
    join_fields:
    - field_name: view_name.field_name
      source_field_name: view_name.field_name
    # more join_fields definitions as needed
  # additional source queries and join_fields definitions as needed
在 merged_results 下定义的第一个查询是主查询,其他查询将合并到该查询中。
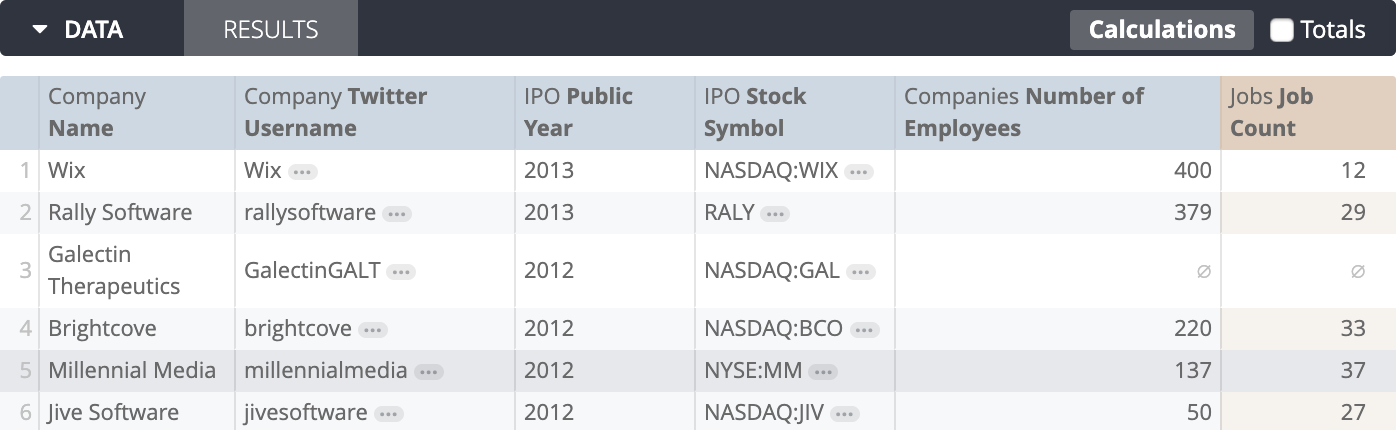
例如,通过联接股票代码、公司名称和 Twitter 用户名,您可以合并两个查询,以返回公司名称、公司 Twitter 用户名、IPO 年份、股票代码、员工数量和职位数的结果:
- name: merged_results_element
  title: Merged Results Tile
  merged_queries:
  - model: market_research
    explore: company_info
    fields: [company.name, company.twitter_username, ipo.public_year, ipo.stock_symbol]
    filters:
      company.twitter_username: "-NULL"
      ipo.valuation_amount: NOT NULL
    sorts: [ipo.public_year desc]
  - model: crunchbase
    explore: companies
    fields: [companies.name, ipo.stock_symbol, companies.twitter_username,
      companies.number_of_employees, jobs.job_count]
    filters:
      companies.number_of_employees: NOT NULL
      ipo.stock_symbol: "-NULL"
      companies.twitter_username: "-NULL"
    sorts: [jobs.job_count desc]
    join_fields:
    - field_name: ipo.stock_symbol
      source_field_name: ipo.stock_symbol
    - field_name: companies.name
      source_field_name: company.name
    - field_name: companies.twitter_username
      source_field_name: company.twitter_username
数据结果的格式如下所示:
然后,您可以应用元素参数,根据需要设置可视化图表的样式。
列参数
以下参数对应于在表格图表中移动和固定列的功能。
auto_size_all_columns
auto_size_all_columns 参数会将每个表格列的宽度调整为相应的列标题或最长数据值的宽度(以较大者为准)。此参数会替换 series_column_widths 和 size_to_fit 参数(如果已定义)。
- name: orders_by_date
  auto_size_all_columns: true
column_order
column_order 参数定义了表图表中列的顺序。
- name: orders_by_date
  column_order: [customer.city, customer.state, customer.count]
pinned_columns
pinned_columns 参数定义了固定在表格图表左侧的所有列。
- name: orders_by_date
  pinned_columns:
    orders.created_date: left
    distribution_centers.name: left
绘制参数
以下参数对应于表格图表可视化编辑器的图表菜单中的选项。
table_theme
使用 table_theme 参数可将以下某个表着色选项应用于表元素:
editable:该表采用蓝色尺寸、橙色测量值和绿色表格计算。white:表格标题为白色,数据行在白色和灰色交替显示,文本为黑色。gray:表格标题为灰色,数据行在白色和浅灰色之间切换,文本为深灰色。transparent:表格标题完全透明,数据行在完全透明和半透明灰色交替显示,而文本颜色则根据所显示的背景颜色从自身调整为黑色到白色。使用自定义嵌入信息中心时,将table_theme设置为transparent会很有用,以便通过可视化图表显示图块背景颜色。unstyled:表格标题和数据行为白色,文本为黑色。
table_theme: editable | white | gray | transparent | unstyled
show_row_numbers
show_row_numbers 参数用于设置是否在每个表格行的开头显示行号。
show_row_numbers: true | false
hide_totals
如果您的“探索”包含列总计值,hide_totals 会设置可视化图表是否显示总计值。
hide_totals: true | false
hide_row_totals
如果您的“探索”中包含行总计数据,hide_row_totals 会设置是否在可视化图表中显示行总计数据。
hide_row_totals: true | false
transpose
通过 transpose 参数,您可以将表中的行转置到列。它接受 true 或 false。
- name: orders_by_date
  transpose: true
hidden_fields
hidden_fields 参数用于指明在查询中使用哪些字段(如有),但隐藏在图表中。所有隐藏字段都会显示在“探索”的数据表格部分。
hidden_fields: [inventory_items.count, distribution_centers.id]
limit_displayed_rows
借助 limit_displayed_rows 参数,您可以根据可视化图表在结果中的位置在可视化图表中显示或隐藏行。例如,如果您的可视化图表显示 7 天的滚动平均值,您可能希望隐藏前 6 行。通过将其设置为 true,您可以使用 limit_displays_rows_values 参数及其子参数,在可视化图表中指定对其应用的值和位置。
limit_displayed_rows: true
limit_displayed_rows_values:
  show_hide: hide | show
  first_last: first | last
  num_rows: '10'
limit_displayed_rows_values
使用 limit_displayed_rows_values 参数及其子参数 show_hide、first_last 和 num_rows 以及 limit_displayed_rows 来指定在可视化图表中显示或隐藏的行。如需查看示例用法,请参阅上文中的 limit_displayed_rows。
show_hide
show_hide 子参数可设置是否在可视化图表中隐藏某些行。将 show_hide 设置为 show 即可在可视化图表中仅显示数量有限的行,而将 show_hide 设置为 hide 可在可视化图表中排除某些行。
first_last
first_last 子参数设置要隐藏还是要显示的行是结果集中的第一行还是最后一行。将 first_last 设置为 first 可显示或隐藏前几行,而将 first_last 设置为 last 可显示或隐藏最后一行。
num_rows
num_rows 子参数用于设置要隐藏或显示的行数。例如,num_rows: '10' 将在可视化图表中显示或隐藏结果集的前 10 行或后 10 行。
系列参数
以下参数对应于表格图表可视化编辑器的系列菜单中的选项。
truncate_text
truncate_text 参数用于设置是否应使用省略号 (...) 来缩短数据单元格内的列标题和文本。
truncate_text: true | false
show_view_names
show_view_names 参数决定了图表名称中是否显示视图名称,例如轴名称和列名称。
show_view_names: true | false

## default value: true
size_to_fit
size_to_fit 参数可设置是否调整所有列的宽度,使表格与其所查看元素的宽度完美匹配。如果 auto_size_all_columns 参数设为 true,它将替换 size_to_fit。
size_to_fit: true | false
dynamic_fields
dynamic_fields 参数及其子参数用于描述要用于可视化图表的任何表格计算或自定义字段。您必须拥有创建自定义字段的权限,才能添加长度不超过 255 个字符的description,或者为自定义群组或自定义箱使用calculation_type。您必须拥有创建表计算权限才能将最多包含 255 个字符的 description 添加到表计算中,或使用 calculation_type 执行快捷方式计算。
以下子参数可用于定义动态字段:
table_calculationmeasuredimensionlabelbased_ontypeexpressionfilter_expressionvalue_formatvalue_format_namecalculation_typeargs_kind_hint_type_hintis_disableddescription
您可以使用如下语法创建表计算:
dynamic_fields:
  - table_calculation: running_total
    label: Running Total of Items
    expression: running_total(${inventory_items.count})
    value_format_name: decimal_0
    description: your description of up to 255 characters here
    _kind_hint: measure
    _type_hint: number
    is_disabled: false
dynamic_fields:
- category: table_calculation
  description: your description of up to 255 characters here
  label: Percent of Orders Count
  value_format:
  value_format_name: percent_0
  calculation_type: percent_of_column_sum
  table_calculation: percent_of_orders_count
  args:
  - orders.count
  _kind_hint: measure
  _type_hint: number
- category: table_calculation
  description: your description of up to 255 characters here
  label: Percent of previous - Orders Count
  value_format:
  value_format_name: percent_0
  calculation_type: percent_of_previous
  table_calculation: percent_of_previous_orders_count
  args:
  - orders.count
  _kind_hint: measure
  _type_hint: number
- category: table_calculation
  description: your description of up to 255 characters here
  label: Percent change from previous - Orders Count
  value_format:
  value_format_name: percent_0
  calculation_type: percent_difference_from_previous
  table_calculation: percent_change_from_previous_orders_count
  args:
  - orders.count
  _kind_hint: measure
  _type_hint: number
- category: table_calculation
  description: your description of up to 255 characters here
  label: Rank of Orders Count
  value_format: ## this field is optional
  value_format_name: ## this field is optional
  calculation_type: rank_of_column
  table_calculation: rank_of_orders_count
  args:
  - orders.count
  _kind_hint: measure
  _type_hint: number
- category: table_calculation
  description: your description of up to 255 characters here
  label: Running total of Orders Count
  value_format: ## this field is optional
  value_format_name: ## this field is optional
  calculation_type: running_total
  table_calculation: running_total_of_orders_count
  args:
  - orders.count
  _kind_hint: measure
  _type_hint: number
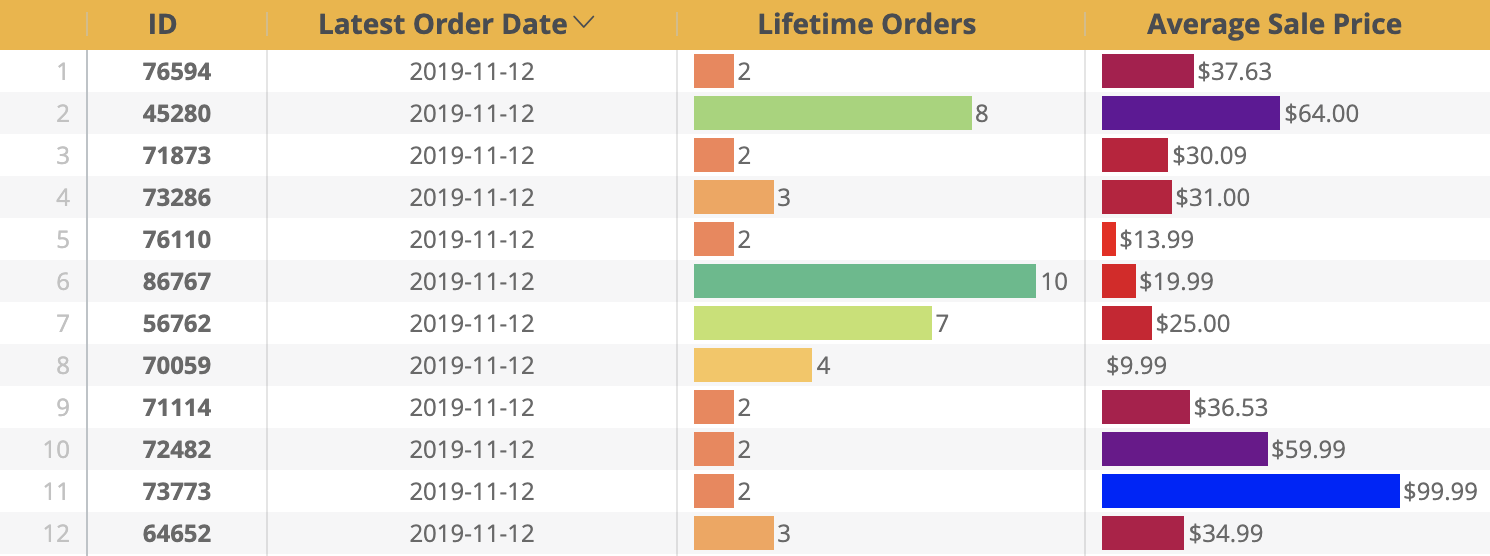
您可以使用一种如下所示的语法创建要在可视化图表中使用的自定义衡量方式:
dynamic_fields:
  - measure: avg_sale_price
    label: Average Sale Price
    based_on: products.sale_price
    type: average
    value_format_name: usd
    description: your description of up to 255 characters here
    _kind_hint: measure
    _type_hint: number
您可以使用以下语法创建要在可视化图表中使用的已过滤的自定义衡量指标:
dynamic_fields:
  - measure: order_count_for_25_47_year_olds
    based_on: order_items.order_count
    type: count_distinct
    label: Order Count for 25- to 47-Year-Olds
    description: your description of up to 255 characters here
    value_format: 00#
    _kind_hint: measure
    _type_hint: number
    filter_expression: "${users.age} >= 25 AND ${users.age} <= 47"
您可以使用一种如下所示的语法创建要在可视化图表中使用的自定义维度:
dynamic_fields:
  - dimension: user_city_state
    label: User City and State
    expression: concat(${users.city}, ", ", ${users.state})
    description: your description of up to 255 characters here
    _kind_hint: dimension
    _type_hint: string
您可以使用如下所示的语法为可视化图表中的维度创建自定义组:
  - category: dimension
  description: 'States by region'
  label: State Groups
  value_format: ## this field is optional
  value_format_name: ## this field is optional
  calculation_type: group_by
  dimension: state_groups
  args:
  - users.state
  - - label: Pacific Northwest
      filter: Oregon,Idaho,Washington
  - Other
  _kind_hint: dimension
  _type_hint: string
您可以使用如下所示的语法为可视化图表中的维度创建自定义分箱:
- category: dimension
  description: Order item sale prices, in tiers of 10
  label: Sale Price Bins
  value_format:
  value_format_name:
  calculation_type: bin
  dimension: sale_price_bins
  args:
  - order_items.sale_price
  - '10'
  - '0'
  - '100'
  -
  - classic
  _kind_hint: dimension
  _type_hint: string
您可以向元素添加多个动态字段。您无需向 fields 参数中添加表的计算数据,它们便会显示在可视化图表中,但需要向 fields 添加其他类型的动态字段才能使它们显示。
table_calculation
如果您要定义表计算,可以使用 table_calculation 子参数指定表计算。这是在 LookML 中引用表计算时使用的名称。
measure
measure 子参数会定义自定义衡量名称或已过滤的自定义衡量的名称。这是您在 LookML 中用于引用测量结果的名称。
dimension
dimension 子参数定义自定义维度的名称。这是在 LookML 中引用维度的名称。
label
label 子参数定义了您希望在可视化图表中显示的动态字段的标题。该名称可以与 table_calculation、measure 或 dimension 子参数中指定的名称相同或不同。
based_on
如果您使用的是自定义测量或已过滤的自定义测量,则 based_on 子参数会使用 view_name.field_name 语法识别其基于的测量。
type
如果您使用的是自定义衡量方式,则 type 子参数会标识汇总类型。接受 count_distinct、sum、average、min、max 或 median。
description
在计算任何使用 description 子参数的自定义字段或表格时,您最多可以添加 255 个字符的说明。用户在字段选择器中点击字段名称右侧的信息图标,以及将鼠标悬停在“探索”、信息中心或“查看”的表格或表格图表的列名称上时,Looker 会显示相应的说明。
expression
如果您使用的是表计算,则 expression 子参数会定义用于创建表计算的 Looker 表达式。
filter_expression
如果您使用的是自定义过滤指标,则 filter_expression 子参数会定义用于过滤衡量结果的 Looker 表达式。
value_format
可选的 value_format 子参数定义了在使用自定义格式时动态字段的值的格式。如果您想使用默认 Looker 格式,请改用 value_format_name。
value_format_name
可选的 value_format_name 子参数会将默认格式应用于动态字段。如果您想使用自定义格式,请改用 value_format。
calculation_type
calculation_type 子参数定义了快捷方式计算或组函数的类型,用以创建表格计算或为维度创建自定义组:
自定义字段 calculation_type 选项:
group_by- 根据指定的自定义条件将维度值分组到自定义固定标签下。类似于 SQL 中的CASE WHEN或 LookMLcase字段参数。bin- 针对数字类型维度和自定义维度,将自定义箱子或层级中的值分组。与 LookMLtier维度类型类似。
表计算 calculation_type 选项:
percent_of_column_sum- 行值除以列中值的总和。只有在达到查询行数上限时,此数据才会包含数据表中的值。percent_of_previous- 当前行的值除以下方行的值。percent_difference_from_previous- 当前行值与下方行值之间的差值除以下一行的值。rank_of_column- 行值在列中所有值中的排名。只有在达到查询行数上限时,此数据才会包含数据表中的值。running_total- 当前行的值与列中所有先前行值的累计总和。percent_of_previous_column- 对于透视字段,当前列的值除以其左侧的列值。percent_change_from_previous_column- 对于透视字段,当前列值与左侧列值之间的差值除以左侧列的值。percent_of_row- 对于透视字段,当前列值的百分比除以该字段的总和。running_row_total- 对于透视字段,当前列与此行之前的所有列的累计总和。
args(针对自定义群组)
如果您为维度使用自定义组,args 会指定将固定标签应用到维度值的参数。args 采用以下格式:
args:
- view_name.field_name
  - label: specified custom label
    filter: condition for values
  - label: another specified custom label
    filter: a different condition for values
- Other ## An optional customizable group label for values that do not meet specified conditions.
您可以根据需要添加任意数量的 label 和 filter 条件,具体取决于所需的组数。
有关参考信息,请参阅上一个示例。
args为自定义箱
如果您针对数值维度使用自定义分箱,则 args 会指定将固定层级应用于维度值的参数。args 采用以下格式:
  args:
  - view_name.field_name
  - bin_size ## The numeric interval on which to base each bin, in single quotes
  - min ## The numeric value of the minimum bin size, in single quotes
  - max ## The numeric value of the maximum bin size, in single quotes
  - override ## A value will only appear when a custom bin uses a Custom-sized bin type.
  - style ## The bin display style. Currently, only classic is supported.
有关参考信息,请参阅上一个示例。
用于计算快捷方式的 args
您可以在 args 子参数中指定用于快捷方式计算的数字字段的名称。参数采用以下格式:
- args:
  - view_name.field_name   ## the field on which the calculation is based
有关参考信息,请参阅上一个示例。
_kind_hint
可选的 _kind_hint 子参数用于标识动态字段是返回维度还是衡量值。它接受值 dimension 和 measure。
_type_hint
可选的 _type_hint 子参数用于标识动态字段的表达式应生成的数据类型。
is_disabled
可选的 is_disabled 子参数指定表计算是否会显示在可视化图表及其底层“探索”中。它接受值 true 和 false。
series_labels
使用 name: label 对,根据系列名称设置一个或多个系列的标签。
对于透视图表,系列名称是数据透视表名称。
series_labels:
  'Yes': iOS Users
  'No': Android Users
对于包含多个测量值的图表,系列名称是测量字段名称。
series_labels:
  inventory_items.count: Inventory
  orders.count: Orders
series_column_widths
根据系列名称设置一个或多个列的宽度。如果 auto_size_all_columns 参数设为 true,它将替换 series_column_widths。
series_column_widths:
  order_times.shipping_time: 50
  orders.count: 60
series_cell_visualizations
使用 view_name.field_name 格式指明系列名称,可指定是否使用单元格可视化选项。series_cell_visualizations 具有子参数 is_active、palette 和 value_display。
series_cell_visualizations:
  order_items.count:
    is_active: true
    palette:
      palette_id: my-custom-colors-sequential-0
      collection_id: my-custom-colors
    value_display: true
is_active
可选的 is_active 子参数接受 true 或 false,用于指示是否已为该系列启用条形图。如果未定义 is_active,则默认为 true。
palette
palette 子参数是可选的。如果未使用该调色板,调色板将默认采用实例的默认颜色集合中的不同调色板。
如果使用了 palette,子参数 palette_id 和 collection_id 会将特定调色板中的颜色应用于条形图的呈现效果。对于 palette_id,您必须使用顺序或分色调色板的 ID。如需详细了解调色板 ID 和颜色集合 ID,请参阅 color_application 部分。
palette 有一个备用子参数 custom_colors,该参数会为条形设置两到五种自定义颜色:
series_cell_visualizations:
  order_items.count:
    palette:
      custom_colors:
      - orange
      - "#0000ff"
      - red
value_display
可选的 value_display 子参数接受 true 或 false,用于指示每个数据单元格的值是否与单元格可视化图表一起显示。如果未定义 value_display,则默认为 true。
series_text_format
series_text_format 参数及其子参数会为每个列指定单元格文本布局。要设置格式的序列使用 view_name.field_name 语法指示,子参数则描述格式。
所有子参数都是可选的;请只使用您所需的参数。
  series_text_format:
    order_items.shipping_time:
      align: right
    order_items.shipped_date:
      align: center
      fg_color: "#EA8A2F"
      bg_color: "#64518A"
      bold: true
      italic: true
fg_color
fg_color 子参数指示单元格文本的字体颜色。颜色值可以采用十六进制字符串(例如 #2ca6cd)或采用 CSS 命名的颜色字符串(例如 mediumblue)。
bg_color
bg_color 子参数表示单元格背景颜色。颜色值可以采用十六进制字符串(例如 #2ca6cd)或采用 CSS 命名的颜色字符串(例如 mediumblue)。
bold
bold 子参数会指明单元格文本是粗体显示还是接受 true 或 false。
italic
italic 子参数指示单元格文本是否为斜体,并接受 true 或 false。
align
align 子参数表示单元格文本的对齐方式,接受 left、center 或 right。
series_collapsed
series_collapsed 参数定义了特定系列的收起或展开小计。使用 view_name.field_name 语法和 true 或 false 标识数据系列。
series_collapsed:
  users.city: false
  users.state: true
如果此列处于收起状态,那么点击数据单元格左侧的箭头后,系统会显示小计的各个元素。
series_value_format
series_value_format 参数指定要应用于系列的格式,与应用于底层维度或衡量的格式无关。如果未指定 series_value_format,则该值将以基础维度或测量值的格式显示。
使用 view_name.field_name 语法确定需要格式化的系列图书。
借助 format_string 子参数,您可以使用 Excel 样式的格式定义系列的格式。
series_value_format:
  products.retail_price:
    format_string: "$#,##0.00"
您还可以按如下方式定义格式:
series_value_format:
  order_items.count: "00#"
format_string 子参数中使用的格式与 value_format LookML 参数使用的格式相同。如需了解如何指定这些格式,请参阅为数字字段添加自定义格式文档页面。
格式参数
以下参数对应于表格图表可视化编辑器的格式设置菜单中的选项。
color_application
color_application 参数及其子参数 collection_id 和 palette_id 可用于将特定的颜色集合和调色板应用于信息中心元素。如需简要了解 Looker 的原生颜色集合,请参阅颜色集合文档页面。
如果您有要使用的调色板的集合 ID 和调色板 ID,可在 collection_id 和 palette_id 子参数中输入这些 ID。集合 ID 或调色板 ID 可以是字母数字代码,也可以基于颜色集合的名称。字母数字代码用于 Looker 的原生集合。它们特定于实例,如下所示:
color_application:
  collection_id: 1297dk12-86a7-4xe0-8dfc-82de20b3806a
  palette_id: 93c8aeb7-3f8a-4ca7-6fee-88c3617516a1
自定义颜色集合使用基于颜色集合的名称的集合和调色板 ID,这些 ID 可在实例间移植,如下所示:
color_application:
  collection_id: blue-tone-collection
  palette_id: blue-tone-collection-categorical-0
您还可以使用界面找到所需颜色、集合或调色板,并生成 LookML 以将其添加到信息中心。前往一项用户定义的内容(例如 Look、信息中心或探索),并使用界面将您希望的颜色、集合或调色板应用于相应内容的可视化图表。完成此操作后,您就可以按照获取信息中心 LookML 的步骤,复制生成的 LookML 并将其粘贴到 color_application 部分。
header_font_color
header_font_color 参数会将字体颜色应用于列标题。
颜色值可以采用十六进制字符串(例如 #2ca6cd)或采用 CSS 命名的颜色字符串(例如 mediumblue)。
header_font_color: purple
默认颜色取决于使用 table_theme 参数定义的表主题。
header_background_color
header_background_color 参数会将颜色应用于背景列标题。
颜色值可以采用十六进制字符串(例如 #2ca6cd)或采用 CSS 命名的颜色字符串(例如 mediumblue)。
header_background_color: #add8e6
默认颜色取决于使用 table_theme 参数定义的表主题。
header_text_alignment
header_text_alignment 参数会对列标题应用 left、right 或 center 对齐方式。
header_text_alignment: center
默认对齐方式为 left。
header_font_size
header_font_size 参数会将字体大小(从 1 到 99)应用于列标题。
header_font_size: 16
标题和行字体的默认大小为 12。
rows_font_size
rows_font_size 参数会将从 1 到 99 的字体大小应用于数据单元格中的文本,但不会应用于列标题。
rows_font_size: 8
标题和行字体的默认大小为 12。
enable_conditional_formatting
通过将 enable_conditional_formatting 设置为 true,您可以定义规则,为表格的可视化结果设置颜色代码:可以缩放,也可以指定感兴趣的值。
enable_conditional_formatting: true | false
conditional_formatting_include_totals
如果 enable_conditional_formatting 设置为 true,则 conditional_formatting_include_totals 会指定颜色编码方案中是否包含总计。
conditional_formatting_include_totals: true | false
conditional_formatting_include_nulls
如果 enable_conditional_formatting 设置为 true,conditional_formatting_include_nulls 会指定是否应该将 null 值表示为零。
conditional_formatting_include_nulls: true | false
conditional_formatting
将 enable_conditional_formatting 设置为 true 时,使用 conditional_formatting 参数定义用于对表可视化图表进行颜色编码的规则。对于每条条件格式规则,您可以使用以下参数指定设置:
以下是条件格式规则的示例:
conditional_formatting: [{type: less than, value: 20, background_color: "#9fdee0",
  font_color: "#b15928", bold: true, italic: false, strikethrough: false,
  fields: [order_items.count], color_application: {collection_id: my-custom-colors,
  palette_id: my-custom-colors-sequential-0}}]
type
type 参数用于指定是为缩放比例值设置颜色值,还是根据逻辑条件着色。
如果您要在颜色标度上使用颜色编码值,则可以将 type 设置为 along a scale...。
如果您根据逻辑条件对颜色值进行编码,则可以为 type 指定以下值之一,并为 value 指定值:
equal to:规则适用于等于value指定的值。not equal to:规则适用于不等于value指定数量的值。greater than:规则适用于大于value指定数量的值。less than:规则适用于小于value指定数量的值。between:该规则适用于为value指定的两个数字之间的值。not between:该规则适用于为value指定的两个数字以外的值。'null':此规则仅适用于 null 值。not null:此规则仅适用于非 null 值。
type: along a scale... | equal to | not equal to | less than | between | not between | 'null' | not null
value
如果您根据 'null' 或 not null 以外的逻辑条件对颜色值进行编码,请指定要应用规则的值。value 形参接受一个数字,当 type 设置为 between 或 not between 时,则是两个数字。
value: N | [N, N]
background_color
如果您的颜色编码基于逻辑条件(type 设置为 along a scale... 以外的任何值),请使用 background_color 参数为规则适用的值指定背景颜色。
background_color: "#49cec1"
font_color
如果您的颜色编码基于逻辑条件(type 设置为 along a scale... 以外的任何值),请使用 font_color 参数为规则适用的值指定字体颜色。
font_color: "#1f3e5a"
color_application
color_application 参数及其子参数 collection_id、palette_id 和 options 可用于将特定颜色集合和调色板应用于条件格式规则。
您可按集合 ID 和调色板 ID(如果有)向 LookML 信息中心添加颜色。您还可以使用界面找到所需颜色并生成 LookML 以将其添加到信息中心。前往一项用户定义的内容(例如 Look、数字面板或探索),并使用界面将所需颜色应用于相应内容的视觉效果。完成此操作后,您就可以按照获取信息中心 LookML 的步骤,复制生成的 LookML 并将其粘贴到 color_application 部分。如需简要了解 Looker 的预定义颜色集合,请参阅颜色集合文档页面。
将 type 设置为 along a scale... 时,可以使用 options 子参数。它具有以下子参数:
steps:此参数用于限制根据指定值使用的颜色数量,并将数据划分为该组数。如果不使用此参数,数据将根据覆盖整个调色板的渐变色着色。接受2到100的值。mirror:设为true时,对于已定义中心点的任意一侧的等值,此参数会在调色板的任一侧应用相同的颜色偏移。它接受true或false。constraints:此参数用于设置条件格式所适用的数据范围,并设置用于调色板应用的中心点。它接受以下语法:constraints: {min: {type: number, value: 3}, max: {type: percentile, value: 99}, mid: {type: average}}reverse:此参数用于确定在颜色应用期间是否反转调色板。它接受true或false。
bold
在根据逻辑条件进行颜色编码时,请设置是否加粗应用规则的值。
bold: true | false
italic
根据逻辑条件进行颜色编码时,请设置是否要为规则应用的值采用斜体格式。
italic: true | false
strikethrough
根据逻辑条件进行颜色编码时,请设置是否为您的规则的值添加删除线格式。
strikethrough: true | false
fields
指定规则应该应用到的字段。默认情况下,规则会应用于所有数字字段。
fields: [ view_name.field_name ]