This page guides you through the components of Explores and describes how to view and interact with Explore queries. Read the following sections to learn about these Looker concepts:
- How you might find existing Explore queries in Looker
- How to navigate the components of the Explore page
- How to drill into Explore data for additional details
- How to copy Explore values
- How to use Links and actions that might be available in the data
You can view and interact with Explores as much as you want without impacting other Looker users. Visit the Creating and editing Explores documentation page to learn more about creating or editing an Explore query.
Finding Explores in Looker
You can find prebuilt Explore queries in Looker in several ways, including the following:
- Select the Explore from Here link while editing Looks or dashboard tiles.
- Select the Explore from Here link on Alerts and scheduled deliveries.
- Follow links that are shared by other users.
- Use Quick Start analyses as a starting point in a blank Explore.
The Explore page
The Explore page consists of the following elements:

- Information about how many rows are in the Explore, how long the query took to run, how old the data is, and a link to view the Explore Performance panel.
- How long ago the data was queried (to display the date and time, hold the pointer over the relative time information).
- The time zone of the data you're viewing, if your admin has enabled user-specific time zones.
- The Run button, which executes the query and returns the results from the database.
- The Explore actions gear menu.
- The name of the Explore.
- The field picker, which contains the views and fields that are available to explore.
- The Filter panel, which displays the filters that are applied to Explores, as well as filter options.
- The Visualization panel, which displays the visualization that is produced from the query, as well as the visualization options. If the Visualization panel is open, the Visualization panel also displays the query tracker while the Explore query is running.
- The Data panel, which displays the fields that are selected, data limits, and any totals that are applied to an Explore query. If the Data panel is open but the Visualization panel is closed, the Data panel also displays the query tracker while the Explore query is running.
The Explore actions gear menu
The Explore actions gear menu on an Explore page lets users use or customize their Explore in several ways, depending on their permissions in Looker. Depending on user permissions and instance integrations, the options can include the following:
- Save — Select this option to perform these tasks:
- Save an Explore as a query tile to a new dashboard.
- Save an Explore as a query tile to an existing dashboard.
- Save an Explore as a Look.
- Download — Select this option to download the contents of an Explore in one of several format options.
- Send — Select this option to send an Explore as a one-off delivery.
- Save and schedule — Select this option to save an Explore as a Look and set a recurring delivery for that Look.
- Share — Select this option to obtain a short or an expanded Explore URL that you can copy and paste to share with other users.
- Get embed URL — Select this option to generate either a private embed URL or a signed embed URL, which you can use to embed the Explore into an iframe.
- Get LookML — Select this option to get an Explore's query and visualization LookML elements to add to a LookML dashboard, an aggregate table, or a native derived table.
- Merge results — Select this option to merge the results of an Explore query with the results from other Explore queries.
- Remove fields and filters — Select this option to remove all selected fields and filters from an Explore query.
- Clear cache and refresh — Select this option to override any data caching policies and force new results to be generated from the database.
Drilling down into the data
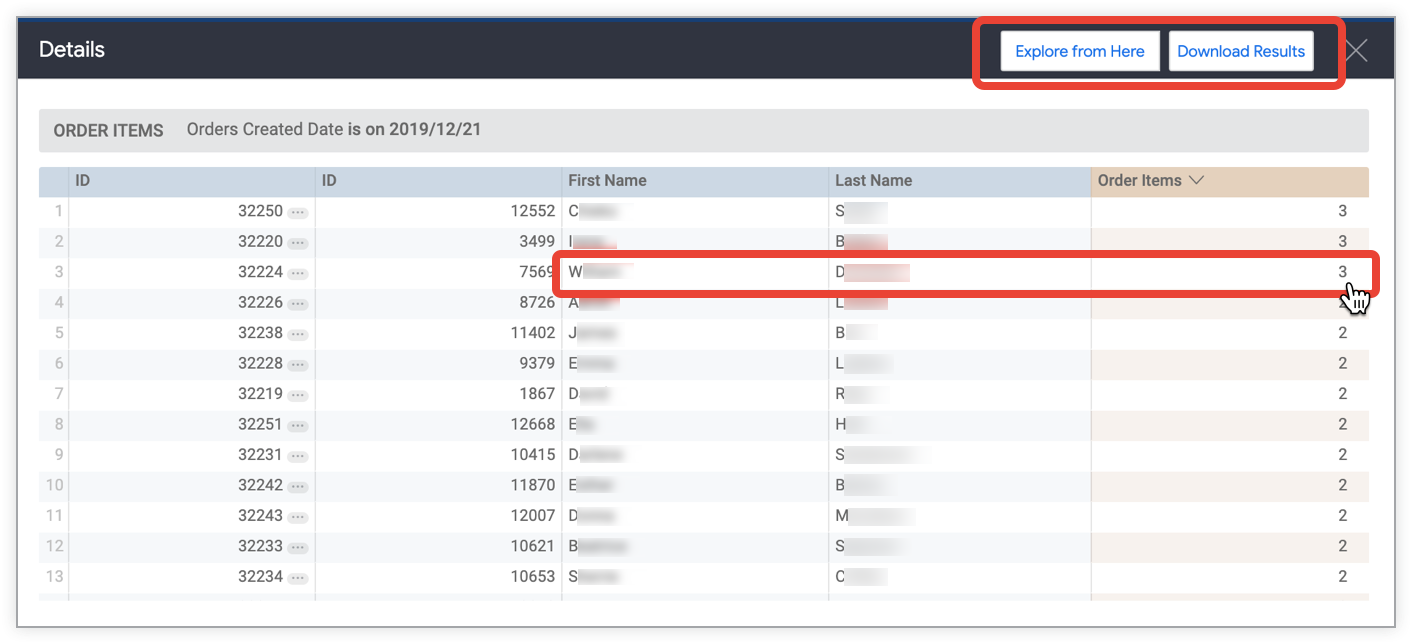
Every query result is the starting point for another query. Selecting any data point will drill down, creating another query refined by the data point you selected. For example, an Explore that displays Orders Count grouped by Orders Created Date December 21, 2019 had 39 orders. Selecting the count value of 39 opens a Details pop-up that displays a data table containing details about those specific 39 orders records.

Drilling deeper ...
The Details pop-up displays all the orders that were placed on December 21, 2019. From the Details pop-up, you can do the following:
- Select the Explore from Here button to open an Explore that uses the fields in the Details pop-up as a starting point.
- Select the Download Results button to download the data using the same options as shown on the Downloading content documentation page.
- Select a value from the Details pop-up data table to drill even further into the data.
And deeper still ...
You can select a value from the Details pop-up data table to keep drilling.
For example, you can select the Order Items value of 3 for customer W. D. listed on the Details pop-up to display a new Details data table that lists all of the order items in William D.'s order.
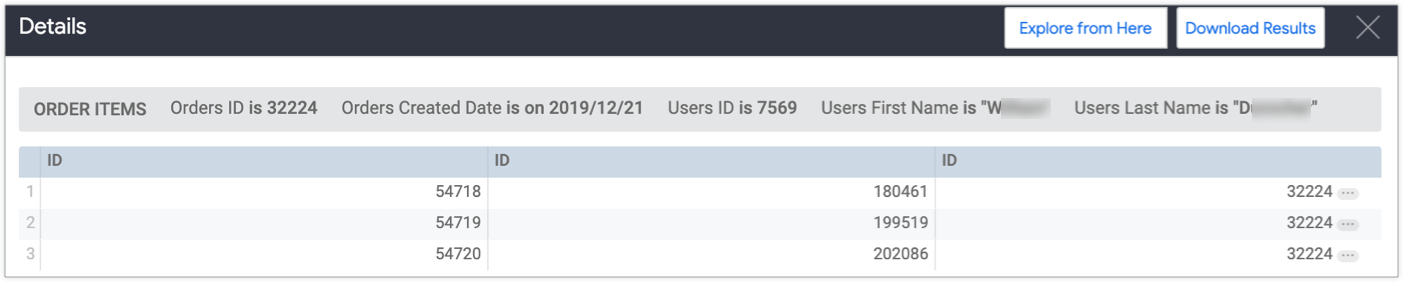
Looker query results are linked so you can keep drilling, exploring, and arriving at new insights.
Drilling into dashboards
For example, suppose you have a dashboard called Business Overview that has a global filter on the field State. In this example Explore, the Business Overview dashboard appears as an option in the Dashboards section of the drill menu for the State field, since the State field is used as a filter on that dashboard:
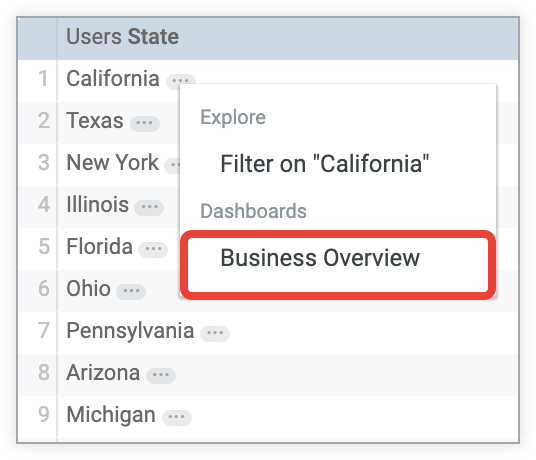
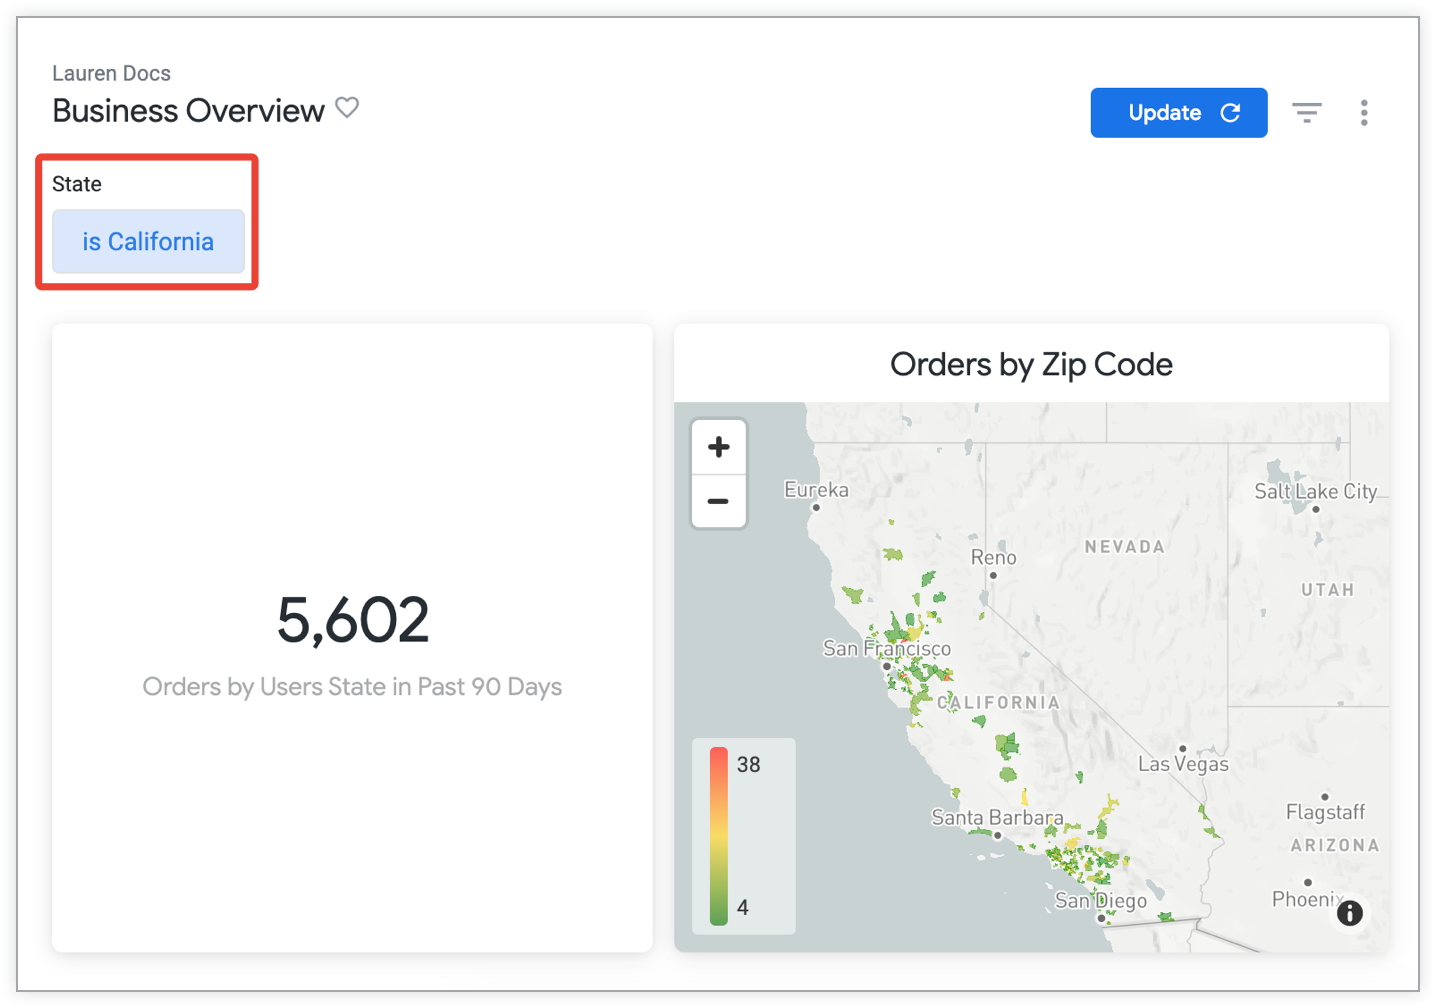
When you select the name of the dashboard in the drill menu, Looker takes you to the Business Overview dashboard, with the filter for the dashboard set to the value for the State field that you selected in the Explore.
For more information about how filters on dashboards are assigned to fields, see the Adding and editing user-defined dashboard filters documentation page.
Copying values
You can copy all the values from a table column to paste into a document or a tool like Excel or Google Sheets.
To copy the values for a field, select the gear icon next to the field name in the Data panel data table, and then choose Copy values.
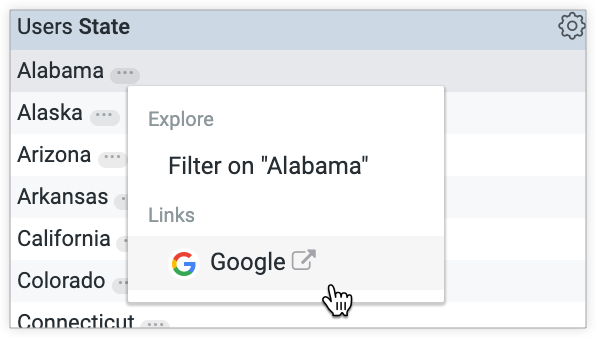
Using links and actions
The presence of links or actions is indicated by an ellipsis (…) following the value in a column.
Using links
Your Looker developers may have added links to your data. The option to open the link will be available in the Links section of the drill menu when you select a value in a data table column.
For example, if a developer adds a Google search link to the State field, Looker will provide an option to perform a Google search for a state name. You can select this option in the Links section of the drill menu when you select a state value from the State column in a data table.
Using data actions
Your Looker developers may have added data actions to the dimensions or measures in your data. With data actions, you can perform tasks with other tools directly from Looker, such as sending an email or setting values in other applications. These data actions appear in the drill menu in the Actions section.
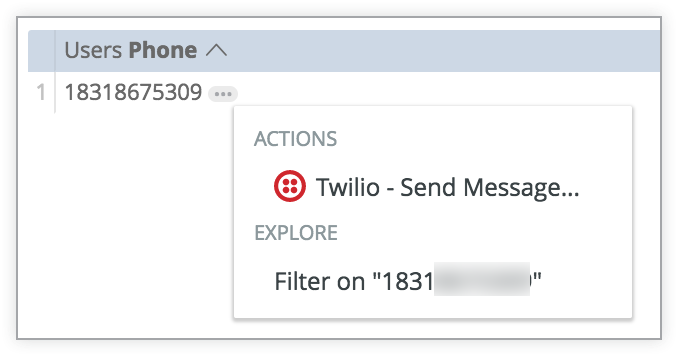
In the preceding example, the Phone field has a link to the Twilio service. When you select the phone number and choose the Twilio action, Twilio prompts you to enter a message. Twilio then sends that message to the phone number.
Conclusion
Now that you know how powerful the Looker Explore page is for learning more about data and discovering insights through iterative searches, you might want to learn how to do the following:
- Edit or build Explore queries from scratch.
- Save Explore queries as Looks.
- Add Explore queries to dashboards.
- Share data with other users.