The Query Performance Metrics Explore in System Activity provides detailed breakdowns of each query that is run from your Looker instance.
For example, you can use this Explore to investigate which components of a query took longest to load. You can also use this Explore to identify query performance trends and anomalies.
For more information about the Explores that are available in System Activity, see the Monitoring Looker usage with System Activity Explores documentation page.
Viewing query performance metrics
Query performance metrics are visible in the System Activity Query Performance Metrics Explore. You must be a Looker admin or have the see_system_activity permission to view the Query Performance Metrics Explore.
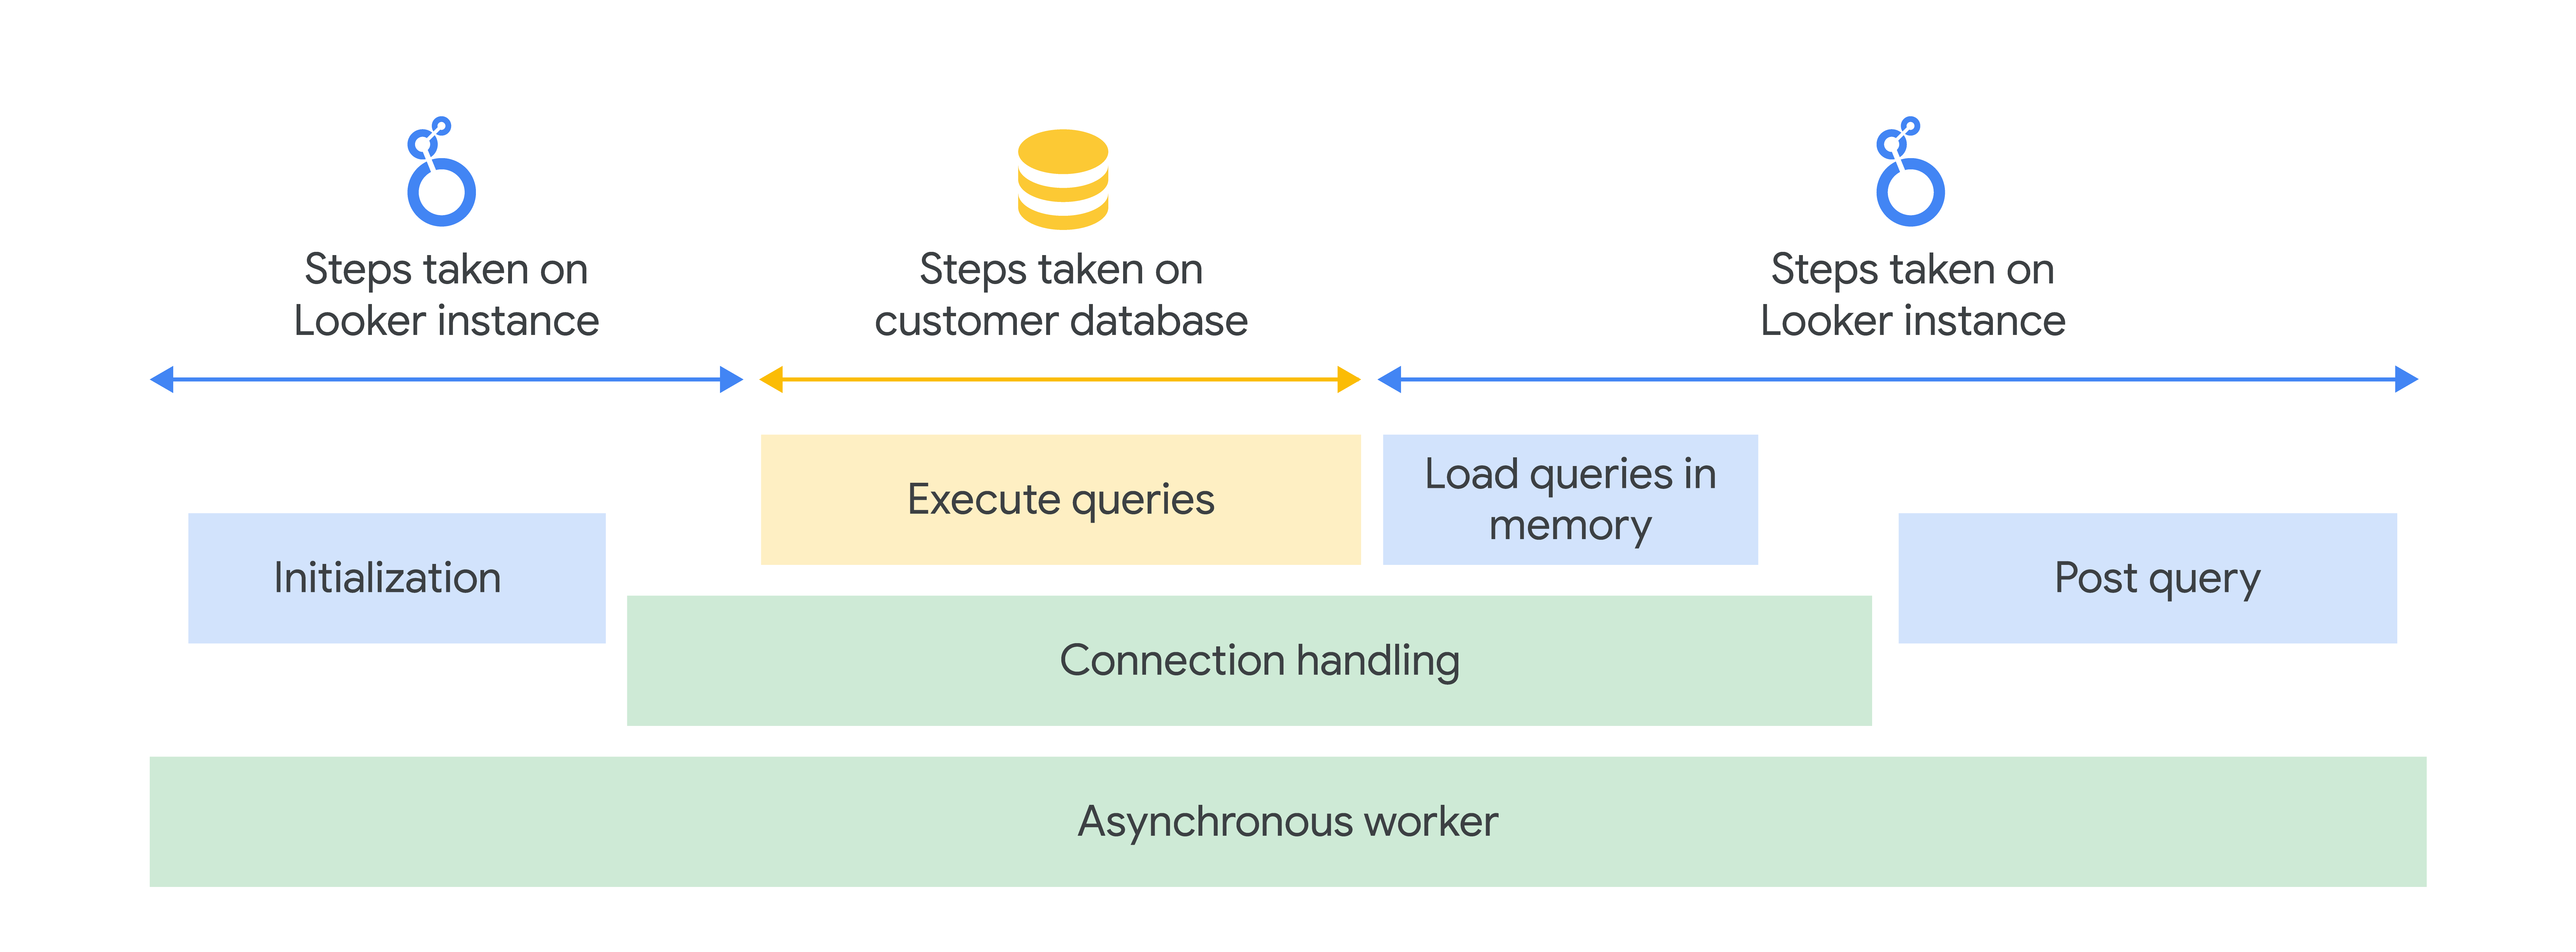
Understanding the Looker query lifecycle
Each query that Looker sends to your database goes through several phases, each with several steps. Each of these steps is represented as a dimension in the Query Performance Metrics Explore.
At a high level, the phases can be conceptualized as follows:
- Asynchronous worker phase: First, the query task must be assigned to an available asynchronous worker. There may be queue time if no worker is available.
- Initialization phase: Once an asynchronous worker is assigned, the Looker instance runs several initialization steps to prepare the query.
- Connection handling phase: Once initialization is complete, the Looker instance establishes a connection to the customer database.
- Main query phase: Once the Looker instance establishes a connection to the customer database, the main query is executed on the customer database. Additional queries to compute results, such as totals, may also be run depending on the options that are chosen for the query. If the query is not streamed, then the queries are loaded into memory on the Looker instance. After this, the connection from the Looker instance to the customer database is closed.
- Post-query phase: Finally, the Looker instance runs several post-query steps to prepare the query for its next destination. At this point, the asynchronous worker is released.
Query performance metrics
The following sections list each query phase and query step in chronological order.
Asynchronous worker phase metrics
| Query Step | Metric Description |
|---|---|
Queued |
Time in seconds that a query spends waiting for an asynchronous worker to be available to run the query. |
Async processing |
Time in seconds that an asynchronous worker spends on the query. The worker continues working on the query until after the post-query phase is complete, so this metric will overlap with most other metrics on this page. |
Initialization phase metrics
| Query Step | Metric Description |
|---|---|
Model Init: From Cache |
Time that it takes in seconds to pull the model definition from cache. If this returns a null value, that means that the model was loaded and parsed instead of pulled from cache. (See the Model Init: Computed step.) |
Model Init: Computed |
Time that it takes in seconds to load and parse the model required to run a query. If this returns a null value, that means that the model was retrieved from cache instead of loaded and parsed from scratch. (See the Model Init: From Cache step.) |
Explore Init: From Cache |
Time that it takes in seconds to pull the Explore initialization from cache. If this returns a null value, that means that the Explore was loaded and parsed instead of pulled from cache. (See the Explore Init: Computed step.) |
Explore Init: Computed |
Time that it takes in seconds to initialize the Explore before starting to prepare it. If this returns a null value, that means that the Explore was retrieved from cache instead of loaded and parsed from scratch. (See the Explore Init: From Cache step.) |
Prepare |
Time that it takes in seconds to prepare the query from the Explore definition. |
Connection handling phase metrics
| Query Step | Metric Description |
|---|---|
Per User Throttler |
Time in seconds that the query spends waiting for a connection to be available for the user to run the query. |
Acquire Connection |
Time that it takes in seconds for the Looker instance to acquire a connection to the customer database. This step includes the time to look up the credentials for the user, create the connection pool if it does not already exist, and initialize the connection for use. |
Connection Held |
Time in seconds that the Looker instance maintains a connection to the customer database. This step includes the time that it takes for the customer database to run the SQL query. |
Main queries phase metrics
| Query Step | Metric Description |
|---|---|
Cache Load |
Time that it takes in seconds to pull raw results from the result set cache. |
PDTs |
Time that it takes in seconds to build the persistent derived tables that are required for the query. |
Execute Main Query |
Time that it takes in seconds to run the primary query on the customer database. This does not include the time it takes to acquire a connection on the customer database. This is not tracked for queries that require the use of the Allow large results feature. |
Execute Totals Query |
Time that it takes in seconds to run the query to generate totals on the customer database. Only applies to queries with totals enabled. |
Execute Row Totals Query |
Time that it takes in seconds to run the query to generate row totals on the customer database. Only applies to queries with row totals enabled. |
Execute Grand Totals Query |
Time that it takes in seconds to run the query to generate the grand total on the customer database. Only applies to queries with both totals and row totals enabled. |
Load Process and Stream Main Query |
Time that it takes in seconds to load the main query (from the customer database), process it (on the Looker instance), and stream it (to the client). Only applies to streamed queries. |
Load Main Query In Memory |
Time that it takes in seconds to load the main query results in memory from the customer database. Only applies to non-streamed queries. |
Load Totals Query In Memory |
Time that it takes in seconds to load the query to generate totals into memory. Only applies to non-streamed queries with totals enabled. |
Load Row Totals Query In Memory |
Time that it takes in seconds to load the query to generate row totals into memory. Only applies to non-streamed queries with row totals enabled. |
Load Grand Totals Query In Memory |
Time that it takes in seconds to load the query to generate the grand total into memory. Only applies to non-streamed queries with both totals and row totals enabled. |
Post-query phase metrics
| Query Step | Metric Description |
|---|---|
Postprocessing |
Time in seconds necessary for post-processing the query. Occurs after the connection is closed. |
Stream to Cache |
Time that it takes in seconds to process and stream results to the render cache. |
BigQuery BI Engine metrics
If you are using BigQuery BI Engine with Looker, you can use the Query Performance Metrics Explore to view database-specific information about your queries. Queries that don't use BI Engine and queries of databases other than BigQuery databases return null values for these metrics.
| Metric | Metric Description |
|---|---|
BigQuery Job ID |
The BigQuery job ID for the query (or NULL). For faster response time for queries in BigQuery, Looker executes BigQuery queries using If BigQuery determines that it cannot return immediate results, BigQuery will create a job and the query will have a BigQuery job ID (and the BigQuery query ID will be NULL). |
BigQuery Query ID |
The BigQuery query ID for the query (or NULL). For faster response time for queries in BigQuery, Looker executes BigQuery queries using If BigQuery determines that it cannot return immediate results, BigQuery will create a job and the query will have a BigQuery job ID (and the BigQuery query ID will be NULL). If this field is blank, BigQuery was unable to execute the query immediately and instead created a job to run the query. See |
BI Engine Mode |
Whether the query was able to run partially or fully accelerated. See BI Engine acceleration statistics for more information on the possible values for this field. |
BI Engine Reason |
If the query was not able to run fully accelerated, this field displays the reason. This message comes directly from Google BigQuery. |
Troubleshooting with query performance metrics
Analyzing query metrics can help improve performance on your Looker instance. To get started, select the Performance Recommendations dashboard from the list of System Activity dashboards.